A Lean Six Sigma Framework for the Reduction of Ship Loading
Commercial Time in the Iron Ore Pelletising Industry
1st Author and Corresponding
Jose Arturo Garza-Reyes*
Centre for Supply Chain Improvement The University of Derby
Kedleston Road Campus, Derby, UK, DE22 1GB E-mail: [email protected]
Tel. +44(0)1332593281
2nd Author
Mustafa Al-Balushi
Warwick Manufacturing Group, The University of Warwick International Manufacturing Centre, University of Warwick
Coventry, UK, CV4 7AL E-mail: [email protected]
3rd Author
Jiju Antony
School of Management and Languages, Heriot-Watt University, Riccarton Campus, Edinburgh, UK, EH14 4AS
Email: [email protected] Tel. +44 (0)131 451 8266
4th Author
Vikas Kumar
Bristol Business School University of the West of England Coldharbour Ln, Bristol, UK, BS16 1QY
E-mail: [email protected] Tel. +44(0)1173283466
A Lean Six Sigma Framework for the Reduction of Ship Loading
Commercial Time in the Iron Ore Pelletising Industry
Abstract
Evidence suggests that specifically designed frameworks to implement Lean Six Sigma (LSS) projects to tackle particular problems are more effective than “generic” versions. This paper proposes an implementation framework to effectively deploy LSS to improve a key operation and performance indicator, i.e. ship loading commercial time, of one of the largest world producer of iron ore. This article therefore contributes with a refined framework to effectively implement LSS, and documents its successful application and effectiveness within the context of the case organisation. The LSS framework and project contributed in helping the studied organisation to improve both the capability of its ship loading process and commercial time by more than 30 percent, resulting in operational savings in the range of $300,000 USD per year. The systematic nature of the framework proposed also helped the organisation to establish a standardise routine to improve its operations. Managerial implications exposing the challenges faced during the implementation of LSS are also discussed to serve as lessons learnt to be considered in other LSS projects. Managers and engineers in charge of improving operations and processes can benefit from this paper as it can be used as a guide to direct the conduction of LSS projects and the empirical application of its principles and tools.
Keywords: DMAIC, Iron Ore Industry, Lean, Lean Six Sigma, Operations
Improvement, Six Sigma.
1. Introduction
2010; Chinbat and Takakuwa, 2008). Additionally, no evidence exists of the combination and integration of Lean and Six Sigma principles and tools i.e., through Lean Six Sigma, in the iron ore industry. This calls for further scholarly research to explore the application of Lean, Six Sigma or Lean Six Sigma to determine whether iron ore producers are capable of obtaining the same operational benefits that their counterparts in other industries have reported (e.g. Villarreal et al., 2016a; Villarreal et al., 2016b; Krueger et al., 2014; Vinodh et al., 2011; Jirasukprasert et al., 2014; Garza-Reyes et al., 2014).
When implemented as an integrated approach, Lean Six Sigma (LSS) utilises the Define-Measure-Analyse-Improve-Control (DMAIC) methodology for conducting improvement projects (Cudney et al., 2013). This systematic and rigorous implementation structure is one of the characteristic which makes LSS very effective (Garza-Reyes et al., 2014; Harry et al., 2010). However, despite the generic nature of DMAIC, Vinodh et al. (2011) suggest that in order to achieve effective results, a Lean Six Sigma framework must be scientifically and specifically designed to effectively implement and conduct LSS improvement initiatives. For this reason, authors such as Zhang et al. (2015), Vinodh et al. (2014), Krueger et al. (2014), Ghosh and Maiti (2014), Garza-Reyes et al. (2014), Vinodh et al. (2011), Chen and Lyu (2009), Deshmukh and Lakhe (2009), Breyfogle III (2008), Ward et al. (2008),Kumar et al. (2008), Gonçalves et al. (2008), Chakrabarty and Tan (2007), Kumar et al. (2006), Jarrar and Neely (2005) and Senapati (2004) have proposed specific Six Sigma and LSS implementation frameworks, based on DMAIC, to drive the improvement of also specific processes, rather than using the “generic” version of DMAIC. In some cases, stages have been added to or eliminated from the traditional five stages of DMAIC (Garza-Reyes et al., 2014; Deshmukh and Lakhe, 2009; Breyfogle III, 2008; Ward et al., 2008; Kumar et al., 2008; Gonçalves et al., 2008; Jarrar and Neely, 2005; Senapati, 2004), whereas in some others the five original stages of DMAIC have been followed, but the use of specific tools in every stage has been defined (Zhang et al., 2015; Vinodh et al., 2014; Krueger et al., 2014; Ghosh and Maiti, 2014; Vinodh et al., 2011; Chen and Lyu, 2009; Kumar et al., 2006).
This paper presents an action research-based case study where a specific implementation framework was designed, following the five traditional stages of DMAIC and defining the sequence of some activities and application of some LSS tools, to reduce the commercial loading time of ships of a large producer of iron ore. Thus, this paper not only contributes by proposing an specific and systematic approach that iron ore producers can adopt to improve their ship loading operations but it can also be adapted to improve other aspects of their operations. The company was being negatively affected by the dropping price of iron ore and hence it sought the improvement of operations to optimise assets and processes as a strategy to gain efficiency, and in this way combat this situation. In particular, the studied organisation had a challenge in its port operation, which needed to adhere to the ship loading specifications, in terms of time, in order to satisfy customers and avoid the demurrage fees for exceeding the agreed loading time.Therefore, a second contribution of this paper lies in its usefulness to be adopted as a guide for managers and engineers in charge of improving operations and processes. In this case, this paper can serve as a documented example of how to direct LSS projects and the empirical application of its principles and tools. Finally, the paper also intends to contribute by documenting and stimulating scientific research regarding the application of LSS in the iron ore industry, as this type of research has been identified as a gap in the academic literature.
ship loading commercial time of the studied organisation. Section 4 discusses the results of the project and its managerial implications, whereas Section 5 finally presents the conclusions, limitations and future research directions derived from this paper.
2. Proposed Framework for Lean Six Sigma Implementation and Research Methodology
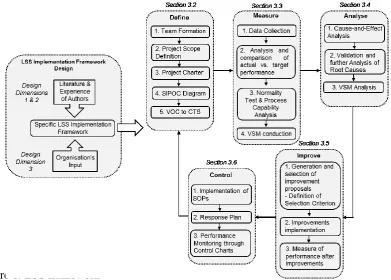
Figure 1 presents the Lean Six Sigma implementation framework proposed by the authors to the studied organisation for reducing the time of its ship loading operation. The framework was developed based on three ‘design dimensions’. The first dimension consisted of the activity of studying the characteristics, reason for development, and applicability of the various Six Sigma and LSS implementation frameworks highlighted in the previous section. This ensured the incorporation of the most current and relevant theoretical knowledge into the proposed framework (Chen and Lyu, 2009). The second dimension entailed the use of the vast theoretical and industrial experience of the authors as practitioners, consultants, researchers, and academics to support the development of the proposed framework. Rocha-Lona et al. (2013) suggest that practitioners’ experience plays a critical role while developing theoretical frameworks which are required to be deployed in industry. The theoretical and industrial experience of the authors on LSS is illustrated through a wide range of reported applications and development of relevant LSS theory and research (e.g. Villarreal et al., 2016a; Villarreal et al., 2016b; Sunder and Antony, 2015; Garza-Reyes et al., 2014; Jirasukprasert et al., 2014; Garza-Reyes et al., 2010; Kumar et al., 2006; Antony et al., 2005; etc.). Finally, the third dimension included the consideration of relevant input from the company. Thus, similarly as in the works of Vinodh et al. (2011) and Kumar et al. (2006), preliminary observations of the loading operation and discussions with relevant executives, directors, managers and shop-floor personnel were also carried out to consider, in the design of the implementation framework, key parameters and issues of the loading process. Thus, the LSS implementation framework proposed in this paper was specifically designed, as suggested by Vinodh et al. (2011), for the studied organisation and to address the particular problem it faced with long ship loading commercial time.
[image:4.595.94.486.481.761.2]
Similarly to the works of Zhang et al. (2015), Vinodh et al. (2014), Krueger et al. (2014), Ghosh and Maiti (2014), Vinodh et al. (2011), Chen and Lyu (2009), Kumar et al. (2006), the framework designed in this case followed the traditional DMAIC structure. However, the use of specific activities and tools, and their sequence, were explicitly defined for every DMAIC stage during the development of the framework when following the three design dimensions, see Figure 1.
Once designed, the LSS implementation framework was applied in the studied organisation. This characteristic led to an empirical study whose most appropriate research methods are case study or action research (Shadish et al., 2002; Bryman, 1989). In recent times, the use of a single detailed case study has been well accepted in scholarly research as a valid research method. For example, Voss et al. (2002) suggest that it is important to conduct and publish research based on cases study as they comment that, especially in the field of operations management, this type of research is particularly suitable for testing and developing new theory (McCutcheon and Meredith, 1993). On the other hand, evidence of the proliferation and acceptance of the action research approach as a valid research methodology, especially in Operations Management-based research, is apparent through the high volume of recent published researches supported by this method (e.g. Gutierrez et al., 2015; Farooq and O'Brien, 2015; Dey et al., 2015; Baker and Jayaraman, 2012; Cagliano et al., 2005). Since this study required the researchers to closely track and manage the deployment of the proposed LSS implementation framework and the improvement project as a whole, which required the presence and participation of the researchers to lead and aid such deployment and management (Gutierrez et al., 2015; Bryman, 1989), action research was considered the most suitable method to conduct this study. The action research method also ensured that problems and resistance during the application of the LSS framework were overcome with the direct help from one of the researchers (Gutierrez et al., 2015; Coughlan and Coghlan, 2002; Bryman, 1989). In the case of this research, and as suggested by Coughlan and Coghlan (2002), the action research approach proved to be a valuable method not only to test the proposed LSS implementation framework and draw conclusions regarding its effectiveness but also to document and report the experiences and lessons learnt by the authors while conducting the improvement of the ship loading commercial time. Thus, action research was an ideal research strategy that contributed in enriching the body of knowledge in the LSS field.
3. LSS Implementation Framework Application 3.1 Organisation’s background
The Lean Six Sigma framework proposed and followed as a part of the project conducted to address the problem is exemplified in the following sections.
3.2 The Define phase
The Define phase aims to delineate the LSS project’s team, scope, objectives, voice of customers, and process details (Ghosh and Maiti, 2014).
3.2.1 Team formation. The initial step in the Define phase consisted of forming the team. The project team was formulated with employees who were mainly responsible for performing the ship loading process, as according to Furterer (2009), team members should be selected from those who have a background and an adequate knowledge of the process. Thus, the team included four Shift Superintendents of port operations, a Planning Specialist, and one of the authors. The Shift Superintendents were responsible for the full operations of the port in each shift, whereas the Planning Specialist was responsible for planning the ships with the inventory management department. The participant author was the leader of this LSS improvement project. Additionally, the Port Operations Manager acted as a champion for the project, providing support and removing any barriers that occurred during the project implementation.
3.2.2 LSS project scope definition. Effectively defining the scope of the project is key for its successful implementation (Pyzdek and Keller, 2014; Furterer, 2009). The whole port operation of the case organisation consisted of loading and unloading. However, since the organisation was facing more challenges in the loading operation, top management decided to concentrate the LSS project only on this operation. Moreover, two types of products were loaded separately: manufactured iron ore pellets and sinter feed. Therefore, the project’s scope included the loading process of both iron ore pellets and sinter feed.
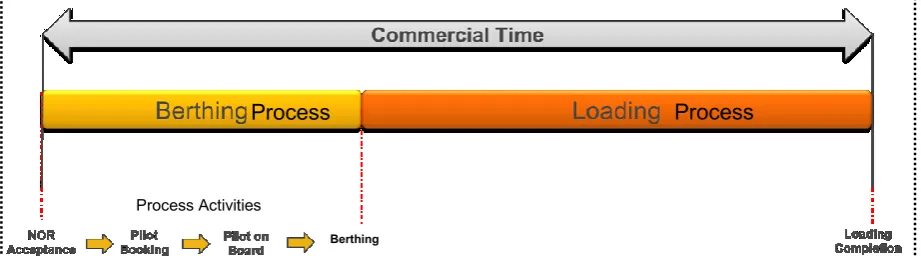
[image:6.595.65.526.549.677.2]The entire end-to-end process of the loading operation included a number of activities that were performed by different business units, see Figure 3 for a high level overview of these activities. However, since the ship loading commercial time only started to be counted since the nomination and operational readiness (NOR) activity, which is part of the berthing process, and until the ship was fully loaded, this LSS project only focused on improving the berthing and loading processes as illustrated by Figure 2.
Figure 2. Illustration of project’s scope in relation to considered processes and activities
3.2.3 Project charter. After forming the team and defining the project’s scope, every Lean Six Sigma project continues with the formulation of a project charter (Pyzdek and Keller, 2014). A project charter is both a tool that represents and summarises all the information related to the project, and a working document which specifies all the resources and
Berthing
Loading Operation
Process Process
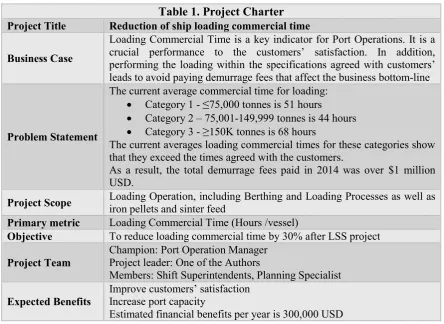
boundaries required (Basu, 2009). In the case of this LSS project, the project charter presented in Table 1 was created to offer a clear overview, to the team members and the management of the studied organisation, of the key initial parameters of the project.
Table 1. Project Charter Project Title Reduction of ship loading commercial time
Business Case
Loading Commercial Time is a key indicator for Port Operations. It is a crucial performance to the customers’ satisfaction. In addition, performing the loading within the specifications agreed with customers’ leads to avoid paying demurrage fees that affect the business bottom-line
Problem Statement
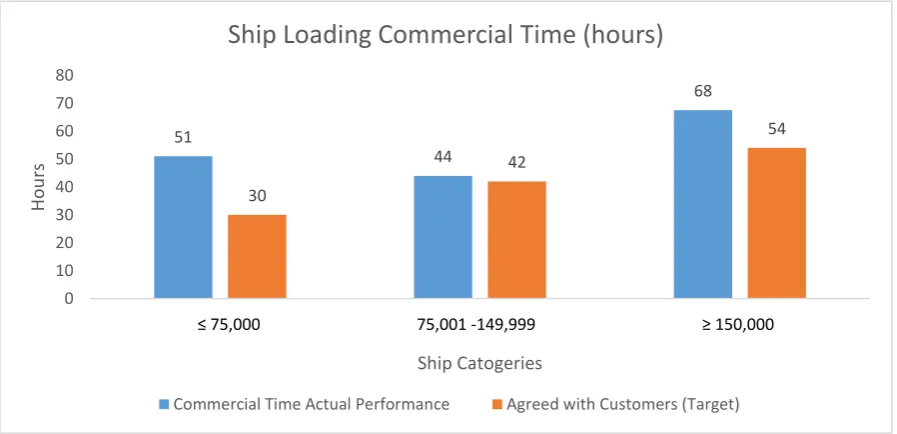
The current average commercial time for loading: Category 1 - ≤75,000 tonnes is 51 hours
Category 2 – 75,001-149,999 tonnes is 44 hours Category 3 - ≥150K tonnes is 68 hours
The current averages loading commercial times for these categories show that they exceed the times agreed with the customers.
As a result, the total demurrage fees paid in 2014 was over $1 million USD.
Project Scope Loading Operation, including Berthing and Loading Processes as well as iron pellets and sinter feed
Primary metric Loading Commercial Time (Hours /vessel)
Objective To reduce loading commercial time by 30% after LSS project
Project Team
Champion: Port Operation Manager Project leader: One of the Authors
Members: Shift Superintendents, Planning Specialist
Expected Benefits
Improve customers’ satisfaction Increase port capacity
Estimated financial benefits per year is 300,000 USD
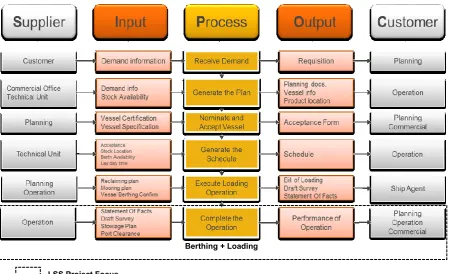
Figure 3. High-level SIPOC diagram for the end-to-end loading operation
3.2.5 Voice of the customer (VOC) and critical-to-satisfaction (CTS). The last project activity within the Define phase corresponded to collecting and translating the needs of the customer (i.e. voice of the customer) into specific critical-to-satisfaction (CTS) factors. These are related to factors which are critical to delivery (CTD), quality (CTQ) or cost (CTC) (de Mast, 2004) and that can significantly impact the process output (i.e. ship loading) (Basu, 2009). Since the ship loading commercial time depends on two major process contributors, namely: berthing and loading; the CTS factors were derived from both of them as shown in Figure 4.
Figure 4. Voice of the customer and CTS factors
Berthing + Loading
[image:8.595.84.514.507.726.2]3.3 The Measure phase
The objective of the Measure phase is to provide a structure to evaluate the actual performance of a process by statistically assessing, monitoring and comparing its current performance to its output (Pyzdek and Keller, 2014; Garza-Reyes et al., 2014; de Mast and Lokkerbol, 2012; Basu, 2009). In the case of this project, data was collected following a pre-established data collection plan that included the gathering of data regarding different characteristics of the loading process and its outputs. In particular, the data collected included characteristics of the loading process such as ship number, ship category (i.e. 1, 2 or 3) and product type (i.e. iron ore pellets and sinter feed) as well as outputs that consisted of loaded quantity, ship loading commercial time (in hours) and loading rate (tonnes/hours). The data was collected for a period of three months, which resulted in a sample of 155 ships being observed performing the loading operation. The data collected allowed the realisation of the subsequent analyses conducted in this and other phases of the project. These are presented in the following sections.
[image:9.595.72.521.393.610.2]3.3.1 Actual vs. agreed performance comparison. Ship loading commercial time represents one of the process performance outputs. Based on the actual performance of the ship loading commercial time collected as described above, the 155 observations were divided by ship category and their averages calculated (left column in Figure 5) and initially compared against the ship loading commercial time agreed with the customer (i.e. target) (right column in Figure 5), see Figure 5. This contributed in understanding the gap between the actual and the required performance of the ship loading process. As indicated in Figure 5, the actual loading process time did not meet the customer requirements.
Figure 1: Process Baseline
Figure 5. Comparison of actual loading commercial time vs. agreed/target time
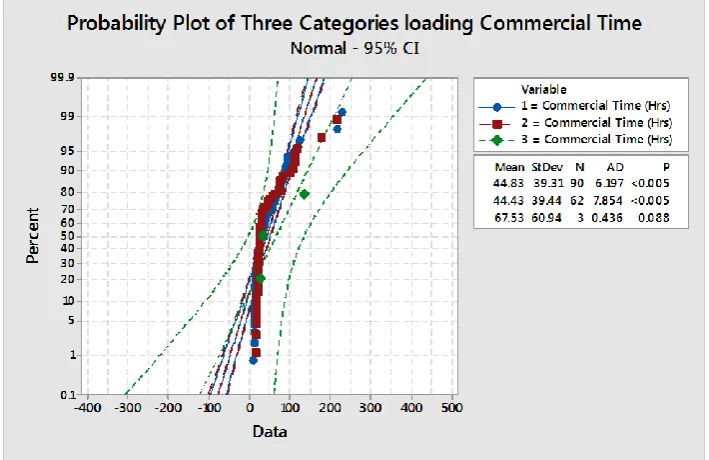
3.3.2 Normality test and process capability analysis. In order to determine the suitability of the loading process to meet the required (i.e. agreed) loading commercial times, a process capability study was conducted for each category of ships capacity. However, a normality test was first performed in order to determine the distribution of the loading commercial time data for the three categories. The test was performed at a 95% confidence interval, or α = 0.05. Based on Anderson-Darling normality test, the data was computed using Minitab 17 to produce a normal probability plot, see Figure 6. The results indicated that the data for ship categories one (i.e. ≤75,000 tonnes) and two (i.e. 75,001 – 149,999 tonnes) were not normally
51 44 68 30 42 54 0 10 20 30 40 50 60 70 80
≤ 75K 75K-150K ≥ 150 K
H
o
u
rs
Ship Catogeries
Ship Loading Commercial Time (hours)
Commercial Time Actual Performance Agreed with Customers (Target)
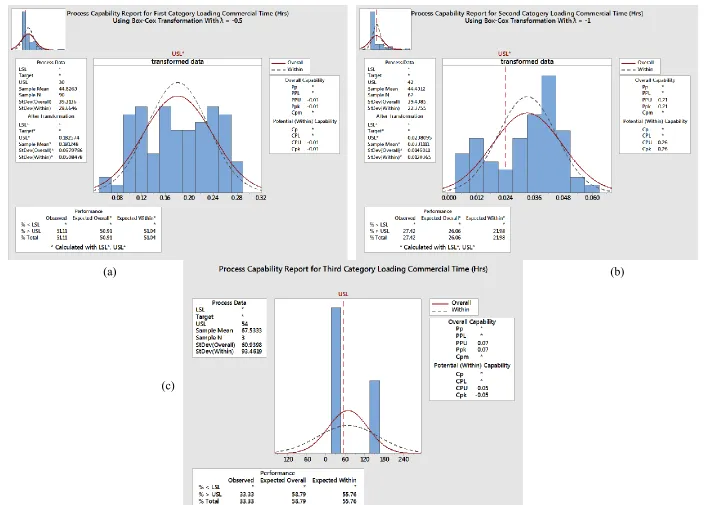
distributed because the p-values were less than 0.05 (Harry et al., 2010). Thus, the null hypotheses (i.e. H0: The data is normally distributed) for these two categories were rejected. However, since the p-value for the third (i.e. ≥ 150,000) category was 0.088, which is greater than 0.05 (Harry et al., 2010), the null hypothesis was accepted, indicating that the loading commercial time data for this category was normally distributed. Since the first and second categories of loading commercial time data did not show to be normally distributed, a transformation into normally distributed data was carried out using Box-Cox transformation (Osborne, 2010).
Figure 6. Normal probability plot for all three ship capacity categories
[image:10.595.124.479.195.425.2]
Figure 7. Process capability analysis for ship loading capacities one (a), two (b) and three (c)
(a) (b)
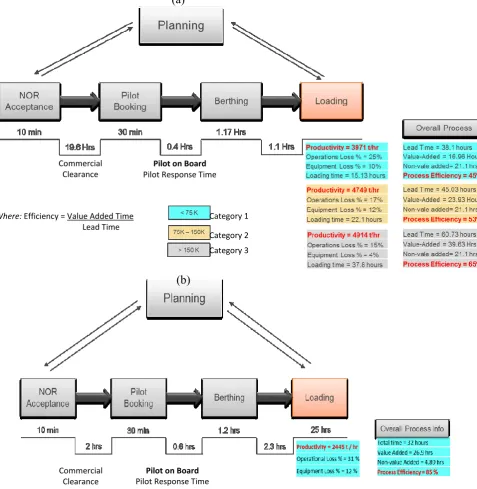
3.3.3 Values Stream Mapping study. Aligned to the lean philosophy, a VSM study is based on the fundamental concept that customers are only willing to pay for those process activities that add value to the product or service that they are acquiring, and not for those that do not (Pyzdek and Keller, 2014; Basu, 2009). In this context, VSM is a powerful tool to identify value-added and non-value added activities in processes (Pyzdek and Keller, 2014). In the case of this project, the steps that comprised the ship loading process were classified as either value added or non-value added. The resulting VSMs for both iron ore pellets and sinter feed are shown in Figure 8.
As shown in Figure 8, the commercial time starts with NOR acceptance and ends when the loading is completed. Thus, four main process steps were considered and mapped. Productivity was calculated for the loading activity and every one of the three categories of ships capacity, whereas process efficiency was calculated for the whole process and every one of the three categories.
Category 1
Category 2 Category 3 Where: Efficiency = Value Added Time
Lead Time
(a)
(b)
Commercial Clearance
Pilot on Board
Pilot Response Time
Commercial Clearance
Pilot on Board
[image:12.595.69.547.272.762.2]Pilot Response Time
3.4 The Analyse phase
The objective of the Analyse phase is for the LSS project team to identify, organise and validate the potential root cause of poor performance and problems (Sin et al., 2015). Jirasukprasert (2014) and Pyzdek and Keller (2014) comment that different tools and techniques that include process mapping, brainstorming, cause-and-effect diagrams, hypothesis testing, among others, are traditionally used in this phase. However, the way in which the LSS project is conducted, and its own nature, will normally dictate the selection of the most effective tools (Pyzdek and Keller, 2014). In the case of this project, cause-and-effect, losses, Pareto and statistical analyses were employed to identify, organise and validate the potential root causes of problems.
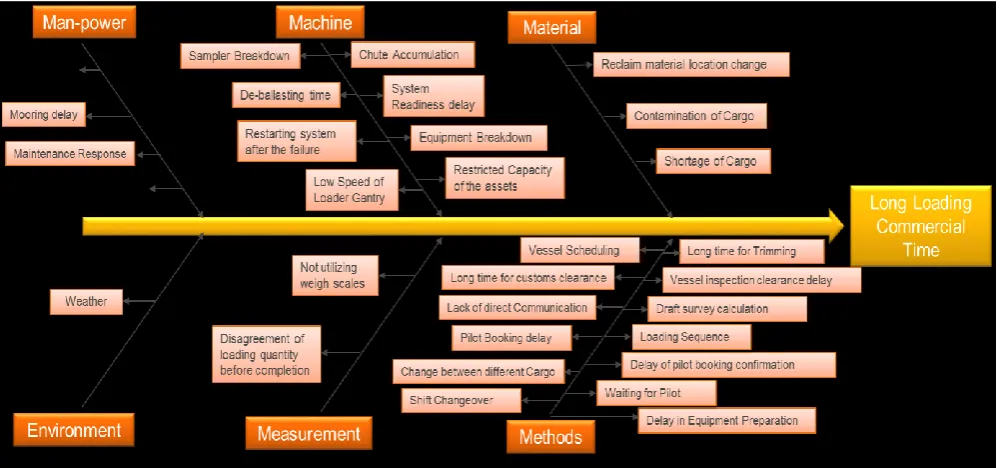
[image:13.595.73.574.381.615.2]3.4.1. Cause-and-effect analysis. This analysis was performed in order for the individual team members of the LSS project to convert their knowledge to explicit ideas, concepts and reasoning (Anand et al., 2010), and in this way uncover the possible causes that influenced and affected the performance of the ship loading commercial time. In particular, the cause-and-effect-analysis allowed the team to organise their ideas into various categories of root causes (Sin et al., 2015). To generate ideas, this analysis was supported with a brainstorming session, which encouraged the intuitive association of the project’s team members to pick up one another’s ideas. These ideas were then associated and developed further (Garza-Reyes et al., 2010; Fortune, 1992). The resulting cause-and-effect analysis and the identified root causes of long ship loading commercial time are shown in Figure 9.
Figure 9. Cause-and-effect analysis for long ship loading commercial time
Figure 10. Loading process % in ship loading commercial time
Booking a Pilot
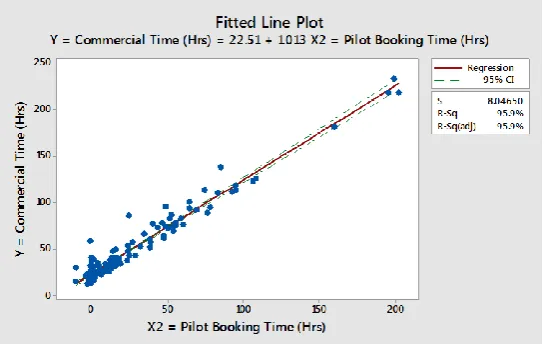
[image:14.595.158.432.434.606.2]One of the activities identified in the VSM analysis, see Section 3.3.3, was booking a pilot after the NOR acceptance by the ship crew. This activity was considered as one of the potential causes of long ship loading commercial time identified through the cause-and-effect analysis, see Section 3.4.1. For this reason, a regression analysis was conducted, using Minitab 17, to determine whether there was a significant correlation between the pilot booking time and ship loading commercial time. The results are presented in Figure 11, showing that the p-value was less than α=0.05, which indicated the rejection of the null hypothesis. This suggested that there was a significant correlation between the pilot booking time and loading commercial time, validating this activity as one of the causes for a long ship loading commercial time.
Figure 11. Regression analysis for pilot booking time vs. ship loading commercial time 0%
20% 40% 60% 80% 100% 120%
1 5 9 13 17 21 25 29 33 37 41 45 49 53 57 61 65 69 73 77 81 85 89 93 97
10
1
10
5
10
9
11
3
11
7
12
1
12
5
12
9 2 6 10 14 18
No. of vessels
Subsequently, the proportion of pilot booking time on loading commercial time was calculated and quantified. A variation was observed in the proportion among the vessels as shown in Figure 12. In general, an average of 28 percent was the proportion of pilot booking time on the overall ship loading commercial time. Hence, it was considered a significant contributor.
Figure 12. Percentage of pilot booking time contribution to the overall ship loading commercial time
Pilot on Board
Pilot response time is defined as the time from the pilot booking to the pilot being on
board. Similarly, a regression analysis was carried out in order to validate whether the pilot response time significantly impacted the ship loading commercial time. The results are shown in Figure 13. They show that the p-value is greater than α=0.05, indicating the acceptance of the null hypothesis. Therefore, the regression analysis suggested that there was no significance correlation between the ship loading commercial time and pilot response time.
0% 20% 40% 60% 80% 100%
1 6 11 16 21 26 31 36 41 46 51 56 61 66 71 76 81 86 91 96
10
1
10
6
11
1
11
6
12
1
12
6
13
1 5 10 15 20
Vessel
Percentage of pilot bookking time in loading commercial time Average
Null hypothesis (Ho): σR2 = 0 (commercial time is not affected by pilot response time) Alternative hypothesis (H1): σR2< 0 (commercial time is affected by pilot response time)
Regression Analysis: Y = Commercial Time (Hrs) versus X3 = Pilot Response Time (Hrs) The regression equation is
Y = Commercial Time (Hrs) = 43.29 + 4.164 X3 = Pilot Response Time (Hrs) S = 39.6130 R-Sq = 0.5% R-Sq(adj) = 0.0%
Analysis of Variance
Source DF SS MS F P Regression 1 1319 1319.29 0.84 0.361 Error 153 240086 1569.19
[image:15.595.100.499.153.335.2]Total 154 241406
[image:15.595.151.428.488.660.2]Loading Process
Loading process starts when berthing is completed and ends when the quantity of the cargo
has been fully loaded. The loading productivity rate is a key indicator of the performance of the loading process of the port as it is able to indicate the level of losses that might be encountered in the operation. Average loading productivity was 3,971 tonnes per hour for ship capacity of ≤75,000 tonnes, whereas the full operational capacity of the studied organisation was 10,000 tonnes per hour. For this reason, various losses and wastes were encountered in the loading process. Equipment and operational losses data collected in the Measure phase were utilised in this analysis. The productivity analysis revealed that around 60 percent of the time spent on loading the ship was identified as non-value added, and that losses included operational (22 percent), equipment (10 percent) and others (28 percent) as shown in Figure 14.
Figure 14. Ship loading capacity distribution
Operational losses
Operational losses corresponded to any losses, or wastes, that occurred with activities during the loading process.In particular, trimming and hatch change activities were the main contributors to operational related losses. Trimming is carried out in order to perform draft survey calculations to determine the quantity loaded. Historical documents and records were revisited for ten vessels, and the average time was found to be around 1.11 hours. This indicated that around 26 percent of operational related losses were due to the trimming activity. Therefore, a further analysis was carried out. The port’s layout was used to map the trimming process movements through a spaghetti diagram as shown in Figure 15. This figure indicates that the operations team moves from loading port to boat landing to ride the boat and sail to the ship. In fact, transportation to boat landing only takes around 30 minutes. In addition, the transportation from boat landing location to ship location takes the majority of the time. In general, transportation has a considerable contribution to the trimming process and it is one of seven lean wastes as defined by Toyota (Liker, 2004).
40%
22% 10%
28%
Loading Capacity Distribution
Loading rate (Value Added)
Operational loss
Equipment loss
Figure 15. Spaghetti diagram of current trimming process
[image:17.595.77.523.71.315.2]Therefore, the proposed location of boat landing is illustrated in Figure 16. The distance from the port to boat landing is reduced substantially. As a result, a significant reduction on the trimming process time could be achieved.
Figure 16. Proposed trimming process
Equipment losses
Equipment failures during the loading operation were another major element causing low loading productivity. The data collected in the Measure phase included total equipment downtime for every loading operation. The average equipment downtime was 2.2 hours as shown in Figure 17. It affected the loading commercial time directly.
Figure 17. Control chart of equipment downtimes
Equipment reliability depends on various factors such as a preventive maintenance programme. Hence, preventive maintenance compliance was checked. Preventive maintenance leads to the prevention and hence reduction of equipment failures or any related issues (Bouslah et al., 2016). In this case, it was found that preventive maintenance compliance for port equipment had an average of 96 percent, which was considered high. Therefore, it was concluded that either the preventive maintenance procedures were not correct or the way in how it was conducted was not effective. In general, the preventive maintenance programme had to be improved.
Other losses
Cargo shortages referred to the unavailability of specific products to be loaded to the ships. It was one of the causes that led to long loading commercial time. A Pareto analysis was conducted in order to identify the critical months where this situation had occurred. This is shown in Figure 18. It is clear that December 2014 was the month in which highest waiting for cargo hours occurred. In addition, it can be noted that three months (i.e. December, August and June) formed 82 percent of waiting for cargo time. This issue occurred due to customers changed their plan and came on different dates scheduled for them where the specific cargo was not ready and available. In addition, another reason was due to the business strategy aimed at reducing the stock of finished products to a minimum by each end of quarter in order to generate more cash flow.
151 136 121 106 91 76 61 46 31 16 1 16 14 12 10 8 6 4 2 0 Observation H ou rs _ X=2.23 UCL=8.33 LB=0 1 1 1
Figure 2: Pareto chart for waiting for cargo
Figure 18. Pareto analysis for waiting for cargo loss
Port Capacity Validation
Port capacity is an important indicator for the business to deliver their commitment and services to customers as per agreements. Therefore, port capacity and its current utilisation were measured, analysed and compared in order to validate whether port capacity was fully utilised and whether it caused any congestion problem. As shown in Figure 19, the port is capable to load over 32 million of tonnes, whereas the current plan is to load 10 million tonnes of cargo. Hence, port capacity is not an impediment for the case organisation to meet its targets.
Figure 19. Port capacity vs. port utilisation 32,022,144
10,000,000
5,000,000 10,000,000 15,000,000 20,000,000 25,000,000 30,000,000 35,000,000
Actual Loading Capacity/year Actual Planned Loading Volume / Year
to
nn
es
3.4.3. Values Stream Mapping analysis. The analysis of VSM was based on identifying the opportunity areas that could improve the performance of the ship loading operation.The first opportunity was identified in waiting for commercial clearance after NOR acceptance. In fact, this opportunity could save around 19 hours on average from the commercial time for loading pellets, or around 30 percent of average loading commercial time. For the loading sinter feed process, the potential time reduction was around 2 hours. Furthermore, the second opportunity identified was in the loading process through improving the loading productivity as illustrated in Figures 20(a) and 20(b)
Figure 20. Analysis of Value Stream Maps for (a) iron ore pellets and (b) sinter feed
3.5 The Improve phase
The Improve phase aims to build the solutions that improve process performance (Pyzdek and Keller; 2014; Basu, 2009; de Mast and Lokkerbol, 2012).
Commercial Clearance
Commercial Clearance
Pilot on Board
Pilot Response Time
Pilot on Board
Pilot Response Time
(a)
3.5.1. Generation and selection of improvement proposals. In the case of this project, solutions were generated through a brainstorming session (Garza-Reyes et al., 2010; Fortune, 1992) similar to the one conducted in the Analyse phase. After that, a selection criterion was developed based on the impact of the proposed solution on ship loading commercial time and process as well as its risk, overall impact on business, and cost, see Table 2. This criterion ensured that only optimum solutions with high benefits and relatively low implementation costs were selected for deployment. The criterion also contributed in making sure that the LSS project and solutions were aligned to the business strategy of the studied organisation. Several generated improvements, see Table 3, were selected based on this criterion.
Table 2. Selection criterion
Criteria Definition Rating
Process Impact
The impact on the process of ship loading
commercial time Low – High: 1 - 10
Risk Impact The impact on Safety, Health, Environment &
Security Low – High: 10 - 1
Business Impact
The impact on the business strategic objectives
(Revenue, Productivity, People, Cost Reduction) Low – High: 1 - 10
[image:21.595.91.504.222.380.2]Cost Impact The cost of the implementation. Low – High: 10 - 1
Table 3. Generated and selected improvements
No Action Expected Benefits
1 Invoice earlier clients to make the payment before arrival.
Waiting for commercial clearance as mentioned in value stream mapping is reduced or eliminated. As a result, a significant reduction on loading commercial time is achieved.
2
Update the standard operating procedure to avoid scheduling a bunch of vessels at the same time.
Number of vessels waiting for a vacant berth is reduced. As a result, long loading commercial time due to waiting for a vacant berth is eliminated.
3
Update the standard operating procedure to plan to reclaim from only one pile in the yard.
Movements waste in the yard is reduced and eliminated. As a result, loading productivity is enhanced.
4
Update the standard operating procedure to avoid scheduling vessels when no stock available.
Waiting for cargo cases are reduced. As a result, loading commercial time is reduced.
5 Negotiate with vessels to reduce number of hatch changes.
Hatch change time during loading operation is reduced. As a result,
Loading productivity is increased.
6
Update the standard operating procedure to plan to berth of two ships simultaneously in case of bunching of vessels.
Changeover time between two vessels is reduced significantly. As a result, loading commercial time is reduced through quick start of loading.
7
Update the standard operating procedure to avoid pellets stacking in the location of 1000 – 1200.
8
Update the standard operating procedure to avoid berthing in #24 in case no bunching vessels.
Low ship loader gantry speed is reduced and eliminated. As a result, loading productivity is enhanced.
9
Berth the cargo and freight rate (CFR) vessel operated by Vale immediately on arrival and sort out any commercial issues concurrently.
Waiting for commercial clearance is reduced and eliminated. As a result, significant reduction of loading commercial time is achieved.
10 Relocate boat landing to the proposed location. Trimming process time is reduced. As a result, loading commercial time is reduced.
3.5.2. Loading process performance improvement. The commercial clearance, see VSM analysis – Figure 20, issue was tackled through implementing actions one and nine presented in Table 3. In addition, some updates on existing standard operating procedures were also carried out to reduce various wastes. Moreover, a new boat landing location was proposed in order to reduce the trimming process time. This solution might require some investment to set up the infrastructure, but it was still considered for a future feasibility study.
[image:22.595.79.522.73.190.2]Loading commercial time data were, once more, collected after the improvements actions had been deployed for three months. The reason was to evaluate and quantify the improvements on the process output. A process capability analysis was carried out in order to evaluate the effect of the improvements made on the process capability index for every one of the three categories of ship loading capacity (i.e. ≤75,000 tonnes; 5,001 – 149,999 tonnes; ≥ 150,000). However, a normality test was first performed in order to determine whether the data was normally distributed. The normality test for all three categories is presented in Figure 21. The results showed that categories one and two had a p-value of less than α=0.05. Hence, the data did not present a normal distribution. On the other hand, the third category followed a normal distribution as the p-value was greater than α=0.05. Therefore, a Box-Cox transformation (Osborne, 2010) was applied to the data of the first and second categories in order to generate a process capability analysis based on a normal distribution.
Figure 21. Normal probability test for categories 1 (a), 2 (b) and 3(c) of ship loading capacity
Table 4. Summary of process capability results “before” and “after” improvements
Category Status Cpk % > USL
< 75 K Before improvement -0.009 51.11 After improvement 0.167 33.33
>75K & <150K Before Improvement 0.258 27.42
After Improvement 0.51 26.67
>150K Before Improvement -0.048 33.33
After Improvement 2.248 0.00
(a) (b)
Table 5. Summary of loading commercial time performance “before” and “after” improvements
Category <75K >75K & <150K >150K
Before improvement
(Average) 51 44 68
After improvement
(Average) 31 30 36
(a) (b)
[image:25.842.84.775.42.552.2](c)
3.6 The Control phase
The Control phase aims to sustain the improvements achieved through various tools and techniques (Jirasukprasert et al., 2014; Basu, 2009). It is an important stage in the LSS lifecycle as it ensures the sustainability of the results (Pyzdek and Keller, 2014; Basu, 2009). In the case of this project, control measures to sustain the improvements were established through the standardisation and institutionalisation of processes and documentation, training, creation of a response plan and application of control charts.
Table 6. Response plan Commercial Time Sinter feed Loading Productivity Pellets Loading Productivity Pilot Response Commercial Clearance Parameter
Total time from NOR Acceptance
to loading completion without
vessel delays and force majure time
related. IOCS Loading Gross Rate RM80 Loading Gross Rate Time from Booking pilot to
Pilot on board. Time between NOR Acceptance
to Book Pilot
Description
As per the agreement.
> 3000 ton/hour
> 4000 ton/hour < 30 min < 30 min
Target Manual Manual Manual Manual Manual Measuremen t Method Every Vessel Every Vessel Every Vessel Every Vessel Every Vessel Freq. Investigate and provide the corrective actions. Investigate and provide the corrective actions. Investigate and provide the corrective actions. Investigate and correct with SIPC Investigate and correct with Commercial Team Reaction Plan Planning Port Operation Port Operation Planning Planning Process Owner Planning Specialist Head of Shift Head of Shift Planning Specialist Planning Specialist Responsible Head of Planning Chief of Port
Operations Chief of Port
Operations Head of Planning Head of Planning Accountable Chief of Technical Unit
Chief of Port Operations Chief of Port
Operations Chief of Technical Unit Chief of Technical Unit Consulted Chief of Technical Unit Chief of Port
Operations Chief of Commercial
- - Chief of Port
Operations Chief of Port
Operations Chief of Commercial
Finally, control charts are a powerful tool for achieving process control and stability (Pyzdek and Keller, 2014; Basu, 2009). In the case of this project, the implementation of control charts was important for employees to monitor the ship loading process and differentiate common causes from special causes of variation in the process (Basu, 2009). Figures 23 shows the control charts for the loading commercial times for iron ore pellets and sinter feed respectively. As shown, the process of loading, in general, is in control and stable. However, the average of commercial loading rate was increased due to the improvements made.
Figure 23. Control chart of loading commercial rate for (a) iron ore pellets and (b) sinter feed
4. Discussion and Managerial Implications
Although improvements in operations can be conducted in an ad hoc basis, a systematic project with well-defined and logically sequenced implementation stages, such as those facilitated by the proposed framework, will provide a more effective and efficient approach to operations improvement. Furthermore, empirical evidence (e.g. Zhang et al., 2015; Vinodh et
(a)
al., 2014; Krueger et al., 2014; Ghosh and Maiti, 2014; Vinodh et al., 2011; Chen and Lyu, 2009; Kumar et al., 2006) suggests that if the systematic approach of DMAIC is also further adapted to drive the improvement of specific projects and address specific problems, its effectiveness is enhanced. In this study, resistance to change was found in terms of that the studied organisation found it difficult to follow a systematic way for solving operational challenges, instead of simply “jumping” into a solution dictated by their common sense and experience. However, preparatory work previous to the project was carried out in order to convince management that a systematic problem solving approach takes away users from “intuition-based decisions” to “fact-based decisions” (Antony et al., 2015). Thus, the proposed framework not only helped the case organisation to reduce its ship loading commercial time but also established a standardised routine to improve its operations. It is now up to the top management to make sure that this approach to operational improvement is sustained and embedded within the company’s problem solving culture. This study has provided the organisation, and its managers, with a platform to achieve this.
Kumar et al. (2006) comment that in order to provide valuable learning lessons, it is important to highlight and discuss the difficulties encountered when conducting improvement projects. Kumar et al. (2006) suggest that this will contribute in facilitating their deployment in the future. In the case of the implementation of the proposed LSS framework, convincing top management of taking a broader view of the loading operation by also considering the berthing process and role of other business units rather than simply focusing on the loading process itself was an arduous task. This may be considered a natural phenomenon as previously indicated, the application of Lean and/or Six Sigma principles and tools by iron ore producers is limited (Indrawati and Ridwansyah, 2015; Hokoma et al., 2010; Shinka Management, 2012; Chinbat and Takakuwa, 2008). Additionally, the limited use of Lean and/or Six Sigma in the iron ore industry may also suggest that there is no clear understanding on how the benefits of the combination of these approaches, in the form of LSS, can support the improvement of operations in this sector. To overcome these challenges, management teams were convinced by citing examples of some successful organisations, in other industries, that had improved the efficiency of their processes and enhanced their bottom-line results using the application of LSS.
LSS and keep employees enthusiastic and committed to LSS and future improvement projects.
5. Conclusions, Limitations and Future Research Directions
The LSS framework proposed in this study has contributed in helping a large iron ore producer to enhance its port operations by improving a key performance parameter, namely: ship loading commercial time. The framework not only supported the systematic conduction of a LSS project, with well-defined and logically sequenced implementation stages, but also provided an impetus for establishing best practices in the company’s port operations.
In terms of tangible project results, the objective of this study was to reduce the ship loading commercial time by 30 percent. Nevertheless, the results showed an improvement of more than 30 percent in both process capability index and loading commercial time. This has led the case organisation to achieve substantial cost savings estimated by its financial department, in the range of $300,000 USD per annum in terms of demurrage fees compared to 2014. Furthermore, customers were satisfied with the loading service provided by the studied organisation. As described in Section 3.6, the actions taken in the Control phase of DMAIC will ensure that these benefits are maintained by driving the organisation to sustain the best new practices adopted in its port operations (Jirasukprasert et al., 2014; Pyzdek and Keller, 2014; Basu, 2009). However, top management is aware of the fact that in order to develop and sustain a LSS culture in the long term, besides training and celebrating success (see Section 4), the development of some soft organisational practices will be required (Bortolotti et al., 2015). For this reason, the case organisation has been suggested to develop practices that include: long term thinking, discussion of strategic level thinking in LSS programmes as well as motivating and empowering its employees (Bortolotti et al., 2015; Achanga et al., 2006; Liker 2004; Hines et al., 2004). The development of these practices will not only contribute to the long term sustainment of LSS within the studied organisation but also to the embedment of the LSS philosophy and principles in its organisational culture. The proposed LSS framework has been test implemented in a single business unit of an iron ore producer, and focused on addressing one specific problem (i.e. long ship loading commercial time). In the future, this framework can be used as a base and adapted to drive improvements in other units of the studied organisation and/or to tackle other operational problems. The success reported in this paper and achieved by the port in its loading operations will provide a solid base and facilitate the acceptance of the implementation of LSS, and the framework proposed, in other business units. In this way, the proposed LSS implementation framework will be validated across several industrial scenarios. In addition, more tools and techniques can be added, or removed, from the framework for specific adaptation and enhancement.
References
Achanga, P., Shehab, E., Roy, R., Nelder, G., (2006, “Critical success factors for lean implementation within SMEs”, Journal of Manufacturing Technology Management, Vol. 17, No. 4, pp. 460–471.
Antony, J., Kumar, M., Tiwari, M. (2005), “An application of Six Sigma methodology to reduce the engine over-heating problem in an automotive company”, Proceeding of the Institute of Mechanical Engineers, Part B: Journal of Engineering Manufacture, Vol. 219, No. 8, pp. 633-646.
Antony, J., Antony, F.E., Kumar, M., Cho, B.R. (2007), “Six sigma in service organisations: Benefits, challenges and difficulties, common myths, empirical observations and success factors”, International Journal of Quality & Reliability Management, Vol. 24, No. 3, pp. 294-311.
Baker, T., Jayaraman, V. (2012), “Managing information and supplies inventory operations in a manufacturing environment. Part 1: An action research study”, International Journal of Production Research, Vol. 50, No. 6, pp. 1666-1681.
Basu, R. (2009), Implementing Six Sigma and Lean, Butterworth-Heinemann, Oxford.
Bicheno, J. (2004), The New Lean Toolbox: Towards Fast, Flexible Flow, 3rd ed., PICSIE Books, Buckingham.
Bortolotti, T., Boscari, S., Danese, P. (2015), “Successful lean implementation: Organizational culture and soft lean practices”, International Journal of Prudction Economics, Vol. 160, pp. 182-201.
Bouslah, B., Gharbi, A., Pellerin, R. (2016), “Joint economic design of production, continuous sampling inspection and preventive maintenance of a deteriorating production system”, International Journal of Production Economics, Vol. 173, pp. 184-198.
Brue, G. (2002), Six Sigma for Managers, McGraw-Hill, NY.
Bryman, A. (1989), Research Methods and Organization Studies, Unwin Hyman, London. Cagliano, R., Caniato, F., Corso, M., Spina, G. (2005), “Collaborative improvement in the
extended manufacturing enterprise: lessons from an action research process”, Production, Planning & Control, Vol. 16, No. 4, pp. 345-355.
Chakrabarty, A., Tan, K.C. (2007), “The current state of Six Sigma application in services”, Managing Service Quality, Vol. 17, No. 2, pp. 194-208.
Chen, M.N., Lyu, J.J. (2009), “A Lean Six-Sigma approach to touch panel quality improvement”, Production, Planning & Control, Vol. 20, No. 5, pp. 445-454.
Chinbat, U., Takakuwa, S. (2008), “Using Operation Process Simulation for a Six Sigma project of Mining and Iron Production Factory”, Proceedings of the Winter Simulation Conference (WSC), Austin, TX, 7-10 December, pp.2431-2438.
Coughlan, P., Coghlan, D. (2002), “Action research for operations management”, International Journal of Operations and Production Management, Vol. 22, No. 2, pp. 220–240.
Cudney, E. A., Furterer, S., Dietrich, D. (Eds.), (2013), Lean Systems: Applications and Case Studies in Manufacturing, Service, and Healthcare, CRC Press.
de Mast, J. (2004), “A methodological comparison of three strategies for quality improvement”, International Journal of Quality & Reliability Management, Vol. 21, No. 2, pp. 198-213.
de Treville, S., Antonakis, J., Edelson, N.M. (2005), “Can Standard Operating Procedures be Motivating? Reconciling Process Variability Issues and Behavioural Outcomes”, TQM & Business Excellence, Vol. 16, No. 2, pp. 231-241.
Deshmukh, S.V., Lakhe, R.R. (2009), “An innovation model of Six Sigma for SMEs: the T-DMAIC model”, International Journal of Six Sigma and Competitive Advantage, Vol. 5, No. 2, pp. 187-203.
Dey, P.K., Bhattacharya, A., Ho, W. (2015), “Strategic supplier performance evaluation: A case-based action research of a UK manufacturing organisation”, International of Production Economics, Vol. 166, pp. 192-214.
Farooq, S., O'Brien, C. (2015), “An action research methodology for manufacturing technology selection: a supply chain perspective”, Production, Planning & Control, Vol. 26, No. 6, pp. 467-488.
Fortune, J., (1992), “Idea generation techniques for quality improvement”, International Journal of Quality and Reliability Management, Vol. 9, No. 6, pp. 32-38, 1992.
Furterer, S.L. (2009), Lean Six Sigma in service: applications and case studies, CRC Press. Garza-Reyes, J.A., Oraifige, I., Soriano-Meier, H., Harmanto, D., Rocha-Lona, L. (2010),
“An empirical application of Six Sigma and DMAIC methodology for business process improvement”, Proceedings of the 20th International Conference on Flexible Automation and Intelligent Manufacturing (FAIM), San Francisco, CA, US, 12-14 July.
Garza-Reyes J.A., Flint, A., Kumar, V., Antony, J., Soriano-Meier, H. (2014), “A DMAIRC approach to lead time reduction in an aerospace engine assembly process”, Journal of Manufacturing Technology Management, Vol. 25, No. 1, pp. 27-48.
Gonçalves, F., Bezerra, C., Belchior, A., Coelho, C. and Pires, C. (2008), “Implementing causal analysis and resolution in software development projects: the MiniDMAIC approach”, Proceedings of the 19th Australian Conference on Software Engineering, pp. 112-119.
Ghosh, S., Maiti, J. (2014), “Data mining driven DMAIC framework for improving foundry quality – a case study”, Production, Planning & Control, Vol. 26, No. 6, pp. 478-493. Gowen III, C.R., Stock, N.G., Mcfadden, K.L. (2008), “Simultaneous implementation of Six
Sigma and knowledge management in hospitals”, International Journal of Production Research, Vol. 46, No. 23, pp. 6781-6795.
Gutierrez, D.M., Scavarda, L.F., Fiorencio, L., Martins, R.A. (2015), “Evolution of the performance measurement system in the Logistics Department of a broadcasting company: An action research”, International Journal of Production Economics, Vol. 160, pp. 1-12.
Harry, M.J., Mann, P.S., de Hodgins, O.C., Hulbert, R.L. and Lacke, J.C. (2010), Practitioners Guide to Statistics and Lean Six Sigma for Process Improvement, Wiley, Hoboken, NJ.
Hicks, C., McGovern, T., Prior, G., Smith, I. (2015), “Applying lean principles to the design of healthcare facilities”, International Journal of Production Economics, Vol. 170, Part B, pp. 677–686.
Hokoma, R.A., Khan, M.K., Hussain, K. (2010), “The present status of quality and manufacturing management techniques and philosophies within the Libyan iron and steel industry”, The TQM Journal, Vol. 22, No. 2, pp. 209-221.
Implementation Engineers (2016), “Operational Excellence in Iron Ore Mining”, Available at: http://implementation.com/our-expertise/case-studies/d/operational-excellence-in-iron-ore-mining (Accessed on 03 April 2016).
IndexMundi (2015), “Iron Ore Monthly Price - US Dollars per Dry Metric Ton”, Available at: http://www.indexmundi.com/commodities/?commodity=iron-ore&months=12, (Accessed 15 April 2015).
Indrawati, S., Ridwansyah, M. (2015), “Manufacturing Continuous Improvement Using Lean Six Sigma: An Iron Ores Industry Case Application”, Procedia Manufacturing, Vol. 4, pp.528–534.
Jacobsen, J. (2016), “Cutting Iron Ore Pellet Production Costs Via Improved Efficiency Saves Mining Company $8M”, American Society for Quality (ASQ), Available at: http://asq.org/knowledge-center/case-studies-production-cost-efficiency-mining.html (Accessed 03 April 2016).
Jarrar, Y., Neely, A. (2005), Six Sigma – Friend or Foe?, Available at: http://sixsigma.pbworks.com/f/Six%20Sigma-friend%20or%20foe.pdf (Accessed 11 January 2016).
Jirasukprasert, P., Garza-Reyes, J.A., Kumar, V., Lim, M.K. (2014), “A Six Sigma and DMAIC application for the reduction of defects in a rubber gloves manufacturing process”, International Journal of Lean Six Sigma, Vol. 5, No. 1, pp. 2-21.
Krueger, D.C., Parast, M.M., Adam, S. (2014), “Six Sigma implementation: a qualitative case study using grounded theory”, Production, Planning & Control, Vol. 25, No. 10, pp. 873-889.
Kumar, M., Antony, J., Singh, R.K., Tiwari, M.K. and Perry, D. (2006), “Implementing the Lean Sigma framework in an Indian SME: a case study”, Production, Planning & Control, Vol. 17, No. 4, pp. 407-423.
Kumar, S., Wolfe, A.D. and Wolfe, K.A. (2008), “Using Six Sigma DMAIC to improve credit initiation process in a financial services operation”, International Journal of Productivity and Performance Management, Vol. 57, No. 8, pp. 659-676.
Liker, J. (2004), The Toyota Way: 14 Management Principles form the World's Greatest Manufacturer, CWL Publishing Enterprises, New York, NY.
McCutcheon, D., Meredith, J. (1993), “Conducting case study research in operations management”, Journal of Operations Management, Vol. 11, No. 3, pp. 239-56.
Monden, Y. (1998), Toyota Production System: an integrated approach to just-in-time, 2nd ed., Chapman & Hall, London.
Osborne, J.W. (2010), “Improving your data transformations: Applying the Box-Cox transformation”, Practical Assessment, Research & Evaluation, Vol. 15, No. 12, pp. 1-9.
Paloma Consulting (2016), “Case study 7 – Developing Lean Sigma skills in KSE’s iron & steel industry”, Available at: http://www.palomaconsulting.com/case- studies/manufacturing-and-engineering/case-study-7-developing-lean-sigma-skills-in-kses-iron-steel-industry/ (Accessed on 03 April 2016).
Rocha-Lona, L., Garza-Reyes J.A., Kumar, V. (2013), Building quality management systems: selecting the right methods and tools, Productivity Press, CRC Press, Taylor & Francis, Boca Raton, FL.
Senapati, N.R. (2004), “Quality and reliability corner: Six Sigma: myths and realities”, International Journal of Quality & Reliability Management, Vol. 21, Nos. 6/7, pp. 683-690.
Shadish, W.R., Cook, T.D., Campbell, D.T. (2002), Experimental and Quasi- experimental Designs for Generalized Causal Inference, HoughtonMifflin, Boston, MA.
Shinka Management (2012), “Rio Tinto on Lean Manufacturing in the Mining Sector”, Available at: http://shinkamanagement.com/rio-tinto-lean-management-mining/ (Accessed on 17 January 2016).
Sin, A.B., Zailani, S., Iranmanesh, M., Ramayah, T. (2015), “Structural equation modelling on knowledge creation in Six Sigma DMAIC project and its impact on organizational performance”, International Journal of Production Economics, Vol. 168, pp. 105-117.
Sternberg, H., Stefansson, G., Westernberg, E., Boije af Gennas, R., Allenstrom, E., Nauska, M.L. (2013), “Applying a lean approach to identify waste in motor carrier operations”, International Journal of Productivity and Performance Management, Vol. 62, No. 1, pp. 47-65.
Sunder, V., Antony, J. (2015), “Six-sigma for improving Top-Box Customer Satisfaction score for a banking call centre”, Production, Planning & Control, Vol. 26, No. 16, pp. 1291-1305.
Villarreal, B., Garza-Reyes, J.A., Kumar, V. (2016a), “A lean thinking and simulation-based approach for the improvement of routing operations”, Industrial Management & Data Systems, Vol. 116, No.5, (in press).
Villarreal, B., Garza-Reyes, J.A., Kumar, V. (2016b), “Lean road transportation – a systematic method for the improvement of road transport operations”, Production, Planning & Control, DOI: http://dx.doi.org/10.1080/09537287.2016.1152405 (in press).
Vinodh, S., Gautham, S.G., Ramiya, A., (2011), “Implementing lean sigma framework in an Indian automotive valves manufacturing organisation: a case study”, Vol. 22, No. 7, pp. 708-722.
Vinodh, S., Kumar, S.V., Vimal, K.E.K. (2014), “Implementing lean sigma in an Indian rotary switches manufacturing organisation”, Production, Planning & Control, Vol. 25, No. 4, pp. 288-302.
Voss, C., Tsikriktsis, N. and Frohlich, M. (2002), “Case research in operations management”, International Journal of Operations and Production Management, Vol. 22, No. 2, pp. 195-219.
Ward, S.W., Poling, S.R., Clipp, P. (2008), “Selecting successful Six Sigma projects”, Quality, Vol. 47, No. 10, pp. 50-51.