Munich Personal RePEc Archive
The Gap between Educational Social
Intergenerational Mobility in Arab
Countries
Driouchi, Ahmed and Gamar, Alae
IEAPS, Al Akhawayn University, Ifrane, Morocco
24 September 2016
The Gap between Educational & Social Intergenerational Mobility in Arab Countries
By:
Ahmed Driouchi and Alae Gamar, IEAPS, Al Akhawayn University, Ifrane, Morocco I certify this document for deposit with MPRA
Abstract:
With a high rate of unemployment in most Arab countries, this paper investigates the
relationship between social and educational mobility. World Bank databases on income and
unemployment rates are used for the assessment of both types of mobility. The attained results
show that Arab countries are facing large discrepancies between education trends and income
mobility. Eastern and Central European countries, with similar economic trends, show also
similar patterns of mobility. While the literature review reports the pervasive nature of such
phenomenon, Arab countries need adequate policies to overcome the likely negative impacts
from the low economic and high education mobility.
Keywords: Intergenerational income; intergenerational educational attainment; Arab countries;
Eastern European economies
JEL: J62; I25.
Introduction
Social or economic mobility refers to progress made by economic agents in climbing
the social ladder while educational mobility refers to the changes taking place in education
attainment. Both types of mobility attempt to refer to the status of a new generation relative to
the older one. Both types of mobility are consequently pertaining to the medium and longer
terms of an economy and society.
In the past history and for different economies, education attainment appears to be
positively driving social mobility such that higher school attainment used to lead to higher
social status and thus ensures social mobility, mainly for the less economically endowed
groups. This is mainly true in most countries under past guaranteed employment schemes and
of the literature on education and income distribution in developing countries. The effects of
education on income are underlined to include better welfare through the distribution of
income as education leads to higher income, employment, and better working conditions.
With the liberalization and openness of these economies, jobs are mainly under free
market mechanisms with no obvious links between education and guaranteed employment.
This on-going era, has been showing that the former social ladder, is no more functional and
more education does not necessarily guarantee a higher job and remuneration. This might
mean lower mobility in some economies. But, on the other hand education is becoming more
accessible and open to more and more people than before, with a continuous increase in
school attainment.
Arab and Eastern Central European economies (ECE) have been concerned with the
major shifts taking place in both the global and education economies. Evidence from the Arab
countries suggests that contrary to other developing regions, education and labor market
policies have generally been associated with high demand for higher levels of education. Arab
countries overall started out with low levels of education. This has led to an increase in
educational attainment. Instead of observing an increase in economic mobility across
generations, the Middle East and North African countries appear with low and sometimes
declining social mobility among the increasingly educated segments. Other new facts are
reported by other authors for other economies showing that the discrepancies between social
and educational mobility are pervasive and concern all economies with high access to learning
and mainly in tertiary education.
The current paper attempts to look at the links between social and education mobility in
the context of Arab countries with comparisons with the ECE countries as they are similarities
in the shifts in both markets and education in these two sets of countries. After introducing a
methods used and the data mobilized in assessments are introduced. Results are then
underlined and discussed.
I.
Literature Review
Studies by the World Bank (2010) and the ILO (2012, 2013a and 2013b) stress the need
for Arab countries to have more jobs by 2025, only to maintain the current unemployment
levels and prevent them from increasing. Dhillon and Yousef (2009) show that the duration of
unemployment for new graduates is long in Arab countries: 3 years in Morocco and 2.5 years
in Egypt. Chamlou, Moghadam, and Karshenas (2016) emphasize that Middle East and North
Africa (MENA) countries have made good progress in educating women, with schooling
attainments getting closer to those of men. But most of MENA women remain out of the labor
force. Having so few women working is costly for the countries in the region, limiting their
economic size and growth prospects. The International Labor Organization has been
conducting the school to work transition surveys in more than 30 countries between 2012 and
2015. The Arab countries included up to now are Egypt (2012, 2014) with respectively 5198
and 5758 observations, Jordan (2013) with 5405 surveys, the Occupied Palestinian Territories
(2013) with 4320 observations besides an older survey for Syria (2007). There are also
surveys for ECE countries where the more recent is of 2015. The key results of these surveys
as they appear respectively in different publications of ILO are shown as ONEQ (2014) for
Tunisia, Sadeq and Elder (2014) for Palestine, Mryyan and Barcuccu (2014) for Jordan,
Alissa (2014) for Syria, El Zanaty and Associates (2007) and Barsoum, Ramadan and
Mostafa (2014) for Egypt. Elder, Barcucci, Gurbuzer, Perardel and Principi (2015) analyze
the estimates for Central and Eastern Europe (Albania, Bosnia and Herzegovina, Bulgaria,
Georgia, Hungary, Kosovo, FYR Macedonia, Montenegro, Romania and Serbia); Kyrgyzstan,
Republic of Moldova, Tajikistan, Turkmenistan, Ukraine and Uzbekistan); and high-income
Slovenia and Slovak Republic), among others. The discrepancies between education
outcomes and labor markets appear to be the main reasons for the existing gap between social
and education mobility in Arab countries.
The above issues have been also tackled from the perspective of intergenerational mobility.
Salehi-Isfahan, Belhaj-Hassine and Ragui (2014) analyze equality of opportunity in
educational achievement in some Arab countries. As discussed in Binzel (2011) and in Binzel
and Carvalho (2015), the available empirical studies of intergenerational mobility suggest that
the transmission of economic status across generations is higher in less developed countries
than in developed ones as the expansion of education allows for more social mobility in
developing economies. But, Carvalho (2015 & 2016) when focusing on Egypt|, document a
contemporaneous decline in social mobility among educated youth and develop a model to
show the impacts of an unexpected drop in social mobility combined with inequality.
When surveying the most recent papers on intergenerational social and education
mobility, series of results can be outlined. Economic inequality in urban China as high
intergenerational persistence of education is expected to be a barrier to equal opportunities in
children’s education attainments and their future labor market outcomes (Magnani and Zhu,
2015 & Mok and Wu, 2015). For Vietnam (Dang, 2015) estimates explicitly reveal that this
country has intermediate degrees of income mobility across generations. Black, Devreux,
Lundborg, Majlesi (2015), and Gibbons (2011) emphasize that wealth transmission is not
because children from wealthier families are more talented but that, even in relatively
egalitarian Sweden, wealth generates wealth implying that the position of adoptive parents
matters in intergenerational mobility. While Machin (2004) paints a depressing picture for
those who believe education can promote increased intergenerational mobility, Lefgren,
McIntyre and Sims (2015) consider that applied researchers have been drawn to models that
to government interventions in education. This is the case for Cyprus, Senegal and Scotland
and some Asian countries that increased spending in both private and public higher education
(Andreou and Koutsampelas, 2015, Ianelli and Paterson, 2005, Mok and Neubauer, 2015, and
Dumas and Lambert, 2011). Altzinger, Cuaresma, Rumplmaier, Sauer and Schneebaum
(2015) emphasize that the persistence of socioeconomic outcomes across generations is as a
barrier to a society’s ability to use its resources efficiently. Torche (2015) reviews the
sociological and economic literature on intergenerational mobility and Goldthorpe (2015)
suggests that sociological frameworks about mobility with its mediation through education, be
further enriched with economic approaches and empirical testing with theories originating in
the economics of labor markets. Van Heka, Kraaykampa and Wolbers (2015) address the
dynamic effects of parental socio-economic features on the educational attainment in the
Netherlands. With regard to this, Turcotte (2011) observes that in the last 25 years there has
been an increase in the number of young adults completing university in comparison with past
generations.
New evidence on trends in intergenerational mobility in the U.S. using administrative
earnings records is introduced in the research of Chetty, Hendren, Kline, Saez and Turner
(2014). The results are confirmed in Chetty, Hendren, Kline and Saez (2015). They find that
the most robust way to measure intergenerational mobility is by ranking parents by parental
income and by ranking children by their income when they are adults. For each percentile of
parent’s income, they compute the average rank of the income of the children when adults.
The occupational careers of men if the intergenerational status is disrupted by the
failure to proceed with the parental level of educational attainment in Germany, is discussed
by Diewald, Schulz and Baier (2015). Solon (2015) addresses the framework of
“Multigenerational mobility” to refer to the associations in socioeconomic status across three
the basis of data from three successive birth cohort studies. The authors advance on previous
research in measuring individuals’ educational attainment not only in absolute but also in
relative terms and show that measuring education in these two different ways leads to
significantly differing results. Mazumder (2005a; 2005b) considers that previous studies,
relying on short-term fathers' earnings, have estimated the intergenerational elasticity to be
approximately 0.4. Using administrative data on parents and children, it is estimated to be
around 0.6. The paper of Pastore and Roccisano (2015) provides new evidence on the
inheritance of educational inequality in Azerbaijan, China, Egypt, Iran, Kosovo, Mongolia,
Nepal and Syria where the ILO carried out the first “School-to-Work Transition survey”. The
results show different patterns of correlations between the level of intergenerational mobility,
the educational upgrade and the role of parents’ in sons’ and daughters’ education. The paper
seeks to update knowledge through new estimates of mobility in earnings. Given data
limitations on more recent cohorts, an indirect approach to assessing more recent mobility
trends is adopted. Bukodi, Goldthorpe, Waller and Kuha, (2015) remind the readers about the
importance of social mobility as it is now a matter of political concern in Britain. The results
confirm that there has been no decline in mobility. Torche, F. (2014) introduces equality of
opportunity as prompted by new data to show the development of studies of intergenerational
mobility in Latin America over the past decade. Goldthorpe (2012) notes the consensus
developed in political and also media circles that social mobility in Britain has been in
decline. On the consensus view, as construed in political circles, educational policy is seen as
the crucial instrument for increasing mobility; but on the alternative view, what can be
achieved in this way, whether in regard to absolute or relative mobility, appears far more
limited. Greenstone, Looney, Patashnik, and Yu. (2013) discuss The Hamilton Project policy memo as it provides thirteen economic facts on the growth of income inequality and its
and outcomes for high- and low-income students; and on the pivotal role education can play in increasing the ability of low-income Americans to move up the income ladder. Ichino,
Karabarbounis and Moretti, (2010) address the Political Economy of Intergenerational Income
Mobility and consider that intergenerational elasticity of income is the best measure. The authors
conclude that international comparisons of intergenerational elasticity of income are not particularly
informative without accounting for differences in politico-economic institutions.Güell, Pellizzari,
Pica, and Rodriguez (2015) apply a new measurement model of intergenerational mobility to
a combination of Italian data allowing producing comparable measures of intergenerational
mobility of income for 103 Italian provinces. They find that higher income mobility is
positively associated with a variety of “good” economic outcomes, such as higher value added
per capita, higher employment, higher schooling and higher openness. They also find that
within Italy, “the Great Gatsby Curve” exists and could be used to guide new policies. But
Jerrim and Macmillan (2015) consider that relatively limited cross-national work has
empirically been including education. While the number of studies of intergenerational
income mobility has been growing (Corak, 2004, 2006; 2013a; 2013b and 2016), the literature
on this topic for the developing countries is still limited (Binzel, 2011). But, the
intergenerational measure is also useful for the understanding of the generational transmission
between parents and children in education. Accounting for inequality adds more insights to
intergenerational research as new policies could be provided. There are several studies that
look at the links to inequality measures. The limits of intergenerational mobility are discussed
in series of papers. Andrews and Leigh (2009), Breen (1997), Blanden and Machin (2004),
Corak (2006) and d'Addio (2007) suggest new methodological features for studies of
intergenerational mobility.
1. Methods
Intergenerational income mobility measured by a linear regression model in which the
logarithm of the child’s income Ychild (in adulthood) is a function the logarithm of the
parent’s income: Yparent:
ln(Ychild) = α + β ln(Yparent) + ε.
The regression coefficient ß is the so-called income elasticity and ε is the error term
indicating other influences not associated with parental income. The elasticity (ß ) represents
the fraction of income that is transmitted. Empirical estimates of ß tend to lie between 0 and 1.
The intergenerational elasticity of income is generally considered one of the best summary
measures of the degree to which a society gives equal opportunities of success to all its
members, irrespective of their family background.
2. Data
The data from earlier research (Driouchi, Boboc, Titan and Achehboune, 2016) and mainly
the elasticity of intergenerational mobility in school attainment are used to study the
relationship between income mobility and and the intergenerational mobility in education
attainment.
In order to determine the intergenerational mobility in income, generations twenty years away
from each other are considered. The data are then transformed to logarithms. Linear
regressions are used to estimate elasticities related to income. To estimate income mobility,
World Bank data are mobilized to include per capita Gross Domestic Product (GDP), Gross
Nationl Income (GNI) and adjusted income per capita. These three measures of income are
used in the absence of direct data on income.
III.
Results
The attained results are respectively provided for Arab and ECE countries. They concern
attainment and the likely relationships between the above two measures. Unemployment is
also taken into consideration.
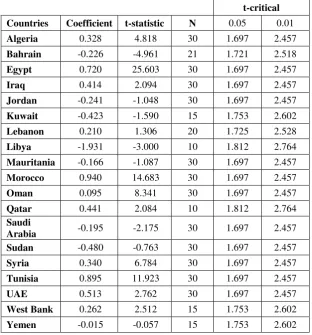
1. Intergenerational economic mobility measured by per capita GDP (constant 2005 US dollars) for Arab countries
Countries such as Morocco, Tunisia and Libya appear to be exhibiting higher elasticity in
relation to intergenerational economic mobility. This shows a high level of intergenerational
immobility with respect to GDP per capita. All the other Arab countries show lower elasticity
[image:10.595.142.455.328.664.2]implying higher mobility throughout generations
.
Table 1: Intergenerational economic mobility measured by per capita GDP (constant 2005 US dollars) for Arab countries
t-critical
Countries Coefficient t-statistic N 0.05 0.01
Algeria 0.328 4.818 30 1.697 2.457
Bahrain -0.226 -4.961 21 1.721 2.518
Egypt 0.720 25.603 30 1.697 2.457
Iraq 0.414 2.094 30 1.697 2.457
Jordan -0.241 -1.048 30 1.697 2.457
Kuwait -0.423 -1.590 15 1.753 2.602
Lebanon 0.210 1.306 20 1.725 2.528
Libya -1.931 -3.000 10 1.812 2.764
Mauritania -0.166 -1.087 30 1.697 2.457
Morocco 0.940 14.683 30 1.697 2.457
Oman 0.095 8.341 30 1.697 2.457
Qatar 0.441 2.084 10 1.812 2.764
Saudi
Arabia -0.195 -2.175 30 1.697 2.457
Sudan -0.480 -0.763 30 1.697 2.457
Syria 0.340 6.784 30 1.697 2.457
Tunisia 0.895 11.923 30 1.697 2.457
UAE 0.513 2.762 30 1.697 2.457
West Bank 0.262 2.512 15 1.753 2.602
Yemen -0.015 -0.057 15 1.753 2.602
2. Intergenerational economic mobility measured by per capita GDP (constant 2005 US dollars) in ECE
generations. All the other ECE economies exhibit high level of economic mobility of newer
generations.
Table 2: Intergenerational economic mobility measured by per capita GDP (constant 2005 US dollars) for ECE countries
t-critical
Countries Coefficient t-statistic N 0.05 0.01
Albania 0.335 0.828 25 1.708 2.485
Bosnia &
Herzegovina 0.273 7.656 15 1.753 2.602
Bulgaria 1.059 2.558 25 1.708 2.485
Croatia 0.446 4.340 15 1.753 2.602
Czech Republic 0.861 3.899 15 1.753 2.602
Estonia 0.525 5.361 15 1.753 2.602
Hungary 0.789 8.765 20 1.725 2.528
Kosovo 0.548 9.529 10 1.812 2.764
Latvia 0.593 5.647 15 1.753 2.602
Lithuania 0.559 1.133 6 1.943 3.143
Macedonia 0.965 3.857 20 1.725 2.528
Montenegro 0.854 5.524 15 1.753 2.602
Poland 0.917 19.356 20 1.725 2.528
Romania -0.742 -1.709 25 1.708 2.485
Serbia 0.729 5.289 15 1.753 2.602
Slovakia 0.983 9.698 15 1.753 2.602
Slovenia 0.423 4.147 15 1.753 2.602
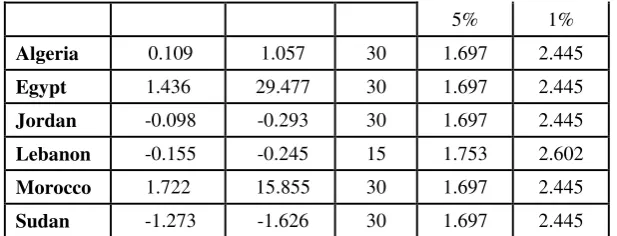
3. Intergenerational economic mobility measured by GNI per capita (constant 2005 US$) for Arab Countries
When using GNI per capita, Egypt and Morocco and Sudan, appear to be showing with high
statistical significance, higher elasticity as a signal of immobility of the economic status
across generations. The other few countries left have elasticity estimate not statistically
different from zero. This means that the estimates attained indicate that the economic status of
newer generations is mainly driver by a while noise and no link could be established with the
economic situation of the older generation.
Table 3: Intergenerational economic mobility measured by GNI per capita (constant 2005 US$) for Arab Countries
5% 1%
Algeria 0.109 1.057 30 1.697 2.445
Egypt 1.436 29.477 30 1.697 2.445
Jordan -0.098 -0.293 30 1.697 2.445
Lebanon -0.155 -0.245 15 1.753 2.602
Morocco 1.722 15.855 30 1.697 2.445
Sudan -1.273 -1.626 30 1.697 2.445
4. Intergenerational economic mobility measured by GNI per capita for ECE countries
With the use of GNI per capita, Macedonia, Bulgaria, the Czek republic, Latvia, Romania,
Montenegro and Serbia are showing higher elasticity implying that immobility of
economic status is occurring in these countries. Croatia, Slovenia and Hungary appear to
be having more economic mobility. But, Estonia is exhibiting no link with the income of
[image:12.595.144.453.70.188.2]the older generation.
Table 4: Intergenerational economic mobility measured by GNI per capita (constant 2005 US$) for ECE countries
Countries Coefficient t-statistics N t-critical
5% 1%
Estonia -0.559 -0.525 12 1.782 2.681
Macedonia 1.046 4.201 13 1.771 2.650
Latvia 0.787 7.166 14 1.761 2.624
Croatia 0.436 3.423 15 1.753 2.602
Czech
Republic 0.859 4.706 15 1.753 2.602
Hungary 0.558 4.424 15 1.753 2.602
Romania 1.213 4.872 15 1.753 2.602
Serbia 0.799 7.529 16 1.746 2.583
Slovenia 0.670 6.931 16 1.746 2.583
Montenegro 0.809 5.425 18 1.734 2.552
Bulgaria 1.351 3.039 25 1.708 2.485
When attempting the use of the adjusted net national income per capita, it appears that
Bahrain, Egypt, Morocco, Tunisia, Oman, Qatar and Yemen have higher immobility in
economic intergenerational transfers.
Table 5: Intergenerational economic mobility measured by the adjusted net national income per capita (current US$) for Arab countries
Countries Coefficient t-statistics N tcritical
5% 1%
Algeria 0.386 1.241 25 1.708 2.485
Bahrain 1.219 10.133 25 1.708 2.485
Egypt 3.307 6.842 25 1.708 2.485
Jordan 0.445 0.998 25 1.708 2.485
Kuwait 0.233 0.432 25 1.708 2.485
Lebanon 0.747 3.621 20 1.725 2.528
Mauritania 0.409 3.798 30 1.697 2.457
Morocco 1.704 8.744 30 1.697 2.457
Oman 1.329 4.439 30 1.697 2.457
Qatar 1.039 1.762 30 1.697 2.457
Saudi
Arabia 0.095 0.317 30 1.697 2.457
Syria -0.374 -2.367 30 1.697 2.457
Tunisia 1.731 14.584 30 1.697 2.457
Yemen 1.181 5.545 20 1.725 2.528
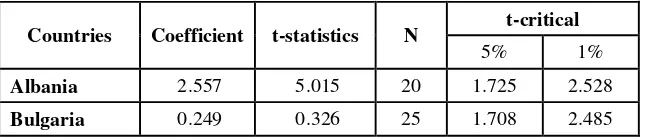
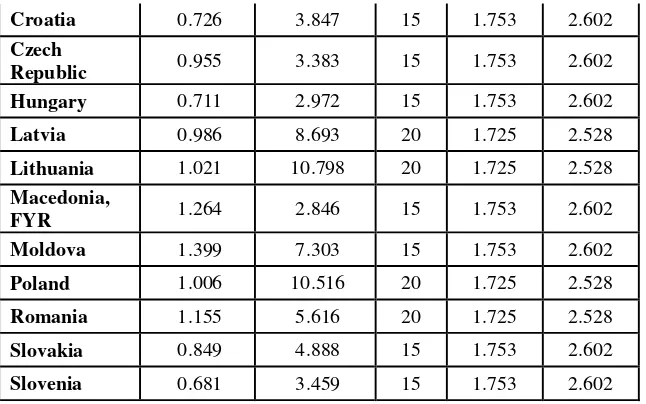
6. Intergenerational economic mobility measured by the adjusted net national income per capita (current US$) for ECE countries
Under the adjusted net national income per capita, Albania, the Czech Republic, Latvia,
Lithuania, Macedonia, Moldova, Poland, Romania and Slovakia show higher elasticity with
the implied high level of economic immobility. But, Albania has the highest level according
[image:13.595.138.461.696.765.2]to the statistical estimates. It is followed by Moldova, Macedonia, Romania and then Poland.
Table 6: Intergenerational economic mobility measured by the adjusted net national income per capita (current US$) for ECE countries
Countries Coefficient t-statistics N t-critical
5% 1%
Albania 2.557 5.015 20 1.725 2.528
Croatia 0.726 3.847 15 1.753 2.602 Czech
Republic 0.955 3.383 15 1.753 2.602
Hungary 0.711 2.972 15 1.753 2.602
Latvia 0.986 8.693 20 1.725 2.528
Lithuania 1.021 10.798 20 1.725 2.528
Macedonia,
FYR 1.264 2.846 15 1.753 2.602
Moldova 1.399 7.303 15 1.753 2.602
Poland 1.006 10.516 20 1.725 2.528
Romania 1.155 5.616 20 1.725 2.528
Slovakia 0.849 4.888 15 1.753 2.602
Slovenia 0.681 3.459 15 1.753 2.602
7.
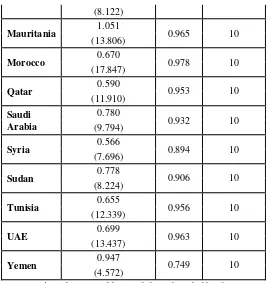
Elasticity for intergenerational mobility in educational attainment
The elasticity of educational attainment is obtained from a previous paper of Driouchi, Boboc,
Gamar, Titan and Achehboune (2016). In such a paper, all Arab countries appear to have
estimated elasticity that is highly statistically significant and below one at the exception of
Mauritania where the estimated coefficient is around one. This implies that all countries
except Mauritania exhibit higher mobility for educational attainment meaning that new
generations are enjoying higher attainment compared to the older ones. Mauritania appears to
[image:14.595.138.461.69.271.2]be at the limit as it has lower mobility in educational attainment.
Table 7: Elasticity for intergenerational mobility in educational attainment in Arab countries. Source: Driouchi, Boboc, Gamar, Titan and Achehboune (2016)
Country Independent R² Obsevations
Algeria 0.643 0.749 10
(4.572)
Bahrain 0.378 0.829 10
(5.835)
Egypt 0.750 0.882 10
(7.221)
Iraq 0.510 0.968 10
(14.477)
Jordan 0.692 0.978 10
(17.749)
Kuwait 0.486 0.829 10
(8.122)
Mauritania 1.051 0.965 10
(13.806)
Morocco 0.670 0.978 10
(17.847)
Qatar 0.590 0.953 10
(11.910)
Saudi Arabia
0.780
0.932 10 (9.794)
Syria 0.566 0.894 10
(7.696)
Sudan 0.778 0.906 10
(8.224)
Tunisia 0.655 0.956 10
(12.339)
UAE 0.699 0.963 10
(13.437)
Yemen 0.947 0.749 10
(4.572)
[image:15.595.164.432.66.349.2](all estimated coefficients statistically highly significant)
Table 8: Elasticity for intergenerational mobility in educational attainment in ECE countries. Source: Driouchi, Boboc, Gamar, Titan and Achehboune (2016)
Countries Total Education ECE Elasticities tstatistics
Albania 0.577 5.183
Bulgaria 0.553 5.518
Croatia 0.994 12.567
Czech 1.028 10.483
Estonia 1.219 28.112
Hungary 1.450 7.287
Latvia 0.906 16.667
Lithuania 0.686 16.526
Poland 0.811 15.630
Romania 0.524 9.775
Serbia 0.919 15.028
Slovakia 0.918 8.336
Slovenia 0.649 8.342
8.
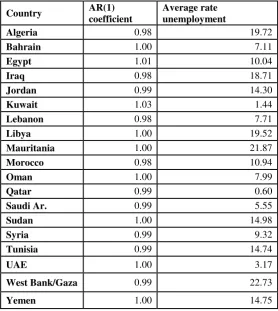
Unemployment Processes
The above results are confirmed by the unemployment processes that are estimated based on
World Bank unemployment data 1991-2013. Most Arab countries have unemployment rate
and with coefficient higher or equal to 1. These countries include Bahrain, Qatar, Oman,
Kuwait and UAE but all have low unemployment average rate. Saudi Arabia with a low
unemployment rate shows a stationary process for unemployment rate. Other countries such
as Egypt, Libya, Mauritania, Sudan and Yemen do show explosive pattern for their
unemployment rates. But Algeria, Iraq, Morocco, Tunisia and West Bank/Gaza exhibit very
[image:16.595.158.441.264.578.2]high unemployment rates.
Table 9: Unemployment Processes in Arab Countries
Country AR(1)
coefficient
Average rate unemployment
Algeria 0.98 19.72
Bahrain 1.00 7.11
Egypt 1.01 10.04
Iraq 0.98 18.71
Jordan 0.99 14.30
Kuwait 1.03 1.44
Lebanon 0.98 7.71
Libya 1.00 19.52
Mauritania 1.00 21.87
Morocco 0.98 10.94
Oman 1.00 7.99
Qatar 0.99 0.60
Saudi Ar. 0.99 5.55
Sudan 1.00 14.98
Syria 0.99 9.32
Tunisia 0.99 14.74
UAE 1.00 3.17
West Bank/Gaza 0.99 22.73
Yemen 1.00 14.75
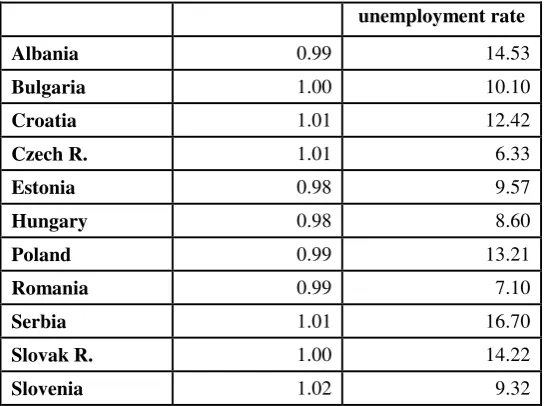
In comparison with ECE countries, Bulgaria, Serbia and the Slovak Republic show explosive
patterns in unemployment rates. Other countries such as Albania, Croatia, and Poland have
very high unemployment rates while Romania and the Czech Republic exhibit the lowest
average rates. These series of patterns are similar to those shown for Arab countries. The
following table summarizes the result for ECE countries.
[image:16.595.158.437.267.579.2]unemployment rate
Albania 0.99 14.53
Bulgaria 1.00 10.10
Croatia 1.01 12.42
Czech R. 1.01 6.33
Estonia 0.98 9.57
Hungary 0.98 8.60
Poland 0.99 13.21
Romania 0.99 7.10
Serbia 1.01 16.70
Slovak R. 1.00 14.22
Slovenia 1.02 9.32
9.
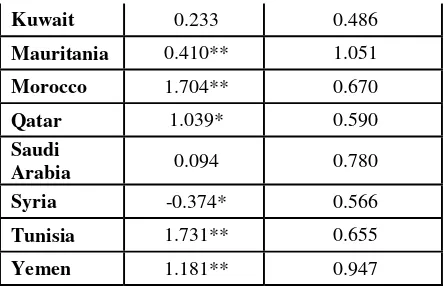
Social and educational mobility
Bahrain, Egypt, Morocco, Tunisia and Yemen show high social immobility with high
mobility in education attainment. In these countries, the higher educational attainment of
newer generations appear to not be accounted for by social intergenerational mobility. Qatar
appears to have lower social mobility but higher intergenerational mobility in educational
attainment. While social mobility in Algeria is not statistically different from zero,
educational mobility appears to be high implying that an important discrepancy might exist in
the economy. The same situation prevails in Jordan, Kuwait and Saudi Arabia according to
the estimates. The high social mobility as estimated for Mauritania shows the central role of
educational attainment that needs to be enhanced. But none of the Arab countries included in
[image:17.595.162.436.70.273.2]these estimations is showing high mobility in both social and educational mobility.
Table 11: Social and educational mobility in Arab countries.
Countries Social
Mobility
Educational Mobility
Algeria 0.386 0.643
Bahrain 1.219** 0.378
Egypt 3.307** 0.750
Kuwait 0.233 0.486
Mauritania 0.410** 1.051
Morocco 1.704** 0.670
Qatar 1.039* 0.590
Saudi
Arabia 0.094 0.780
Syria -0.374* 0.566
Tunisia 1.731** 0.655
Yemen 1.181** 0.947
10.
Likelihood of Links between unemployment, social and educational
mobility
This exercise is attempted respectively for Arab and ECE countries using the available few
[image:18.595.187.411.69.212.2]observations as they are introduced in table 12.
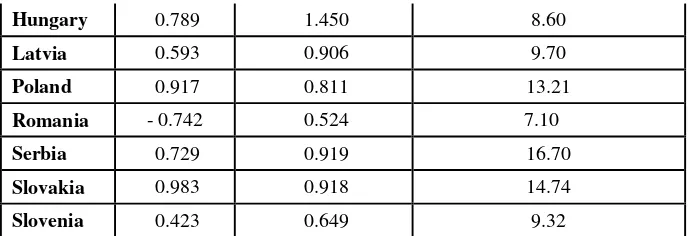
Table 12: Overall outcomes for Arab and ECE countries
Countries Social
Mobility
Educational Mobility
Average rate unemployment
Algeria 0.386 0.643 19.72
Bahrain 1.219 0.378 7.11
Egypt 3.307 0.750 10.04
Jordan 0.445 0.692 14.30
Kuwait 0.233 0.486 1.44
Mauritania 0.410 1.051 21.87
Morocco 1.704 0.670 10.94
Qatar 1.039 0.590 0.60
Saudi
Arabia 0.095 0.780 5.55
Syria -0.374 0.566 9.32
Tunisia 1.731 0.655 14.74
Yemen 1.181 0.947 14.75
Countries Social Mobility
Educational
Mobility Average rate unemployment
Albania 0.335 0.577 14.53
Bulgaria 1.059 0.553 10.10
Croatia 0.446 0.994 12.42
Czech
Hungary 0.789 1.450 8.60
Latvia 0.593 0.906 9.70
Poland 0.917 0.811 13.21
Romania - 0.742 0.524 7.10
Serbia 0.729 0.919 16.70
Slovakia 0.983 0.918 14.74
Slovenia 0.423 0.649 9.32
But regression analysis provides a better view about linkages. For Arab countries, the best
regression attempted to link unemployment rate to educational mobility and social mobility
shows that unemployment rate is related to educational mobility at the 5 % significance level.
This would mean that the higher (the lower) educational mobility, the higher (the lower) is
[image:19.595.126.474.69.187.2]unemployment. The related coefficient is 0.612.
Table 13: Unemployment, Social and Educational Mobility in Arab Countries
Dependent
variable Obervations R
2 Social Mobility Educational
Mobility
Unemployment
rate 11 0.374
-0.028 0.612 (t-sta : -0.107) (t-stat : 2.317)
For ECE countries, no statistically significant result is attained through the best regression
[image:19.595.87.495.372.434.2]that is attempted to link educational mobility to unemployment rate and social mobility.
Table 14: Unemployment, Social and Educational Mobility in ECE Countries
Dependent
variable Obervations R
2 Unemployment Social Mobility
Educational mobility
9 0.210 -0.121 -0.428
(t-sta : -0.358) (t-stat : -1.266 )
But over all arab and ECE countries, social mobility, education mobility and unemployment
appear to exhibit no statistically significant correlation.
[image:19.595.106.489.532.596.2]SM EM UN
SM Pearson Correlation 1 ,054 ,062
Sig. (2-tailed) ,803 ,772
N 24 24 24
EM Pearson Correlation ,054 1 ,243
Sig. (2-tailed) ,803 ,252
N 24 24 24
UN Pearson Correlation ,062 ,243 1
Sig. (2-tailed) ,772 ,252
N 24 24 24
IV.
Discussion and Conclusion
There are discrepancies between social mobility in most Arab countries in comparison with
ECE economies. This could be related to the nature of the economic transition experienced by
each group of economies. For Arab countries, the social mobility is almost stationary or
decreasing in comparison to educational attainment. This says that the current ladder of social
mobility is becoming less accessible to younger generations that have higher educational
attainment than in the past.
This has led some authors to relating this situation to the 2011 political changes that took
place in Egypt, Tunisia, Libya and Yemen. Some other authors have looked at the other
political and social consequences of these discrepancies. Bahrain, Egypt, Morocco, Tunisia
and Yemen show low social mobility with high mobility in education attainment. In these
countries, the higher educational attainment of newer generations appear to not be accounted
for by social intergenerational mobility. Qatar appears to have lower social mobility but
an important discrepancy exists in the economy. The same situation prevails in Jordan,
Kuwait and Saudi Arabia according to the estimates. The high social mobility as estimated for
Mauritania shows the central role of educational attainment that needs to be enhanced. But
none of the Arab countries included in these estimations is showing high social and
educational mobility. In comparison with ECE countries, Montenegro, Serbia and the Slovak
Republic show explosive patterns in unemployment rates. Other countries such as Albania,
Croatia, and Poland have very high unemployment rates while Romania and the Czech
Republic exhibit the lowest average rates.
These trends as shown for Arab countries, require further policy responses in relation to the
enhancement of employment possibilities, income and access to social benefits that would
accompany the mobility in educational attainment. These countries need to set the political
objectives of replacing the former social ladder with market driven processes. While this
References
Andrews, D. and A. Leigh (2009), “More inequality, less social mobility”, Applied
Economics Letters, Vol. 16.
Andreou, S. and Koutsampelas, C. (2015). Intergenerational Mobility and Equality of Opportunity in Higher Education in Cyprus. International Journal of Educational Development, 41C, pp. 80-87.
Alissa, M. (2014). 2014 Syria regional response plan: Strategic overview. ILO, 4-472.
Altzinger, W., Crespo, J., Rumplmair, B. Sauer, P. and Schneebaum A. (2015) Education and social mobility in Europe: Levelling the playing field for Europe’s children and
fuelling its economy. Mimeo, WWWforEurope.
Barsoum, G., Ramadan, M., & Mostafa, M. (2014). Labour market transitions of young women and men in Egypt. Geneva: ILO.
Binzel, C. & Carvalho, J.P. (2016). Education, Social Mobility, and Religious Movements: The Islamic Revival in Egypt. The Economic Journal online doi: 10.1111/ecoj.12416. 8 August 2016
Binzel, C. and Carvalho, J.P. (2015). Education, Social Mobility and Religious
Movements:The Islamic Revival in Egypt. Heidelberg University & IZA University of California, Irvine, June 2015, 51 pages.
Binzel, C. (2011). Decline in Social Mobility: Unfulfilled Aspirations among Egypt’s
Educated Youth. IZA Discussion Paper No. 6139, November 2011, 53 pages.
Björklund, A. and M. Jäntti (1997), “Intergenerational Income Mobility in Sweden Compared to the United States”, American Economic Review, Vol. 87, No. 5.
Black, S., Devreux, P. Lundborg, P. and Majlesi, K. (2015). Poor Little Rich Kids? The Determinants of the Intergenerational Transmission of Wealth. NBER Working Paper No. 21409. Issued in July 2015.
Black, S. and Devreux, P. (2010). Recent Developments in Intergenerational Mobility. NBER Working Paper Number 15889, April 2010.
Black, S., Devreux , P. and Salvanes, K.G. (2004). Why the Apple Doesn’t Fall Far:
Understanding Intergenerational Transmission of Human Capital. FRBSF working paper 2004-12.
Blanden, J., & Machin, S. (2004). Educational Inequality and the Expansion of UK Higher Education. Scottish J Political Economy Scottish Journal of Political Economy, 51(2), 230-249.
Bourguignon, F., Ferreira, F and M. Menendez (2003), “Inequality of Outcomes and Inequality of Opportunities in Brazil”, DELTA Working Papers, No. 2003-24.
Breen, R. and Jonsson, J.O (2005). Inequality of Opportunity in Comparative Perspective: Recent Research on Educational Attainment and Social Mobility. Annual Review of Sociology, Vol. 31 (2005), pp. 223-243.
Breen, R. (1997) Inequality, economic growth and social mobility. British Journal of Sociology 48: 429-49
Bukodi, E., Goldthorpe, J.H., Waller, L. and Kuha, J. (2015). The mobility problem in Britain: new findings from the analysis of birth cohort data, The British Journal of Sociology 2015 Volume 66 Issue 1, pp 93-117.
Carvalho, J.P. (2016) Identity-based organizations. American Economic Review: Papers & Proceedings, 106(5), 410- 414
Carvalho, J.P. (2015). Education, social mobility and religious movements: The islamic
revival in Egypt” (with Christine Binzel), The Economic Journal, forthcoming.
Causa, O. and Å. Johansson (2009), “Intergenerational Social Mobility”, OECD Economics
Department Working Papers, No. 707.
Causa, O. and C. Chapuis (2009), Equity in Student Achievement across OECD Countries: An Investigation of the Role of Policies. OECD Economics Department Working Papers, No. 708.
Causa, O., S. Dantan, and Å. Johansson (2009), Intergenerational Social Mobility in European OECD Countries. OECD Economics Department Working Papers, No. 709.
Chadwick, L. and Solon, G. (2002). Intergenerational Income Mobility among Daughters. The American Economic Review, Vol. 92, No. 1 (Mar., 2002), pp. 335-344 Published by: American Economic Association Stable URL: http://www.jstor.org/stable/3083337 Accessed: 31-07-2015 16:11 UTC
Chamlou, N. Moghadam, V. and Karshenas, M. (2016). Women, Work, and Welfare in the Middle East and North Africa: Introduction and Overview. Chapter 1, pp:1-30 in Women, Work and Welfare in the Middle East and North Africa: The Role of Socio-demographics, Entrepreneurship and Public Policies, 624pp Mar 2016 ISBN: 978-1-78326-735-4 (ebook).
Chetty, R., Nathaniel Hendren, N., Kline, P. and Saez, E. . (2015). Economic Mobility. Pathways. The Poverty and Inequality Report 2015. The Stanford Center on Poverty and Inequality.
working paper series. Working Paper 19844 http://www.nber.org/papers/w19844 NATIONAL BUREAU OF ECONOMIC RESEARCH 1050 Massachusetts Avenue Cambridge, MA 02138 January 2014.
Corak, M. (2016). Economic Theory and Practical Lessons for Measuring Equality of Opportunities. OECD Statistics Working Papers 2016/02. 21 pages.
Corak, M. (2013a). Income Inequality, Equality of Opportunity, and Intergenerational Mobility. Journal of Economic Perspectives, 27(3): 79-102.
DOI: 10.1257/jep.27.3.79
Corak, M. (2013b). Inequality, Equality of Opportunity, and Intergenerational Mobility. IZA DP No. 7520. 28 pages.
Corak, M. (2006). Do Poor Children Become Poor Adults? Lessons from a Cross Country Comparison of Generational Earnings Mobility. IZA DP No. 1993. March 2006.
Corak, M., Gustafsson, B., & Osterberg, T. (2004). Generational influences on unemployment insurance. In M. Corak (Ed.), Generational income mobility in North America and Europe (pp. 245-288). Cambridge: Cambridge University Press.
d'Addio, A. C. (2007). Intergenerational transmission of disadvantage: Mobility or immobility across generations? A review of the evidence for OECD countries. Paris: OECD.
Dang, T. (2015). Intergenerational Mobility of Earnings and Income among Sons and Daughters in Vietnam. SSRN 2612376, May 2015,
http://dx.doi.org/10.2139/ssrn.2612376.
Dhillon, N., & Yousef, T. (Eds.). (2009). Generation in Waiting: The Unfulfilled Promise of Young People in the Middle East. Brookings Institution Press.
Diewald, M., Schulz, W. and Baier, T. (2015). Intergenerational Downward Mobility in Educational Attainment and Occupational Careers in West Germany in the Twentieth Century. Eur Sociol Rev (2015) 31 (2): 172-183.doi: 10.1093/esr/jcv010This article appears in:Special Issue: Social Change, Cohort Inequalities, and Life Courses in Germany since the 1920's – Contributions from the German Life History Study.
Driouchi, A., Boboc, C., Gamar, A., Titan, E. and Achehboune, A. (2016). Inequality, Intergenerational Mobility of Women Educational Attainment and Inclusive Policies in Arab Countries. FEMISE report 2016. 53 pages.
Dumas, C. and Lambert, S. (2011). Educational Achievement and Socio-economic
Background: Causality and Mechanisms in Senegal. J. Afr. Econ., 20 (1) (2011), pp. 1–26.
Elder, S., Barcucci, V., Gurbuzer, Y., Perardel, Y., & Principi, M. (2015). Labour market transitions of young women and men in Eastern Europe and Central Asia.
El Zanaty, & Associates. (2007). School-to-work transition: Evidence from Egypt. Geneva: ILO.
Erzsebet, B. and Goldthorpe, J.H (2015). Educational attainment –relative or absolute- as a mediator of intergenerational class mobility in Britain? Research in Social
Stratification and Mobility, online January 2015.
Fields, G. S. (1980). Education and income distribution in developing countries: A review of the literature [Electronic version]. In T. King (Ed.), Education and income: A
background study for world development (pp. 231-315). Washington, DC: The World Bank.
Goldthorpe, J.H. (2015). State of the nation 2015: Social mobility and child poverty in Great Britain. London: Social Mobility and Child Poverty Commission.
Goldthorpe, J.H. (2014). The role of education in intergenerational social mobility: Problems from empirical research in sociology and some theoretical pointers from economics. Rationality and Society 2014, Vol. 26(3) pp 265–289
Goldthorpe, J.H. (2012). Understanding – and Misunderstanding – Social Mobility in Britain: The Entry of the Economists, the Confusion of Politicians and the Limits of
Educational Policy. Oxford Institute of Social Policy and Nuffield, College, University of Oxford. 2/2012, 28 pages
Greenstone, M., Looney, A., Patashnik, J and YU, M. (2013). Thirteen Economic Facts about Social Mobility and the Role of Education. The Hamilton Project, June 2013 Report. Retrieved from: http://www.brookings.edu/research/reports/2013/06/13-facts-higher-education
Güell,M., Pellizzari,M., Pica,G. Rodríguez M. (2015). Correlating Social Mobility and Economic Outcomes. CEPR, DP10496.
Ianelli, C. and Paterson, L. (2005). Does Education Promote Social Mobility? No. 35, June 2005. http://www.ces.ed.ac.uk/PDF%20Files/Brief035.pdf
Ichino, A., Karabarbounis, L. and Moretti, E. (2010). The Political Economy of
Intergenerational Income Mobility. IZA DP No. 4767. February 2010. 44 pages.
ILO (2013a). Global Employment Trends 2013. International Labour Office Publication, January 2013. 190 pages.
ILO (2013b). Global Employment Trends For Youth 2013: A generation at risk. International Labour Office – Geneva: ILO, 111 pages.
Jerrim, J. and Macmillan, L. (2015). GGC: Is Education the Key? Income Inequality,
Intergenerational Mobility, and the Great Gatsby Curve: Is Education the Key? Social Forces 00(00) 1–29, Month, 2015 doi: 10.1093/sf/sov075
Lefgren, L. J., McIntyre, F. and Sims, D. (2015), Beyond education and fairness: A labor market taxation model for the Great Gatsby Curve. Economic Inquiry, Vol. 53, Issue 2, pp. 962-978.
ONEQ. (2014). Transition vers le marché du travail des jeunes femmes et hommes en Tunisie. Genève: BIT.
Machin, S. (2004). Education Systems and Intergenerational Mobility. Draft Paper Prepared for CESifo/PEPG Conference, Munich, September 2004.
Magnani, E. and Zhu, R. (2015) Social mobility and inequality in urban China: understanding the role of intergenerational transmission of education, Applied Economics, 47:43, 4590-4606, DOI: 10.1080/00036846.2015.1031877
Mazumder, B. (2005a). “Fortunate Sons: New Estimates of Intergenerational Mobility in the United States Using Social Security Earnings Data.” Review of Economics and
Statistics. Vol. 87, No. 2 (May), pages 235-255.
Mazumder, B. (2005b). “The Apple Falls Even Closer to the Tree than We Thought: New and Revised Estimates of the Intergenerational Inheritance of Earnings.” In Samuel
Bowles, Herbert Gintis, and Melissa Osborne Groves (Editors). Unequal Chances: Family Background and Economic Success. Pages 80-99. Princeton: Princeton University Press and Russell Sage.
Moghadam, V. (2015). Women, work and family in the Arab region: Toward economic citizenship. DIFI Family Research and Proceedings: Vol. 2013, Special issue on "Protecting the Arab Family from Poverty: Employment, Social Integration and Intergenerational Solidarity", 7. Expert Group Meeting for Middle East and North Africa, Doha, 2-3 June 2013 “Protecting the Arab Family from Poverty: Employment, Social Integration and Intergenerational Solidarity”,
DOI: 10.5339/difi.2013.arabfamily.7. Published online: 31 Mar 2015.
Mohanty, A.C. (2016). Education, Income Distribution and Intergenerational Mobility: Findings from Field Data. Contemporary Education Dialogue 13(1) 33–56. © 2016 Education Dialogue TrustSAGE Publications sagepub.in/home.nav DOI:
10.1177/0973184915603171. http://ced.sagepub.com.
Mok, K.H and Neubauer, D. (2015): Higher education governance in crisis: a critical reflection on the massification of higher education, graduate employment and social mobility, Journal of Education and Work, DOI: 10.1080/13639080.2015.1049023
Mok, K. H. and Wu, A.M (2015): Higher education, changing labour market
Mryyan, N., Barcucci, V. (2014) labour market transitions of young females and males in Jordan, International Labour Organization, p. 24
Pastore, F. and Roccisano, F. (2015). The Inheritance of Educational Inequality among Young People in Developing Countries. IZA Discussion Paper No. 9065, May 2015.
Pekkarinen, T, Salvanes, K.G and Sarvimaki, M. (2016). The evolution of social mobility: Norway over the 20th century. Discussion paper. Norvegian School of Economics.
ISSN: 0804-6824. SAM 02 2016. January 2016. 52 pages.
Ragui, A. and Saleh M. (2013). Does Improved Local Supply of Schooling Enhance
Intergenerational Mobility in Education? Evidence from Jordan. Economic Research Forum, Working paper 788, 29 pages.
Sadeq, T., & Elder, S. (2014). Labour market transitions of young women and men in Occupied Palestinian Territory. Geneva: ILO.
Salehi-Isfahan, D., Belhaj-Hassine, N. and Assad, R. (2014). Equality of opportunity in educational achievement in the Middle East and North Africa. The Journal of Economic Inequality, December 2014, Volume 12, Issue 4, pp 489-515.
Solon, G. (2015). What Do We Know So Far about Multigenerational Mobility? HCEO Conference on Social Mobility held at the University of Chicago in November 2014.
Torche, F. (2015). Analyses of intergenerational mobility: An interdisciplinary review. Annals of the American Political and Social Sciences 357: 37-62.
Torche, F. (2014). Intergenerational Mobility and Inequality: The Latin American Case. SO40CH30-Torche ARI 14 May 2014. Annu. Rev. Sociol. 2014. 40:30.1–30.24. The Annual Review of Sociology is online at soc.annualreviews.org, 24 pages.
Turcotte, M. (2011). Intergenerational education mobility: University completion in relation
to parents’ education level. Canadian Social Trends.
Van Heka, M. , Kraaykampa, G. and Wolbers, M.H.J. (2015). Family resources and male–
female educational attainment Sex specific trends for Dutch cohorts (1930–1984). Research in Social Stratification and Mobility 40 (2015) 29–38
World Bank. (2010). World Bank Annual Report and Worldbank data site.