In
fl
uence of Mo and W on High Temperature Hardness
of M
7C
3Carbide in High Chromium White Cast Iron
+1Kaoru Yamamoto
1,+2, Sudsakorn Inthidech
2, Nobuya Sasaguri
1and Yasuhiro Matsubara
31Department of Materials Science and Engineering, Kurume National College of Technology, Kurume 830-8555, Japan
2Department of Production Engineering, Mahasarakam University, Mahasarakam 44150, Thailand
3Fukuoka Jo Gakuin, Fukuoka 811-1313, Japan
The influence of Mo and W addition on the high temperature hardness of M7C3carbide was investigated using unidirectionally solidified
hypereutectic cast iron with 25 mass%Cr. Concentrations of alloying elements in primary M7C3carbide were measured by EDS. As Mo or W
content of the cast iron increases, the concentration of Mo and W in the carbide increased and that of Fe decreased. However, the Cr content was almost the same as about 60 mass%in spite of increasing the Mo and W contents. It was found from the XRD results that the lattice constant of M7C3carbide changed and its attendant volume of a unit cell increased as the Mo or W content was increased. From this point of view, it can be
considered that Fe atoms in the M7C3carbide were substituted by Mo or W which has larger atomic radius than Fe. In all the specimens, the
hardness of M7C3carbides are about 1600HV0.3 at the room temperature, and it decreases gradually with a rise of the test temperature. The
decreasing ratio of carbide hardness becomes smaller at high temperature as the Mo or W concentration in M7C3carbide increases. Thus, the
dissolution of Mo or W atom into M7C3carbide is very effective to maintaining the high temperature hardness of carbide. However, the
increment of the hardness became smaller at higher Mo and W contents, so that an excess addition of both elements gave less effect than expected. The fracture toughness of M7C3carbide at the room temperature was measured using an indentation fracture method, and the values
were very similar among the carbides regardless of Mo and W concentration in the M7C3carbide. [doi:10.2320/matertrans.F-M2014801]
(Received September 30, 2013; Accepted December 13, 2013; Published February 21, 2014)
Keywords: high chromium cast iron, M7C3carbide, high temperature hardness, alloying element, fracture toughness
1. Introduction
The microstructure of high chromium white cast irons consists of a matrix and eutectic chromium carbide of M7C3.
The mechanical properties of this series of alloys, like hardness and strength, can be controlled by heat treatment. They have been widely used for their abrasion wear resistance in hot rolling mill rolls and rollers or tables of mineral pulverizing mills. Depending on service condition, there are many cases where high Cr cast irons are exposed to high temperature. There, the wear resistance of the cast iron may deteriorate by oxidation and changing matrix structure. This behavior is manifested by declines of the strength and hardness at higher temperature.
It is important for heat resistant materials to retain their strength at high temperature. In alloyed steels, the addition of certain elements provides resistance to softening at elevated temperatures.1) These elements promote the precipitation of
secondary carbides during heat treatment.25)Deterioration of
cast iron at high temperature is due to softening not only of the matrix but also the carbide itself. Therefore, it is also im-portant to increase the carbide hardness at high temperatures. In this study, improvement of carbide strength at high temperature was sought by adding strong carbide formers such as Mo and W to a hypereutectic high Cr cast iron. Since both elements distribute preferentially to the M7C3 carbide
during solidification,6,7) their addition could improve the hardness of the carbide. They were added individually to the 25%Cr cast iron, and their effects on the high temperature hardness of M7C3carbide were systematically evaluated.
2. Experimental Procedures 2.1 Test specimens
High Cr cast irons with compositions from hypoeutectic to near eutectic have been usually used according to ASTM standards.8) In this range of composition, it is difficult to characterize the M7C3 carbide particles themselves because
the eutectic carbides have fine and rod-like or lamellar morphology. On the other hand with hypereutectic cast irons, the primary M7C3carbides crystallize in mass shapes and the
alloy composition of primary M7C3carbide is approximately
same as that of eutectic M7C3carbide.
In this study, the characterization was carried out using the primary M7C3 carbides crystallized in hypereutectic high Cr
cast irons. The target chemical compositions of cast iron specimens are shown in Table 1. According to the liquidus surface diagram of FeCrC system proposed by R. S. Jackson,9)as shown in Fig. 1, M7C3carbides in 25 mass%Cr
[image:1.595.303.549.397.438.2]iron precipitate as the primary phase when C content get over 3.2 mass%. The amounts of Mo and W added were each varied from 0 to 15 mass% in a base alloy with 4.5%C and 25%Cr where large sized primary carbides are expected to crystallize. Raw materials used for charge calculations in test specimen preparation were pig iron, ferroalloys and pure metals. The charge materials were melted, super-heated over 1773 K inside a Tammann furnace and then poured into a sand mold set on a water cooled copper chill plate as shown
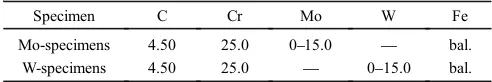
Table 1 Target chemical conditions for Cast iron specimens (mass%).
Specimen C Cr Mo W Fe
Mo-specimens 4.50 25.0 015.0 ® bal.
W-specimens 4.50 25.0 ® 015.0 bal.
+1This Paper was Originally Published in Japanese in J. JFS84(2012) 577
582.
in Fig. 2. The exothermic lining prevented the melt solid-ifying from the side of the mold. In this mold, unidirectional solidification took place from bottom to top. The primary M7C3carbide with hcp crystal structure grows in theh0001i
direction.
Each cast specimen was cut at 50 mm from its bottom, and the cross-sectional surface was used for characterization experiments. Observation of solidification structures was carried out using an optical microscope and the quantitative analyses of alloy concentration within M7C3carbide particles
were performed using EDS. The lattice constants of the M7C3
carbides were determined by the XRD method.
The M7C3 carbide particles, with diameters more than
100 µm, were subjected to Vickers micro-hardness measure-ments at elevated temperatures. Each specimen was held at prescribed temperature for 5 min in vacuum of 1©10¹2Pa,
and the hardness of the{0001}planes of the primary M7C3
carbide were measured with a load of 2.9 N (300 gf ) and the loading time of 20 s. These measurements were performed at room temperature and intervals of 100 K from 373 to 873 K. Finally, the fracture toughness of the M7C3 carbide at room
temperature was estimated by Indentation Fracture Method. 3. Results and Discussions
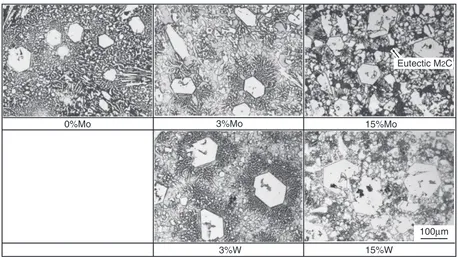
3.1 Effects of Mo and W contents on as-cast micro-structure of specimens
The microstructures of several Fe25%Cr4.5%C alloys with Mo from 0% to 15%Mo are shown in Fig. 3. In all specimens, microstructures of hexagonal primary M7C3
carbide particles, over 100 µm in diameter, andfine lamellar eutectic M7C3carbides growing from the vicinity of primary 0
5 10 15 20 25 30 35 40
Cr Content (mass%)
0 1 2 3 4 5
C Content (mass%)
γ δ
M7C3
M3C
Fig. 1 Diagram of liquidus surface for FeCrC system.9)
Copper Chill Plate φ30
φ65
100
φ35
Exothermic powder
Exothermic lining
CO2 mold
Water
50
Test piece
Fig. 2 Schematic cross-sectional view of unidirectional solidification mold.
0%Mo 3%Mo 15%Mo
100μm
3%W 15%W
Eutectic M2C
[image:2.595.79.261.71.256.2] [image:2.595.326.527.74.269.2] [image:2.595.69.527.304.561.2]carbide, were obtained. It was found that primary M7C3
carbide grew along heat flow direction. Even if the Mo content increased to 5%, the microstructure of as-cast specimen did not change. However, M2C carbides form as
a eutectic at the final stage of solidification when the Mo content increases to 10%. In the series of Fe25%Cr4.5%C cast irons with W additions, the microstructures were similar to those of the cast irons with Mo. Moreover, eutectic M2C
carbides are also observed in the specimens with W more than 10%. It is clear from these results that the morphology of primary M7C3 in 25%Cr cast irons with various Mo or W
content are almost the same. The concentrations of alloying elements in primary M7C3carbide were analyzed using EDS.
The relationships between the alloy concentration in primary M7C3 carbide and Mo or W content of the specimens are
shown in Figs. 4 and 5, respectively.
The Mo content in the M7C3 carbide increased linearly
with an increase in Mo added to the specimen. When the Mo content of specimen is 15%, Mo dissolved in the carbide is
approximately 10%. Accordingly, the Fe content in the M7C3
carbide decreased from 40 to 30%. The Cr content in the M7C3carbide was originally around 60%. It changed slightly
when the Mo content increased to 10%Mo, but reduced a little at 15%Mo.
The variation of alloying element concentrations in the M7C3carbide for the W-bearing cast irons is similar to that
in the Mo series. As the W content in the M7C3 carbide
increases, the Fe content decreases. When the W content of the alloy reaches 17%, W dissolved in the carbide is 9.7% and Fe content is 32%. However, Cr concentration in the M7C3 carbide is not affected by increasing W content. It
remains around 60%.
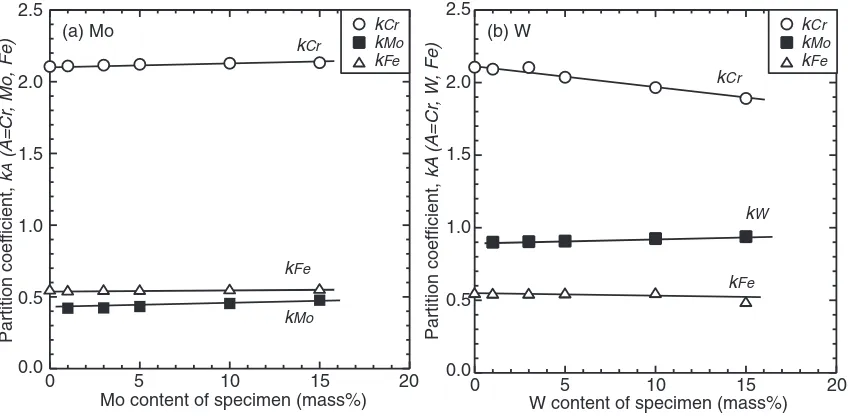
The partition coefficients of alloying elements to the primary M7C3 carbide were calculated by Thermo-Calc.10)
The influence of Mo or W content on the partition coefficient is shown in Fig. 6, (a) for Mo-bearing specimens and (b) for W-bearing specimens, respectively. The partition coefficient of Mo (kMo) is about 0.45, that of W (kW) is around 0.92.kCr Mo
Fe Cr
0 5 10
0 5 10 15 20
60
50
40
30 Mo
Cr
Fe
Mo content in M
7
C
3
carbide (mass%)
Fe or Cr content in M
7
C
3
carbide (mass%)
Mo content of specimen (mass%)
Fig. 4 Relationship between concentration of alloying elements in primary M7C3carbide and Mo content of specimen.
W Fe Cr
0 5 10
0 5 10 15 20
60
50
40
30 W
Cr
Fe
W content in M
7
C
3
carbide (mass%)
Fe or Cr content in M
7
C
3
carbide (mass%)
W content of specimen (mass%)
Fig. 5 Relationship between concentration of alloying elements in primary M7C3carbide and W content of specimen.
2.5
2.0
1.5
1.0
0.5
Partition coef
ficient,
k
A
(A=Cr
, Mo, Fe)
0.0
15 10
5 20
0
Mo content of specimen (mass%)
kCr
kMo
kFe
kCr
kMo
kFe
2.5
2.0
1.5
1.0
0.5
Partition coef
ficient,
kA
(A=Cr
, W
, Fe)
0.0
15 10
5 20
0
W content of specimen (mass%)
kCr
kW
kFe
(a) Mo (b) W kCr
kMo
kFe
[image:3.595.67.271.66.267.2] [image:3.595.324.528.70.264.2] [image:3.595.87.511.317.525.2]is 1.892.11 andkFeis about 0.5. It is clear that each partition
coefficient to the primary M7C3 carbide does not changed
even if the Mo or W content of carbide varies greatly. From these results, it is concluded that the concentrations of Mo and W in the primary M7C3increases in proportion to
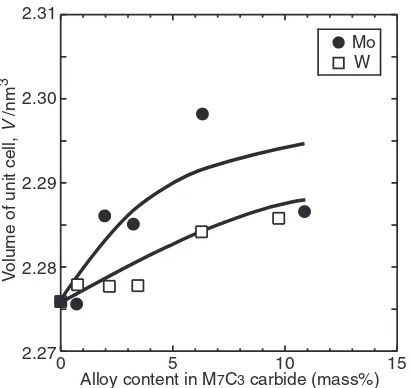
the initial compositions of alloying elements in the speci-mens. The unit cell lattice constants for the M7C3 carbides
were determined by XRD analysis. The relationship between the lattice constants of the hexagonal unit cell (a axis andc axis) and the alloy contents in the carbide are shown in Fig. 7. Though the data show scatter, a axis increases and c axis decreases with an increase in Mo content. On the other hand, the a axis decreases and c axis increases with increasing W content. The unit cell volume is calculated by the lattice parameter data. The effects of Mo and W contents on the volume of the M7C3 carbide unit cell are shown in
Fig. 8. The unit cell volume of the M7C3carbide increases as
the content of each element increases.
The proposed change of atomic layout in the M7C3carbide
is shown in Fig. 9.11) When either an atom of Mo or W
dissolves into the carbide, it replaces an Fe atom. The atomic
radii of Fe, Mo and W are 0.124, 0.136 and 0.137 nm,12)
respectively. With those of Mo and W being larger than that of Fe, the lattice constants of a and cchange with alloying element addition depending on the type of atom. In each case, the volume of the unit cell is expanded.
3.2 The effect of alloying elements on high temperature hardness
Hardness of primary M7C3 carbide in all cast iron
specimens was measured from room temperature to 873 K. The relationships between the hardness of M7C3carbide and
test temperature of Mo-bearing specimens and W-bearing specimens are shown in Figs. 10 and 11, respectively. In Fig. 10, over the range of Mo content, the hardness of M7C3
carbide ranges from 1540 to 1680HV0.3 at room temper-ature. Sharp declines in hardness occur for each Mo containing alloy with rising test temperature. However, the extent of hardness decline with temperature gradually slows with higher Mo content. Between room temperature and 873 K, the hardness of the Mo-free alloy declines by over 800 HV. By comparison, for the 15%Mo cast iron, a drop in hardness of only 500 HV occurs. The addition of Mo gives the obvious effect of resisting softening to the high Cr cast iron at high temperature.
The carbide hardness versus temperature profile for the W-bearing cast irons is similar to that of Mo-specimens. The hardness decreases as the test temperature is elevated. The change in this property is quite sharp for the W-free cast iron. However, the decline becomes slower with rise in W content of the alloy. This trend attests that higher W addition imparts the cast iron to increase softening resistance at high temperature.
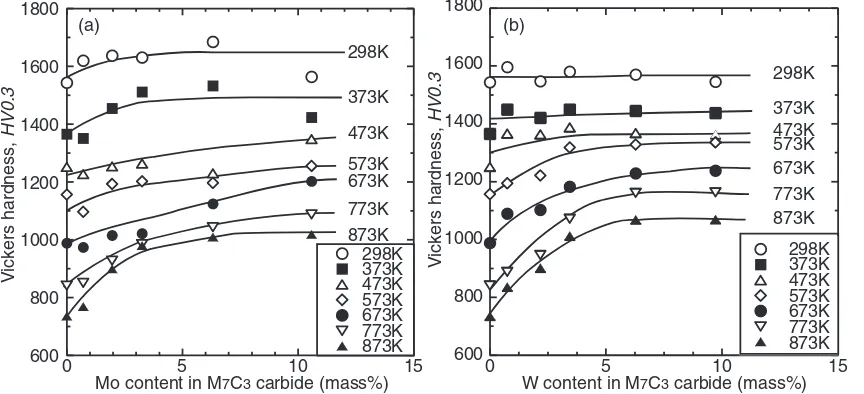
The effects of both Mo and W content on the M7C3carbide
hardness at various test temperatures are shown in Fig. 12. The hardness of M7C3 carbide is little affected by alloy
concentration in the carbide at low temperature. At high temperatures, however, the hardness increases with an increase sharply up to 5% Mo or W and then levels off. There may exist a critical concentration of elements to make the hardness saturate.
The influence of Mo or W content on high temperature hardness of the M7C3carbide may be discussed using a misfit
parameter. The creep rate of metal material is commonly evaluated using the misfit parameter (¤m) expressed in
eq. (1).13)
¤m¼rsr0
r0 ð1Þ
Mo (a axis) Mo (c axis) W (a axis) W (c axis)
0 5 10 15
1.390
1.385
0.465
0.455 0.460
Lattice constant of unit cell,
a, c
/ nm
Mo or W content in M7C3 carbide (mass%) 1.380
1.375
Fig. 7 Effect of Mo and W contents on unit cell lattice constants (aaxis andcaxis) of M7C3carbide.
Mo W 2.31
2.28
2.27
0 5 10 15
Alloy content in M7C3 carbide (mass%)
V
o
lume of unit cell,
V
/nm
2.29
3
2.30
Fig. 8 Effect of Mo and W contents on unit cell volume of M7C3carbide.
: Fe : Cr : Mo or W
: C
Fe-Cr-C alloy Fe-Cr-Mo or W-C alloy
[image:4.595.67.275.69.257.2] [image:4.595.312.541.72.172.2] [image:4.595.68.274.304.498.2]where, rs: atomic radius of solute, r0: atomic radius of
solvent. Matsuo et al.reported the relationship between the misfit parameter and the creep rate of 17%Cr14%Ni austenitic stainless steels.14)It shows that the misfit parameter
increases in the presence of Mo or W, and the creep rate reduces linearly. Umemoto et al. also reported the effect of alloying element on the high temperature hardness of cementite.15)When those alloying elements that increase the
misfit parameter exist in cementite, the decreasing ratio of hardness corresponding to elevating of the test temperature is smaller than that of the specimen without alloying element. It is considered that the strengthening mechanism is similar to the creep behavior.
In the carbides of this study, an Fe atom is replaced by Mo and W, and the misfit parameters for Mo and W to Cr are 0.09 and 0.10, while the misfit parameter of Fe to Cr is 0.01. The larger these values are the greater lattice distortion. The high temperature hardness of the M7C3carbide was improved due
to the same reason as the creep resistance. Another reason for
Mo and W to promote the resistance to softening at an elevated temperature could be due to the high melting point and large atomic radius of these elements. When Mo and W are added more than critical content, these elements can be substituted for Cr and the influence on high temperature strength decreases. Therefore, the amount of alloying element affecting on high temperature hardness could be limited. 3.3 Influence of Mo and W on fracture toughness of
M7C3carbide
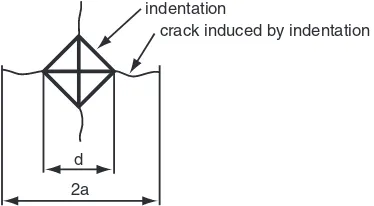
A fracture toughness measurement was made on primary M7C3carbide at room temperature by the indentation fracture
method.16) Figure 13 illustrates a schematic drawing of indentation fracture method. When the indenter contacts a carbide particle, as shown in the figure, cracks propagate from the corners of indentation on the carbide. The fracture toughness is obtained with the following eq. (2).
Kc¼¡ðEPÞ1=2ðd=2Þa3=2 ð2Þ 600
1600
1400
1200
1000
800
0%Mo
15%Mo 1%Mo 3%Mo 5%Mo 10%Mo
V
ickers hardness,
HV0.3
Temperature, T/K
[image:5.595.67.270.68.259.2]200 300 400 500 600 700 800 9001000
Fig. 10 Effect of Mo content of specimen on relationship between hardness of M7C3carbide and test temperature.
600 1600
1400
1200
1000
800
0%W
15%W 1%W 3%W 5%W 10%W
V
ickers hardness,
HV0.3
Temperature, T/K
[image:5.595.323.524.70.260.2]200 300 400 500 600 700 800 9001000
Fig. 11 Effect of W content of specimen on relationship between hardness of M7C3carbide and test temperature.
1800
1600
1400
1200
1000
800
600
V
ickers hardness,
HV0.3
0 5 10 15
Mo content in M7C3 carbide (mass%) 298K
373K
473K
573K 673K
873K 773K
1800
1600
1400
1200
1000
800
600
V
ickers hardness,
HV0.3
0 5 10 15
W content in M7C3 carbide (mass%) 298K
373K 473K 573K 673K
873K 773K
(a) (b)
298K 373K 473K 573K 673K
873K 773K
298K 373K 473K 573K 673K
873K 773K
[image:5.595.86.518.321.518.2]where,Kc: fracture toughness (Pa·m1/2),E: Young’s modulus
of M7C3carbide (Pa),d: diagonal length of indenter (m),¡:
calibration factor, P: indentated load (N), a: half length of crack (m).
The fracture toughness on the {0001} plane of M7C3
carbide is calculated using the applied load of 2.9 N (300 gf ) and the loading time of 15 s. The diagonal length of indentation (d) and the half-length of crack (a) were measured and Kc was obtained by the eq. (2). In addition,
the calibration factor (¡) and Young’s modulus of M7C3
carbide (E) used were 0.026 and 310 GPa,17)respectively.
Table 2 presents values for the fracture toughness of the M7C3 carbide (Kc) with different Mo or W content.
Regardless of kind and concentration of alloying element in the carbide, the Kcvalues are similar to one another. These
results could occur because the carbide is very brittle and the Kc values are low. Therefore, it can be concluded that the
effect of Mo or W on fracture toughness is very small at the room temperature.
4. Conclusions
In order to improve the mechanical properties of M7C3
carbide at high temperature, Mo and W were added from 0 to 15 mass%to a 25%Cr hyper-eutectic cast iron. The effects of contents of these elements on the high temperature hardness, lattice parameter of unit cell and fracture toughness of M7C3 carbide were investigated. The results can be
summarized as follows:
(1) Mo and W added to a cast iron dissolve into the M7C3
carbide phase depending on each partition coefficient. As either Mo or W content of the alloy increases, the Mo or W content in the carbide increases and on the contrary the Fe content decreases.
(2) The lattice parameters of the M7C3 carbide changes
with addition of Mo or W in the carbide. The volume of a unit cell increases and then the lattice distortion is increased.
(3) The hardness of M7C3 carbide decreases gradually for
each W and Mo containing alloys as the test temper-ature rises. The influences of Mo and W on the carbide hardness are small at low temperature. Both elements resist significantly the softening of carbides above 573 K. There might be critical concentrations of Mo and W to make the hardness saturate at high temperature. (4) The fracture toughness of M7C3 carbide at the room
temperature in Mo and W-free, 10%Mo and 10%W specimens are 3.07, 3.05 and 3.35 MPa·m1/2,
respec-tively. The dissolution of Mo and W in the M7C3
carbide has little effect on the fracture toughness of the carbide at room temperature.
REFERENCES
1) The Japan Institute of Metals and Materials:Tekkouzairyo, (The Japan Inst. Metals, Sendai, 1985) p. 48 (in Japanese).
2) E. Yajima, R. Ichikawa and K. Yoshizawa: Wakaigizyutsusya-notameno-kikai-kinzokuzairyo, (Maruzen, Tokyo, 1996) p. 175 (in Japanese).
3) M. Kuwano, K. Ogi and K. Matsuda: J. JFS54(1982) 586592. 4) C. Tong, T. Suzuki and T. Umeda: J. JFS62(1990) 344351. 5) S. Inthidech, P. Sricharoenchai, N. Sasaguri and Y. Matsubara: Trans.
AFS112(2004) 899910.
6) Y. Ono, N. Murai and K. Ogi:ISIJ Int.32(1992) 11501156.
7) K. Yamamoto, M. M. Liliac and K. Ogi: Int. J. Cast Met. Res. 16 (2003) 435440.
8) ASM International: Metals Handbook, Vol. 1, (ASM International, 2000) p. 87.
9) R. S. Jackson: J. Iron and Steel Inst.208(1970) 163167.
10) B. Sundmann, B. Jansson and J.-O. Andersson:CALPHAD9(1985) 153190.
11) K. Ichino, T. Toyooka, H. Hiraoka and Y. Kataoka: Abrasion2002(JFS Kyushu, 2002) pp. 155165.
12) The Japan Institute of Metals and Materials: Kinzoku Data Book, (Maruzen, Tokyo, 2004) p. 8.
13) K. Maruyama and E. Nakashima:Kouonnkyoudo-no-zairyoukagaku, (Uchida Roukakuho, 1997) p. 170 (in Japanese).
14) T. Matsuo, T. Shinoda and R. Tanaka: Tetsu-to-Hagane63(1977) 980 989.
15) M. Umemoto and K. Tuchiya: Tetsu-to-Hagane88(2002) 117128. 16) JIS R 1607:2010: Testing method for fracture toughness of fine
ceramics at room temperature, (Japan Industrial Standards, Japan, 2010).
17) M. G. Di V. Cuppari, R. M. Souza and A. Sinatora:Wear258(2005) 596603.
d
2a
indentation
[image:6.595.76.263.71.174.2]crack induced by indentation
[image:6.595.46.291.244.297.2]Fig. 13 Schematic drawing of indentation fracture method.
Table 2 Fracture toughness values of M7C3carbides with different Mo and
W contents of specimens.
Specimen Fracture toughnessKc, MPa·m1/2
25%Cr 3.07
25%Cr10%Mo 3.05