Identifying Topics by Position
C h i n - Y e w L i n a n d E d u a r d H o v y I n f o r m a t i o n S c i e n c e s I n s t i t u t e o f t h e U n i v e r s i t y o f S o u t h e r n C a l i f o r n i a
4676 A d m i r a l t y W a y M a r i n a d e l R e y , C A 90292, U S A
{cyl ,hovy}@isi. edu
A b s t r a c t
This paper addresses the problem of iden- tifying likely topics of texts by their posi- tion in the text. It describes the automated training and evaluation of an Optimal Posi- tion Policy, a method of locating the likely positions of topic-bearing sentences based on genre-specific regularities of discourse
structure. This method can be used in
applications such as information retrieval, routing, and text summarization.
1 I n t r o d u c t i o n : T o p i c S p o t t i n g b y P o s i t i o n
In an increasingly information-laden world, the problem of automatically finding the major topics of texts acquires new urgency. A module that can suggest likely locations of topics in texts, robustly and with an acceptable degree of correctness, would be useful for a number of important applications, including information retrieval, gisting, and auto- mated summarization.
Several methods have been tried to perform Topic Identification. Some involve parsing and semantic analysis of the text, and are therefore less robust
over arbitrary input. Others, such as the Cue Phrase
and Position methods, are more robust, though gen- erally somewhat less accurate. Of these, the Position Method, identified in the late 1950's, remains among the best; it can outperform newer methods such as those based on word counting (Salton et al., 1994).
The Position Method springs from the recognition that texts in a genre generally observe a predictable discourse structure, and t h a t sentences of greater topic centrality tend to occur in certain specifiable locations. The text's title, for example, is a very informative position in most genres, as is the Ab- stract paragraph in scientific articles. Edmundson (Edmundson, 1969) defined the Position Method as follows:
" . . . t h e machine-readable cues are cer- tain general characteristics of the corpus
provided by the skeletons of documents,
i.e. headings and format. The Location
method is based on the hypothesis that: (1) sentences occurring under certain headings are positively relevant; and (2) topic sen- tences tend to occur very early or very late in a document and its paragraphs."
However, since the paradigmatic discourse structure differs significantly over text genres and subject do- mains, the Position Method cannot be defined as straightforwardly as Baxendale's (Baxendale, 1958)
title plus first and last sentences of each paragraph;
it has to be tailored to genre and domain. Can one develop ways of tailoring this method?
Furthermore, since the resolution power of the Position Method is the sentence, while the de- sired output--topics--generally appear at the word or phrase level, the most accurate results of this method m a y still include too much spurious mate- rial to be really useful. How useful is the method in general? By what measure(s) can one evaluate it?
Basic questions about how the Position Method can be tailored for optimality over a genre and how it can be evaluated for effectiveness remain unan- swered. To our knowledge, no systematic study has yet been performed, though some variant of it has been used in computational studies (see for example (Edmundson, 1969; Luhn, 1958; Baxendale, 1958)), writing-education classes (for example, (Sjostrom and Hare, 1984)), and has been the subject of cog- nitive psychological verification (Kieras, 1985).
This paper contains an analysis of the Position Method. We first discuss previous work, then in Sec- tion 3 describe the background studies and training of an Optimal Position Policy for a genre of texts, and in Section 4 describe its evaluation.
2 R e l a t e d W o r k
Edmundson's (Edmundson, 1969) laid the ground- work for the Position Method. He introduced four clues for identifying significant words (topics) in a
text. Among them, Title and Location are related
to the Position Method. Edmundson assigned pos-
itive weights to sentences according to their ordi- nal position in the text, giving most weight to the first sentence in the first paragraph and the last sen- tence in the last paragraph. He conducted seven- teen experiments to verify the significance of these methods. According to his results, the Title and Location methods respectively scored around 40% and 53% accuracy, where accuracy was measured as the coselection rate between sentences selected by Edmundson's program and sentences selected by a human.
Although Edmundson's work is fundamental, his experiments used only 200 documents for training
and another 200 documents for testing. Further-
more, he did not trying out other possible combina- tions, such as the second and third paragraphs or the second-last paragraph. In order to determine where the i m p o r t a n t words are most likely to be found, Baxendale (Baxendale, 1958) conducted an inves- tigation of a sample of 200 paragraphs. He found t h a t in 85% of paragraphs the topic sentence was in the first sentence and in 7% the final one. Donlan (Dolan, 1980) stated that a study of topic sentences in expository prose showed t h a t only 13% of para- graphs of contemporary professional writers began with topic sentences (Braddock, 1974). Singer and Donlan (Singer and Dolan, 1980) maintain t h a t a paragraph's main idea can appear anywhere in the paragraph, or not be stated at all.
Arriving at a negative conclusion, Paijmans (Pai- jmans, 1994) conducted experiments on the relation between word position in a paragraph and its signif- icance, and found that "words with a high informa- tion content according to the tf.idf-based weighting schemes do not cluster in the first and the last sen- tences of paragraphs or in paragraphs t h a t consist of a single sentence, at least not to such an extent t h a t such a feature could be used in the prepara- tion of indices for Information Retrieval purposes." In contrast, Kieras (Kieras, 1985) in psychological studies confirmed the i m p o r t a n c e of the position of a mention within a text.
3
Training t h e R u l e s
3.1 B a c k g r o u n d
T h e purposes of our study are to clarify these contra- dictions, to test the abovementioned intuitions and results, and to verify the hypothesis t h a t the impor- tance of a sentence in a text is indeed related to its ordinal position. Furthermore, we wish to discover empirically which textual positions are in fact the richest ones for topics, and to develop a m e t h o d by which the optimal positions can be determined au- tomatically and their i m p o r t a n c e evaluated.
To do all this, one requires a much larger docu- ment collection than that available to Edmundson and Baxendale. For the experiments described here, we used the Ziff-Davis texts from the corpus pro-
duced for DARPA's T I P S T E R program (Harman, 1994). Volume 1 of the Ziff corpus, on which we trained the system, consists of 13,000 newspaper texts a b o u t new computers and related hardware, computer sales, etc., whose genre can be character- ized as product announcements. T h e average text length is 71 sentences (34.4 paragraphs). Each text is accompanied by both a set of three to eight topic keywords and an abstract of approx. 6 sentences (both created by a human).
In summary, we did the following: To determine the efficacy of the Position Method, we empirically
determined the yield of each sentence position in the
corpus, measuring against the topic keywords. We next ranked the sentence positions by their average
yield to produce the Optimal Position Policy ( O P P )
for topic positions for the genre. Finally, now com- paring to the abstracts accompanying the texts, we
measured the coverage of sentences extracted from
the texts according to the policy, cumulatively in the position order specified by the policy. T h e high degree of coverage indicated the effectiveness of the position m e t h o d .
3.2 S e n t e n c e P o s i t i o n Y i e l d s a n d t h e
O p t i m a l P o s i t i o n P o l i c y
We determined the optimal position for topic oc- currence as follows. Given a text T and a list of topics keywords t/ of T , we label each sentence of T with its ordinal paragraph and sentence n u m b e r ( P ~ , S n ) . We then removed all closed-class words from the texts. We did not perform morphological restructuring (such as canonicalization to singular nouns, verb roots, etc.) or anaphoric resolution (re- placement of pronouns by originals, etc.), for want of robust enough m e t h o d s to do so reliably. This makes the results somewhat weaker than they could be.
W h a t d a t a is most appropriate for determining the optimal position? We had a choice between the topic keywords and the abstracts accompanying each text in the corpus. Both keywords and abstracts contain phrases and words which also appear in the original texts; on the assumption t h a t these phrases or words are more i m p o r t a n t in the text t h a n other ones, we can assign a higher importance to sentences with more such phrases or words (or parts of t h e m ) ) Since a topic keyword has a fixed boundary, using it to rank sentences is easier t h a n using an abstract.
For this reason we defined sentence yield as the av-
erage n u m b e r of different topic keywords mentioned in a sentence. We computed the yield of each sen- tence position in each text essentially by counting
the number of different topic keywords contained in the appropriate sentence in each text, and averag- ing over all texts. Sometimes, however, keywords consist of multiple words, such as "spreadsheet soft- ware". In order to reward a full-phrase mention in a sentence over just a partial overlap with a multi- word keyword/phrase, we used a formula sensitive to the degree of overlap. In addition, to take into account word position, we based this formula on the Fibonacci function; it monotonically increases with longer matched substrings, and is normalized to pro- duce a score of 1 for a complete phrase match. Our hit function H measures the similarity between topic keyword ti and a window wij that moves across each sentence (Pm,Sn) of the text. A window matches when it contains the same words as a topic keyword ti. The length of the window equals the length of the topic keyword. Moving the window from the be- ginning of a sentence to the end, we computed all the H , scores and added them together to get the total score H , for the whole sentence. We acquired the H , scores for all sentences in T and repeated the whole process for the each text in the corpus. After obtaining all the H , scores, we sorted all the sentences according to their paragraph and sentence numbers. For each paragraph and sentence number
position, we computed the average Havg score.
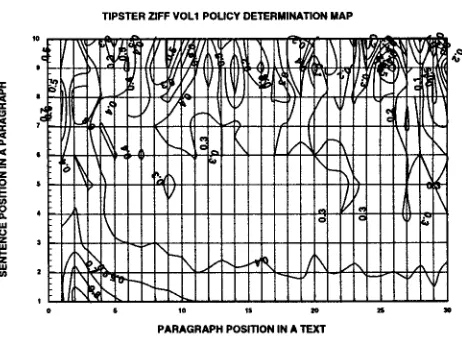
These average yields for each position are plotted in Figure 1, which shows the highest-yield sentence position to be (P2,$1), followed by (P3,$1), followed by (P4,S1), etc.
Finally, we sorted the paragraph and sentence po- sition by decreasing yield Hang scores. For positions with equal scores, different policies are possible: one can prefer sentence positions in different paragraphs on the grounds that they are more likely to contains distinctive topics. One should also prefer sentence
positions with smaller Sin, since paragraphs are gen-
erally short. Thus the Optimal Position Policy for the Ziff-Davis corpus is the list
[(T) ( P 2 , $ 1 ) ( P 3 , S ~ ) ( P 2 , $ 2 ) {(P4,S~) (P5,S~) (P3,$2)} {(P1,S1) (P6,S1) (P7,S1) (P~ ,$3) (P2,S3)} . . . ]
3 . 3 A d d i t i o n a l M e a s u r e s a n d C h e c k s
T h r o u g h o u t the above process, we performed addi- tional measures and checks in order to help us pre- vent spurious or wrong rules. We collected facts a b o u t the training corpus, including the average n u m b e r of paragraphs per text ( P P T ) , the average number of sentences per paragraph (SPP), and the average number of sentences per h u m a n - m a d e sum- m a r y (SPS). P P T and S P P prevent us from forming
a rule such as 251h sentence in the lO0lh paragraph
when P P T is 15 and S P P is 5. SPS suggests how m a n y sentences to extract. For the ZIFF Vol. 1 cor- pus, P P T is 34.43, S P P is 2.05, and SPS is 5.76. Most texts have under 30 paragraphs; 97.2% of para-
Io
.I
4
,f
.I
! o
I
l I I~'-M~IlillY!
llli
T I P S T E R ZIFF VOL1 POLICY D E T E R M I N A T I O N M A P
k l"l-L [ J LI
I"t
TTT¢.J, ITI'III
itlI"H,, ,
IIIII Illl.l 'J IAtl
IIitlt
II1"II1"II TI'-I
LI ITI't-LIJ.4.1- I
L,kl I t,LI
kel% l I I I I I I-l-rl I-f 11- I'/"
P A R A G R A P H P o s n l o N IN A T E X T
Figure 1: Average yield by paragraph and sentence position; lightest shade shows highest yield.
graphs have fewer than 5 sentences. 47.7% of para- graphs have only one sentence (thus the first sen- tence is also the last), and 25.2% only two. With regard to the abstracts, most have 5 sentences and over 99.5% have fewer than 10.
We also counted how many different topic key- words each specific text unit contains, counted once
per keyword. This different hit measure dhit played
an i m p o r t a n t role, since the O P P should be tuned to sentence positions t h a t bear as many different topic keywords as possible, instead of positions with very high appearances of just a few topic keywords. We
can compute dhit for a sentence, several sentences,
or several paragraphs. Sentenceyield is dhit score of
a sentence. Figure 2 shows dhit scores for the first 50
paragraph positions, and Figure 3 dhit scores for the
last 50 positions (counting backward from the end of each text). Since P P T = 3 4 . 4 3 , the first and last 50 positions fully cover the majority of texts. T h e former graph illustrates the immense importance of
the title sentence (dhit = 1.96), and the importance
of the second (dhit = 0.75) and third (dhit = 0.64)
paragraphs relative to the first (dhit = 0.59). Para-
graphs close to the beginning of texts tend to bear more informative content; this is borne out in Fig- ure 3, which clearly indicates that paragraph posi- tions close to the end of texts do not show particu- larly high values, while the peak occurs at position
P-14 with dhit = 0.42. This peak occurs precisely
where most texts have their second or third para- graphs (recall that the average text length is 13 to 16 paragraphs).
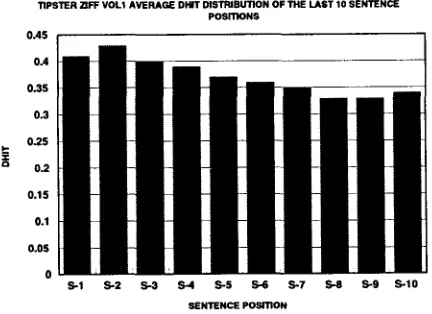
To examine Baxendale's first/last sentence hy-
pothesis, we computed the average dhit scores for
[image:3.612.342.573.92.261.2]tJi uI 1.4 '1.2
t
I l l
TIPSTER ZlFF VOL1 AVERAGE DHIT DISTRIBUTION OF THE TITLE SENTENCE AN{) THE RRST SO PARAGRAPH POSITIONS
eA
o
PARAGRAPH POSITION
Figure 2: Vol. 1 dhit distribution for the title sen-
tence and the first 50 paragraph positions.
TIPSTER ZlFF VOL1 AVERAGE DIgT DISTRIBUTION OF THE FIRST 10 SENTENCE
P o s m o N s
0AS 0.4 0.35 0.3 0.25 0.2 0.15 0.1 0.05 0
S l S2 S3 S4 S5 S6 S7 S8 S9 S l 0 SENTENCEPOSmON
Figure 4: Vol. 1 dhit distribution of the first 10 sen-
tence positions in a paragraph.
TIPSTER ~FF VOL1 AVERAGE DHIT DISTRIBUTION OF THE LAST 10 SENTENCE POSITIONS
0AS 0.4 0.35 0.3
"nPSTER ZIFF VOL1 AVERAGE DHIT DISTRIBUTION OF THE LAST SO PARAGRAPH P o s m o N s
M i
e4= o.4
oJ
¢ t s
o,,1
o.1
e ~
o
p.1 p.3 p4~ p.7 P.e P-ltp*lL3P-1SI~17P.11P~1P-~3P-25p-2"/P*21p-31P.33P~p*37p-30~1~P~P47P4g p.,2 p.4 p41 p.I P-tOP-t2P.14P-11tP.I|I~:mp-22p~24p~.~tlP*21P-30P.32p-34p~NIP~p-40p42~P~
P A R A G R A P H POSITION
O.25 0.2 0.15 0.1
0 . 0 5
0
S-1 ,S-2 S-3 S-4 ,S-5 S-6 S-7 S-8 S-9 SENTENCE POSITION
S-10
Figure 5: Vol. 1 dhit distribution of the last 10 sen-
tence positions in a paragraph.
to the beginning of a paragraph, the higher its dhit
score is. This confirms the first sentence hypothe-
sis. On the other hand, the latter figure does not
support the last sentence hypothesis; it suggests in-
stead that the second sentence from the end of a
paragraph contains the most information. This is explained by the fact that 47.7% of paragraphs in the corpus contain only one sentence and 25.2% of the paragraphs contain two sentences, and the SPP
is 2.05: the second-last sentence is the first!
Figure 3: Vol. 1 dhit distribution for the last 50
p a r a g r a p h positions, counting backward.
4
E v a l u a t i o n
[image:4.612.332.543.92.256.2] [image:4.612.80.314.140.315.2] [image:4.612.331.547.322.479.2]TIPSTER ZlFF VOL2 ZF_2S1 TO ZF_300 POLICy DETERMINAllON MAP
\ I Ii v
I
c; I , - " , n \ /
PARAGRAPH POSITION IN l TEXT
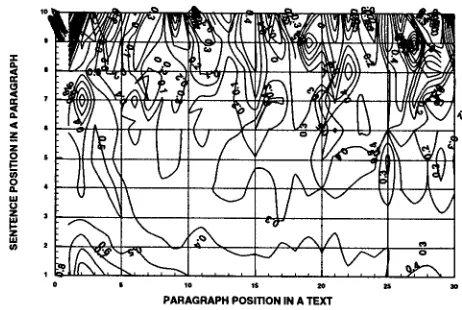
Figure 6: Vol. 2 o p t i m a l position Policy Determina- tion Map in contour view.
1. applying the procedure of creating an O P P to another collection in the s a m e domain should result in a similar O P P , and
2. sentences selected according to the O P P should indeed carry m o r e information t h a n other sen- tences.
T w o evaluations were conducted to confirm these points.
In both cases, we c o m p a r e d the sentences ex- tracted according to the O P P to the sentences con- tained in the h u m a n - g e n e r a t e d abstracts. T h o u g h we could have used topic keywords for b o t h training and evaluation, we decided t h a t the abstracts would provide a m o r e interesting and practical measure for o u t p u t , since the O P P m e t h o d extracts from the text full sentences instead of topic phrases. Accord- ingly, we used as test corpus another, previously un- seen, set of 2,907 texts f r o m Vol. 2 of the Ziff-Davis corpus, which contained texts of the same nature and genre as Vol. 1.
4.1 E v a l u a t i o n I
This evaluation established the validity of the Po- sition Hypothesis, n a m e l y t h a t the O P P so deter- mined does in fact provide a way of identifying high- yield sentences, and is not j u s t a list of average high- yield positions of the corpus we happened to pick. following the s a m e steps as before, we therefore de- rived a new O P P on the test corpus.
T h e result of the average scores of 300 positions
(Pro, Sn) shown in Figure 6, with 1 < m < 30 and 1 < n < 10, was a contour m a p highly similar to Figure 1.
Both peak at position (P2, $1) and decrease grad- ually in the X direction and more rapidly in the Y direction. T h e similarity between the policy de-
t e r m i n a t i o n m a p s of the training and test sets con- firms two things: First, correspondences exist be- tween topics and sentence positions in texts such as the ZIFF-Davis collection. Second, the regularity between topics and sentence positions can be used to identify topic sentences in texts.
4 . 2 E v a l u a t i o n I I
In the evaluation, we measured the word overlap of sentences contained in the a b s t r a c t s with sentence(s) extracted from a text according to the OPP. For each measure, we recorded scores cumulatively, choosing first the m o s t promising sentence according to the OPP, then the two most promising, and so on.
We measured word overlap as follows: first, we re- m o v e d all function (closed-class) words f r o m the ab- stract and from the text under consideration. Then, for the first 500 sentence positions (the top 1, 2, 3 , . . . , taken according to the O P P ) , we counted the n u m b e r of times a window of text in the extracted sentences m a t c h e d (i.e., exactly equalled) a window of text in the abstract. (Again we p e r f o r m e d no mor- phology manipulations or reference resolution, steps which would improve the resulting scores.) We per- formed the counts for window lengths of 1, 2, 3, 4, and 5 words. If a sentence in an a b s t r a c t m a t c h e d m o r e t h a n one sentence extracted by the OP, only the first m a t c h was tallied. For each n u m b e r of sen- tences extracted, and for each window size, we aver- aged the counts over all 2,907 texts.
We define some t e r m s and three measures used to assess the quality of the OPP-selected extracts. For an extract E and a a b s t r a c t A:
E .
wmi. a window i of size m in E. wAi: a window i of size m in A.
IWEI: total n u m b e r of windows of size m in E.
IWmAJ: total n u m b e r of different windows of size m in A, i.e., how m a n y W m i A
A
W r n j .
E i.e., words and word se-
hit : Wmi = Wamj,
quences in Wrn i E and Wmj a are exactly the same.
P r e c i s i o n o f w i n d o w s s i z e m:
# hits
P m - - -
-R e c a l l o f w i n d o w s s i z e m:
different hits
R m =
IWAI
C o v e r a g e o f w i n d o w s s i z e m:
[image:5.612.93.324.107.262.2]TIFRTER ZIFF VOL1 POUCY SELECTION PRECISION/RECALL WINDOWS SIZE 1
i.
I S 4 i ! 7 I I
OPP SELECTED POSITION
Figure 7: Cumulative precision/recall scores of top ten OPP-selected sentence positions of window size 1.
TIPSTER Z]FF VOL1 OPP SELIECTED P o s m o N PRECSION SCORE WITH INI~ICA11ON OF INDIVIDUAL CONTI~RUllON FROM
WINDQW ~ OF 1 TO S
i
ItO @t I~Z p3 p4 I~ I~ P7 FIB p9 OPP SELECTED POSITION
Figure 9: Precision scores show individual contribu- tion from window size 1 to 5.
11P~TER ]~FF VOL1 POUCY SELECTION PRECISION/RECALL WINDOWS SIZE 2
LI•
L t e
LI4 Ikt2
Lt ~S
~S
Z • 4 • • 1 • •
OPP SELECTED POSITION
Figure 8: Cumulative precision/recall scores of top ten OPP-selected sentence positions of window size 2.
4.2.1 P r e c i s i o n a n d R e c a l l
Precision,
Pro,
measures what percentage of win-dows of size m in E can also be found in A (that is, P,~ indicates what percentage of E is considered important with regard to A). Recall, Rm, measures the diversity of E. A high P,,~ does not guarantee recovery of all the possible topics in A, but a high Rm does ensure that many different topics in A are
covered in E. However, a high
Rm
alone does notwarrant good performance either. For example, an OPP that selects all the sentences in the original
text certainly has a very high
Rm,
but this extractduplicates the original text and is the last thing we want as a summary! Duplicate matches (the same word(s) in different windows) were counted in P but not in R.
Figure 7 and Figure 8 show the precision/recall graphs of window sizes 1 and 2 respectively. Fig- ure 7 indicates that the precision score decreases slowly and the recall score increases more rapidly as we choose more sentences according to the OPP. Selecting 7 sentences (is 10% of the average length of a ZIFF text), the precision is 0.38 and the re- call 0.35. Considering that the matching process requires exact match and morphological transfor- mation is not used, this result is very encouraging. However, with window size 2, precision and recall scores drop seriously, and more so with even larger windows. This suggests using variable-length win- dows, sizing according to maximal match. So doing would also avoid counting matches on window size 1 into matches of larger window sizes. The contri- butions of precision, P~, and recall, R ~ , from each m-word window alone, can be approximated by:
P£ ~. P . , - P , , , + I
R~ ~
R , , , - R , . + I
Figure 9 and Figure 10 show precision and recall scores with individual contributions from window sizes 1 to 5. Precision P~ and recall R~ of variable- length windows can be estimated as follows:
l
P o _ - Z P
°
r n = l I
r n = l
[image:6.612.340.571.93.258.2] [image:6.612.90.331.93.250.2] [image:6.612.95.326.328.482.2] [image:6.612.413.488.615.682.2]o4
u s
~2
u s
0 m
TIPSTER ~ F F VOL10PP SELECTED POSITION RECALL SCORE WITH INDICATION OF iNOIVtDUAL CONTRIBUTION FROM
WINOOW SIZE OF 1 TO S
R t R= R3 R4 RS R4 RF R I R9
OFF SELECTED POSITION
Figure 10: Recall scores show individual contribu- tion f r o m window size 1 to 5.
TIPSTER ZIFF VOL1 CUMULATIVE AVERAGE COVERAGE SCORE OF THE TOP 10 OPP-SELECTED POSITIONS
WiTH WINDOW SIZE OF 1 TO S
o.== |
o., °~ ; w i
. ;
i
I
-
=' m - w i •
u
. I I
o, ) _=,T : L
L=, L., ='
,,
;
I,.
•17
F' I. [;
I il:llll
I
= = i
R, ~ .= ~ ms A= .1 ~ ~ M~e OPP SELECTED POSITION
4.2.2
Coverage
Coverage, Cm, tests similarity between E and A in a very loose sense. It counts the n u m b e r of sen- tences in A with at least one hit in E (i.e., there
exists at least one pair of windows
wmiA
andwEmj
such t h a t
wAi = WEj). Cm
estimates the potentialof the O P P procedure. Figure 11 shows the cumula- tive average coverage scores of the top ten sentence positions of the training set following the O P P . Fig- ure 11 indicates t h a t 68% of sentences in A shared with the title sentence at least one word, 25% two words, 10% three words, 4% four words, and 2% five words. T h e a m o u n t of sharing at least one word goes up to 88% if we choose the top 5 positions ac- cording to the O P P and 95% if we choose the top 10 positions?
T h e contribution of coverage score, C ~ , solely f r o m m-word m a t c h between E and A can be com- puted as follows:
C ~ = Cm - Cm-1
T h e result is shown in Figure 12. Notice t h a t the t o p m o s t segment of each column in Figure 12 repre- sents the contribution from matches of at least five
words long, since we only have
Cm
up to m = 5. T h eaverage n u m b e r of sentences per s u m m a r y (SPS) is 5.76. If we choose the top 5 sentence positions ac- cording to the OPP, Figure 12 tells us t h a t these 5-sentences extracts E (the average length of an ab- stract), cover 88% of A in which 42% derives solely f r o m one-word matches, 22% two words, 11% three words, and 6% four words. T h e average n u m b e r of sentences per text in the corpus is a b o u t 70. If we produce an e x t r a c t of a b o u t 10% of the average length of a text, i.e. 7 sentences, the coverage score is 0.91. T h i s result is extremely promising and con- firms the OPP-selected extract bearing i m p o r t a n t contents.
Figure 11: C u m u l a t i v e coverage scores of top ten sentence positions according to the O P P , with win- dow sizes 1 to 5.
TIPSTER ZIFF VOL1 CUMULATIVE AVERAGE COVERAGE OF TOP 10 OPP-SELECTED POSITIONS
OPP SELECTED POSITION
[image:7.612.103.323.94.259.2] [image:7.612.337.562.145.300.2] [image:7.612.335.562.462.627.2]T I P S T E R Z F F V O L 1 0 P P C U M U L A ~ V E DJtrT P E R T O P I C O F T H E O P P S E L E C T E D T O P 18 P O S I T I O N S
• 7 m as7 o4o ~ R am ~ ~ ~ •
am I m
" ; ;
II
--. II ! i
u ~ 4 •
• .- m i m :
~s
, ~
|
a4
u : :
• • n a u
m
O ~ ~ ~ 1 P ~ P4111 I q ~ P 3 ~ P1~$ ~ 1 PT/Sl P ~ I PWS1 P l t t ~ l P I ~ P ~ P1~3 P ~ P2/S4
O P P S E L E C T E D T O P 18 P O S I T I O N S
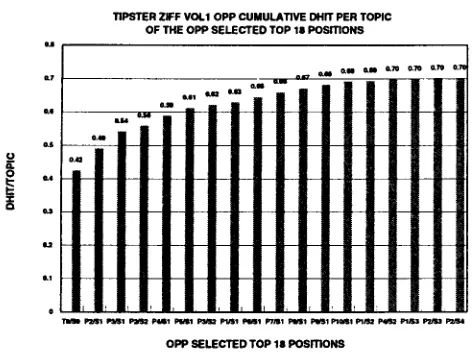
Figure 13: Cumulative dhit per topic for the top 18
O P P selected positions.
5 C o n c l u s i o n
This study provides empirical validation for the Po- sition Hypothesis. It also describes a m e t h o d of de- riving an Optimal Position Policy for a collection of texts within a genre, as long as a small set of topic keywords is defined with each text. T h e Precision and Recall scores indicate the selective power of the Position m e t h o d on individual topics, while the Cov- erage scores indicate a kind of upper bound on topics and related material as contained in sentences from human-produced abstracts.
T h e results displayed in Figure 13 are especially promising. It is clear t h a t only about 30% of topic keywords are not mentioned in the text directly. This is excellent news: it means that as an upper bound, only a b o u t 30% of the humans' abstracts in this domain derive from some inference processes, which means t h a t in a computational implementa- tion only a b o u t the same a m o u n t has to be derived by processes yet to be determined. Second, the ti- tle contains a b o u t 50% of the topic keywords; the title plus the two most rewarding sentences provide about 60%, and the next five or so add another 6%. Thus, a fairly small n u m b e r of sentences provides 2/3 of the keyword topics.
It must be remembered t h a t our evaluations treat the abstract as i d e a l - - t h e y rest on the assumption t h a t the central topic(s) of a text are contained in the abstract made of it. In m a n y cases, this is a good assumption; it provides what one may call the author's perspective of the text. But this assump- tion does not support goal-oriented topic search, in which one wants to know whether a text pertains to some particular prespecified topics. For a goal- oriented perspective, one has to develop a different m e t h o d to derive an O P P ; this remains the topic of
future work.
Ultimately, the Position Method can only take one a certain distance. Because of its limited power of r e s o l u t i o n - - t h e sentence--and its limited m e t h o d of identification--ordinal positions in a t e x t - - i t has to be augmented by additional, more precise tech- niques. But the results gained from what is after all a fairly simple technique are rather astounding nonetheless.
R e f e r e n c e s
P. B. Baxendale. 1958. Machine-made index for
technical literature - - an experiment. IBM Jour-
nal, pages 354-361, October.
Richard Braddock. 1974. T h e frequency and place- ment of topic sentences in expository prose. In Research in The Teaching of English, volume 8, pages 287-302.
Dan Dolan. 1980. Locating main ideas in history
textbooks. In Journal of Reading, pages 135-140.
H. P. Edmundson. 1969. New m e t h o d s in a u t o m a t i c
extracting. Journal of the ACM, 16(2):264-285.
D o n n a H a r m a n . 1994. Data preparation. In R. Mer-
chant, editor, The Proceedings of the TIPSTER
Text Program Phase I, San Mateo, California. Morgan K a u f m a n n Publishing Co.
D.E. Kieras, 1985. Thematic Process in the Com-
prehension of Technical Prose, pages 89-108. Lawrence Elrbaum Association, Hillsdale, New Jersey.
H. P. Luhn. 1958. T h e a u t o m a t i c creation of lit-
erature abstracts. IBM Journal, pages 159-165,
April.
J.J. Paijmans. 1994. Relative weights of words in documents. In L.G.M. N o o r d m a n and W.A.M.
de Vroomen, editors, Conference Proceedings of
STINFON. StinfoN.
Gerard Salton, James Allan, Chris Buckley, and
Amit Singhal. 1994. A u t o m a t i c analysis,
t h e m e generation, and s u m m a r i z a t i o n of machine-
readable texts. Science, 264:1421-1426, June.
Harry Singer and Dan Dolan. 1980. Reading And
Learning from Text. Little Brown, Boston, Mass. Colleen Langdon Sjostrom and Victoria Chou Hare.
1984. Teaching high school students to identify
main ideas in expository text. Journal of Educa-
[image:8.612.88.324.93.270.2]