Munich Personal RePEc Archive
Impact of public-private-partnership
programs on students’ learning outcomes:
Evidence from a Quasi-Experiment
Hafeez, Fatima and Haider, Adnan and Zafar, Naeem uz
Institute of Business Administration, Karachi, Pakistan., Ministry of
Planning, Development and Reforms, Islamabad, Pakistan.
5 December 2015
Online at
https://mpra.ub.uni-muenchen.de/73070/
-1-
Impact of public-private-
partnership programs on students’ learning
outcomes: Evidence from a Quasi-Experiment
Fatima Hafeez*† Adnan Haider† Naeem uz Zafar‡
†
Institute of Business Administration, Karachi, Pakistan. ‡Ministry of Planning, Development and Reforms, Islamabad, Pakistan.
August 15, 2016
ABSTRACT
Learning outcomes refer to the performance of the students in academic tests pertaining to the respective grade level. In Pakistan, survey evidences from Annual Status of Education Report (ASER) show a significant dispersion in learning outcomes of public schools as compared with private sector counterpart. The perceived results of learning outcomes in private schools very clear but less evidence is found for educational outcome of schools run under public-private partnership programs. This becomes especially relevant when status of curricular, co-curricular, and extra-curricular activities is compared between public school, private schools, and schools run under public private partnership. In recent literature, it is found that schools taken up by public-private partnership have been providing a better learning environment - Infrastructure Rehabilitation and Development, Administrative changes, Academic Innovation and Planning, Teacher Reform and Student Affairs - is perceived to have a positive impact on learning outcomes. It is to investigate and document that the investments in these areas are justifiable. To promote this fact, we conduct a quasi-experiment to examine the profiles of students in a public-private partnership school at Karachi (running under Zindagi Trust program) and a public school (as counterfactual) in the same neighbourhood. We also recorded the household and socioeconomic characteristics to create a good set of control variables. The propensity-score results show that public-private school is performing better than that of comparison group in attaining learning outcomes thus showing positive effects of PPP. Finally, the study probed into household and parental covariates of student's educational outcomes to enhance internal validity of results.
Keywords: educational learning outcomes, public-private partnership, quasi-experiment. JEL Classification Numbers: I21, C21, L32.
*
Corresponding Author
Fatima Hafeez <[email protected]> is Graduate Research Fellow and Adnan Haider <[email protected]> is Assistant
Professor of Economics and Finance at Institute of Business Administration, Karachi Pakistan. Naeem uz Zafar <[email protected]> is currently working as Member of Social Sector Development at Ministry of Planning, Development and Reforms (Planning Commission), Islamabad, Pakistan.
-2-
Education is the preparation of children to assume their adult roles in society as loving parents, as engaged citizens, as contributors to society and their communities, and as productive workers. The premise is that schooling and education are linked: a child who spends more years in school is thereby expected to acquire more education—more skills, more capabilities, more competencies. Yet, tragically, it has been demonstrated again and again that this is not always the case. Schoolin’ain’t learnin’
Sir Lant Pritchett (2013)
1. Introduction
In 2012, the National Assembly of Pakistan received assent of the President on an Act to provide free
compulsory education to all children of the age of five to sixteen1. This is indicative of a consensus that
every child has a basic right to education; it may be because of perceived multiple gains to education on all
levels. However, there is no consensus over the right means to provide this basic facility. It becomes more
relevant when the global adult literacy rate is 86.1 percent in 2015 while Pakistan still remains at lower rank
with 59.9 percent on average (UNESCO, 2015)1. Due to substantial efforts by the Federal government have
led to an increase in adult literacy rate from 43.1 percent in 2000 to 59.9 percent in 2015. But still the
average performance in improving literacy rate is much lower as compared with the neighbour countries
and other regional counterpart (see, Figure 1 for a comparison).
Figure 1: Adult literacy rate
Source: UNESCO, Institute for statistics, 2015
There are many socio-economic and political reasons which restrain the adult literacy rate in
Pakistan. Among these, literature has identified five major bottlenecks to piecemeal improvements in
literacy numbers which are income poverty, gender inequality, high population growth, feudalistic system
1United Nations Educational, Scientific and Cultural Organization (UNESCO), Institute for statistics.
47.3
60.8
75.2
48.5
43.1
90.7
76.5
81.9
61.4
71.4
90.6
65.6
59.9
92.5
82.7 86.1
Bangladesh India Iran Nepal Pakistan Sri Lanka Developing World
-3-
and lack of quality education services. In the presence of these constraints, Pakistan is facing two key
challenges – basic access to primary schooling especially in rural areas and the long lasting effects it has on
the educational outcomes of a child. Figure 2 provides information about primary enrollment across
different income quantiles of Pakistan. Bottom income quantile is considered as a poorest group which
shows net enrollment around 31% on average. This also implies, around 69 % of children belong to
extremely poor families are out-of-school in rural Pakistan. In contrast to these numbers, 52% of the
children from the upper income quantile group are enrolled in pre-schooling. However, still 48% of the
children of this richest group are out-of-schools. Furthermore, the enrollment trend across different income
quantiles also indicates a highest percentage of children from poorest families are attending government
schools. Whereas, around 65% of children belong to richest group are mainly enrolled in private schools in
Pakistan. It is due to the fact that public schools in Pakistan especially in rural areas are working in a bad
condition. Annual Status of Education Report (hence after, ASER) 2014 data shows that most public
schools do not have basic facilities of clean drinking water, electricity, boundary wall and toilets, as compare
to private schools. And so is true for the infrastructure as library, playground, labs and the students are
seated outside classrooms with multi grade education.
Figure 2: Primary School enrollment – A Quantile view
Data Source: ASER, 2014.
With the least of resources, books and computer, the public school has more teachers who are
more educated than the private school teachers (see, Figure 3). But it is evident that while having less
educated teachers including more females with less average age experiences, private schools still provide
31%
39%
46%
52% 64%
55%
45%
35% 36%
45%
55%
65%
Poorest Poorer Richer Richest
-4-
relatively better facilities in terms of physical infrastructures and even produce better academic outcomes
than government schools (see, Amjad (2012) and Amjad and MacLeod (2012)). Sindh is not exceptional in
this regard, which is the second most developed province in Pakistan with a population of 42 million and a
literacy rate of 59 percent. There are 47,557 registered schools in the province, yet 73 percent of school-age
children are still out of school. A recent survey report by ASER2 establishes that Sindh scores worst on
education than any other indicator; student’s basic literacy and numeracy results are not more than 20 percent and there is hardly any presence of basic learning environment in public schools. Karachi is a
cosmopolitan city in Sindh with a huge immigrant population. Home to over 23.5 million people, 38
percent of it is under the age of 15 years3. It has the highest school enrolment relative to the 22 districts of
Pakistan according to the Sindh Education Management Information System (SEMIS) census 2013.
Educational sector in Karachi faces a number of problems including the students’ learning outcomes.
Which may be because of an increasing corruption in the respective sector, possible existence of ghost
schools and ghost teachers or the socioeconomic factors may be influencing the educational outcomes.
There are many such hypotheses that what could be the determinants. But nothing is established in case of
Karachi in particular and Singh in general that what factors may be affecting.
Figure 3: Teachers characteristics (Public vs. Private schools)
Data Source: Andrabi et al., (2007 & 2008)
The students from same class, same home or the same community may have different learning
outcomes. Motivating from this fact, this study explores the factors influencing the differences in learning
2 ASER Annual Report, 2014
3Population Census of Pakistan, 1998
76
43
25
38 77
15 52
25
4
19
6
71
Private Public
% Female Average Age % Unmarried
-5-
outcomes while considering a number of control factors. The matter is important to understand as the
educational situation of Sindh may be attributed to the schools and variant education standards among
schools. UNESCO pointed that the existence of different types of schooling is raising concerns of
inequitable social divide (NEP, 2009)4
. Thus one of the options which may be considered to get hold of the
deteriorating educational situation in Sindh is the joint effort by the two key stake holders, Public Private
Partnership (PPP). There are 2,139 schools operating under the PPP mechanism in Sindh. There are
different kinds of Public private partnerships where responsibilities between private and public would vary
from school to school. In some cases, private partners are limited to providing infrastructure while in others
their responsibility would extend to administration and more.
The existence of such an intervention under Zindagi Trust Administration is SMB Fatima School.
The Trust was registered in 2002 and adopted the school under Sindh Government’s Adopt a School Policy
with the prime motive of quality education. Its aim is to utilize the already governments allocated resources
for the betterment of the students. One of the few basic steps was the consolidation of 13 schools operating
in the same building and eradicating the use of school playground for the public use. Throughout these
years the focus remained on training public school teachers, administration and extracurricular activities.
The Chairman of ruling party of Sindh, Bilawal Bhutto Zardari has announced the establishment
of 23 more Public Private Partnership schools; one in every district. The private sector has been given an
elaborate set of responsibilities; which will be supported by the public sector. The setup requires not just a
big amount of public infrastructure but also determines the future of the province’s children. The success of the model has as yet not been established. Thus this paper is an effort to evaluate whether the initiative by
the Government of Sindh to partner with the private sector has beneficial results.
Box-1 shows the details of intervention the current school is providing and are expected to be in
the 23 new schools. There are a number of rigorous done of Public Private Partnership in education sector
and a number of them are underway. But there is no evidence of rigorous evaluation of specifically such a
program found so far. If any research done to find the effect would be of immense importance for the
welfare of the society. This paper is an effort to contribute to the pool of data base about public private
partnership in education. The prime role of the paper would be finding the differences among the Public
Schools and the Private schools and the evaluation of such a school underway since a decade. The detailed
set of responsibilities private sector providing in a public private partnership are be Infrastructure
Rehabilitation and Development, Administrative changes, Academic Innovation and Planning, Teacher
Reform and Student Affairs.The detail set of interventions made by the Trust are given in Box-1. Finding
-6-
the effect of each in isolation won’t be fruitful thus the effect of all the factors are observed simultaneously. For the purpose of this study we will compare the educational outcomes of the public schools and private
schools students all over Pakistan, among four major provinces and then four major cities. Key hypothesis
under consideration at this stage would be, do private schools produce better academic outcomes than
public schools? Once the difference is established we will look for how the public schools differ from the
public private partnership school. Thus in the second stage, we would like to test a similar hypothesis but
with different treatment group such as, do public-private partnership schools produce better academic
outcomes than public schools? The causation would be assessed while controlling a number of control
variables under consideration.
Box 1: Detail of Intervention made by Private sector
1) Infrastructure Rehabilitation and Development
Repair and re-installation of broken electric wiring
Replacement of dysfunctional blackboards or desks
Conversion of abandoned rooms to student activity rooms (e.g. art room)
Rebuilding cramped, blocked toilets
Repairing water/sewage lines
Building a Health Room, staffed with a full-time nurse
Building an Art Room, a Library, an A/V Room, two Computer Labs and a Science Lab 2) Administrative changes
Merging the multiple schools running in one campus into one school under one administration
Maintaining teacher and student records for attendance, performance, etc.
Disallowing private use of school grounds
Hiring custodial staff for maintenance and cleanliness of the existing or refurbished premises Detailing staff responsibilities in job descriptions
Formulating a detailed admissions policy describing admissions criteria, responsibilities and deadlines 3) Academic Innovation and Planning
Introduction of modern, thought-provoking textbooks in Urdu, English, Mathematics.
Teaching a video-based science curriculum in our well-equipped A/V Room
Hiring academic coordinators for English, Mathematics and Science to plan syllabi with learning outcomes and timelines, design tests, monitor progress, observe and train teachers
4) Teacher Reform
Monitoring teacher attendance
Penalizing staff for unreported absences, lateness and shirking duty
Regularizing general and subject-specific training for teachers, ongoing through academic coordinators and targeted through external trainers
Evaluating teacher performance through regular teaching demos, lesson plan reviews as well as in-class monitoring by academic coordinators throughout the term.
5) Student Affairs
Art
Chess
Sports (netball, basketball, football, hockey, throw ball, taekwondo, rowing, cricket)
Public speaking
-7-
The rest of the paper organizes itself as section 2 reports the existing work done in the field of
finding differences among the public, private and public private partnership schools and section 3 shows its
empirical methodology involved in finding the results. Section 4 shows the final results and section 5
concludes the paper.
2. Review of Literature
The demand for education in the developing countries is far more pressing than that in the developed
countries. The excess demand leads to a rise in private sector education to cater to the demands of the ones
who have the means to pursue it. This leads to a gap between public schools and the private schools; the
former lagging behind and the latter performing better. Broadly defined the education is parted in the
developing country in the four major ways - Public Schools, Public Private Partnership Schools, Low Cost
Private Schools and Private Schools. The perceived and major differences among them are shown in
Table-1.
Table 1: Major Differences among School Types
Public school PPP school Low cost private schools
Private schools
Infrastructure Good space but not maintained
Good and maintained space
Not much and maintained space
Moderate maintained space
Administration Poor Good Moderate Good
Academic innovation
No Innovation Good Poor Good
Teachers pay Very good Good Poor Good
Teacher absenteeism
High Low Low Low
Extracurricular activities
No Yes No Yes
The educational market in the developed country varies to that of the developing countries. The
inception of the Private schools in the Developed Countries is welcomed, as it is perceived to bring in
competition to the Educational Sector (Andersen, 2008). On the other hand it is taken as a threat in the
-8-
is taken up by the Private Sector. ASER India annual report 2009 on rural area clearly shows the difference
in educational outcomes among the two sector schools (Wadhwa, 2009). Similarly when the government
school students in Colombia were provided school fee vouchers by the government, they can opt for either
school, the students were 15 percent more likely to be in private schools. Other than this they were in a
higher grade than the government school counterfactuals, had better score in standardized tests and were
less likely to dropout from school or cohabit (Angrist, Bettinger, Bloom, King and Kremer, 2002).
To cater to this unending demand of quality education, in the wake of perceived better future
returns at all levels, has given rise to low cost private schools and private schools. Private sector schools are
widely prevalent not only among the urban elite but the rural areas as well. The educational outcomes are
found to be better in areas with better educated females, takes role as teachers. Despite they are
co-educational girl’s enrolment is high in rural Pakistan (Andrabi, Das and Khawja, 2002).
The group which can afford low cost private schools is comparatively smaller with positive but
statistically insignificant impact on child learning in India (Chudgar and Quin, 2012). And it is noted that
a simple intervention in the public school is expected to raise results twice as of the low cost private schools
(Tooley and Dixon 2005). The test scores of Math, Urdu and General Knowledge are compared among the
Public, Private and NGO schools, in Pakistan, there is no significant difference found between the public
and NGO school. Though there is a significant difference between the public school and private school.
The major difference is explained by the variation in the household factors and the teacher related factors
(Arif and Saqib, 2003).
Within the public school educational outcomes variation is found to be linked with better student
teacher ratio and teachers education (Andrabi, Khan, Khan and Naseer, 2012). Private school teachers are
less paid and less trained but are expected to be involved in teaching or teaching related activities with a low
absenteeism rate and better students learning outcomes (Muralidharan and Kremer, 2006). It is also
established in context of Pakistan (Andrabi, Das and Khawja, 2002).
Thus the private schools are inclined to hire a better set of teachers and a slightly better set of
facilities to attract a good bunch of students. And it is successful in showing results better than those of the
public school (Amjad and MacLeod, 2012). The public school benchmark is so low that the private school
is not inclined to do anything more than a few things showing better result. Therefore a slight intervention
in the public school of such a nature will improve grades and the underutilized public school resources can
be utilized. To provide quality education free of cost the two key stake holders from the demand side,
private sector, and the supply side, public sector, are combined together. In the private sector remained
social workers and non-governmental organizations. Public sector’s role is to providing grants, subsidies or
-9-
public building, taking decisions about infrastructure rehabilitation and development, administrative
changes, academic innovation and planning, teacher reform and student affairs (SMB Fatima Jinnah
School).
The schools run under the private sector, NGO’s, are reported to be performing better than the regular public schools at a lesser cost in Pakistan. According to ASER 2011 data PPP schools on average are
performing better than the Public as well as Private schools for Reading, Math and English. Though the
difference in scores is not mainly associated to the school type; it is found that PPP school students are 5
times more likely to be attending private tuitions than the public school students (Amjad and MacLeod,
2012).
World Bank made an effort to summarize the assumed effect of the most common types of PPP;
vouchers, subsidies, contracting of private management and private finance initiatives. The objective was to
show its impact on four key school indicators – increasing enrolment, improving education outcomes,
reducing inequality and reducing costs. The effects are shown in the Table 2. The benefits of public private
partnership are perceived to be creation of competition in education sector which would lead to efficient
use of resources and increased consumer welfare (Pessoa, 2008). It may also increase risk sharing between
the stakes holders, public as well as the private players will show ownership to the problem faced. There are
a number of such projects underway in Pakistan with a set of perceived outcomes.
Learning environment if paired in parting education may increase educational outcomes. The
environment may sum up to text books, work books, teacher’s books and resources, and the material used in the better learning of the concept. It is true in context of Slovenian (Irena, Samo and Branka, 2014).
PPP may be private sector’s intervention of motivating students to participate actively in class at public
school through provision of proper learning environment in which the child feels confident enough. Such
an intervention when taken up in a public school in Pakistan showed significant change in the student’s
educational outcomes (Naseer, Patnam and Raza, 2010). The environment may also be the infrastructure
and motivated teachers. It is established in Indonesia that more school construction will lead to increase in
average years of education and average wages (Duflo, 2001). Similarly if teachers are provided with better
environment may reduce absenteeism (Chaudhury, et al., 2006). The students scores increases if their
teachers are provided with incentives (Muralidharan, K., and Sundararaman, 2013).
Another aspect of certain PPPs is imparting extracurricular activities. While effect of extracurricular
activities on welfare of student has been established, its impact on educational outcomes is still debatable.
In turnkey schools, with provisions of extracurricular activities which are not related to the curricular shows
-10-
Table 2: PPP’s Impact on key indicators
Contract Effect on increasing enrolment Effect on increasing educational outcome
Effect on reducing education
inequality
Effect on reducing cost
Vouchers Strong: number of students who receive voucher. Strong: school choice Strong: when targeted Strong: when private sector is more efficient Subsidies Strong: use of
already built private infrastructure
Moderate: limited by available places and quality of service delivered in private sector Strong: when targeted Moderate Private management and operations Moderate: limited by the supply of private school operators
Moderate: limited by available places in private sector
Strong: when targeted Moderate Private finance initiatives Moderate: limited by financial constraints
Low Strong when targeted
Strong
Source: Patrinos et al. (2009).
We will be interested in looking into a more detailed form of PPP in context of Karachi and its
applicability in Sindh with the effect on increase in educational outcome. The PPP would be inclusive of
Private management and operation and private finance initiatives. The programs of PPP nature underway
in Pakistan and their desired objectives are given in Table 3.
IDEAS-PAK (2015)5 report lead by Dr. Faisal Bari shows that the PPP schools are provided with
better infrastructure, teacher training and support to the head teacher than the counterfactual, public
school. The outcome is better increased enrolment and scores; though test scores are high in context of
Punjab though ambiguous for Sindh. The results are getting more favourable for PPP school as the span of
time increases. One’s decision whether or not to teach their child is influenced by a number of factors. It
may be their informed decision for the wellbeing of the family in long run or the peer pressure they face.
On the other hand, the family had no other option than to send the child to school or the conditions are
so bad, the family has nothing to eat, it is perceived that sending the child to school will not yield any
benefits. These are the demand side factors that influence the demand of school. Once the child steps into
school these demand side factors plays a pivotal role in determining what the child scores in an academic
exam. These factors may be personal, household and on the community level.
5
-11-
A family’s socio economic status (SES) has a significant impact on a child’s academic achievements. Children from higher SES are reported to have higher learning outcomes at primary level in USA (DaGLi
and Jones, 2012). The results are consistent in Pakistan as well at the matriculation exam level (Akhtar,
2011), while the findings are contrary in case of Turkey, study conducted at under graduate level. It is
reported that the students from low SES are reported to academically perform better than the students from
high SES (CILasun, 2013).
Table 3: Educational services
Province Program Objectives
Educational services
Baluchistan Urban girl fellowship Increase girls enrolment in schools
Baluchistan Basic education support project
Punjab Financial assistance per child basis Improve quality and increase productivity
Punjab Pilot education voucher scheme Improve quality of education and encourage girls
enrolment in schools Supplement and support service
Quality enhancement and institutional development in private schools
Improve quality
Punjab Computer based training of teachers
Improve quality
Sindh Quality assurance resource centre Improve quality and the academic achievement of low performing students
Operations management services
Adopt a school Improve quality of education Pakistan railway schools Improve school management Management of government
schools in Lahore city and Sargodha
Improve management of schools and quality of education
Punjab Quality education for all Improve quality of education in primary schools, reduce number of dropouts and increase enrolment Infrastructure services/education services
Leasing public school building for private operations
Leasing public school building to private operators
-12-
The age at which a student joins the school also determines educational outcomes. The students
from higher SES if sent late to school are expected to perform better than those taken at the right age. It is
contrary for the students from lower SES and other than white racial class, established in USA (DaGLi and
Jones, 2012). The family income is a significant factor in determining the learning outcomes of the
students. A study in USA signifies that $1,000 increase in income raises combined math and reading test
scores by 6 percent. And the gains are larger for the disadvantaged families than for those already having a
higher income (Dahl and Lochner, 2012).
Parents leaves an important impact on the child’s learning outcome (Jesson, McNaughton, and Kolose, 2014). The way parents help the child to read assisting and giving time to the child have a
considerable influence on the child’s performance in New Zealand. The household resources, parents educational level, parents ability to support the child and the level of support child is getting is found to be
highly correlated with the learning outcomes in Australia (Geelan, Louden, and Wildy, 2013). It is also
found that the bigger family size signifies a smaller share of resources for each one of the family member.
Thus it is negatively correlated with the child’s academic outcomes. Similarly single parent signifies a smaller endowment of resources to start with thus it also have a negative impact on the learning (Marks,
2006).
It may also be supported by a study in Uruguay that girls with both parents are reported to be
performing better than those with single parents (Cid, 2008). The birth order is also reported to be a
significant indicator of child educational outcomes in Pakistan. A study conducted in KPK reports that the
expenditure on eldest child is more than that of the next child thus the educational outcomes are better of
the first child than that of the second child (Atta, Jamil, Baloch, and Ayaz, 2011).
3. Experimental Methodology
Extracurricular activities and a number of other activities, along with education plays very important role in
child education and development. NGO took over public school with a view to consolidate and do an
intervention of giving extracurricular and co-curriculum activities to students. These activities are part of
education system in many private schools but do not exist in public schools. This means that initiative
taken by the NGO may be taken as an intervention done for the first time in public sector education. We
planned to probe into impact of this initiative in students’ academic performance. To estimate the impact
of this intervention, we have to form a comparison group (counterfactual). We chose another school from
public sector with similar characteristics for control group. The only difference is, in the control group, PPP
intervention is absent. It is possible that choice of PPP school and hence all students interviewed from PPP
-13-
technique. This approach compared observations from treatment group with equivalent observations from
control group thus enabling us to create a treated individual as a controlled individual counterfactually.
Once counterfactual groups are created, then descriptive statistics were used in estimating the impact of this
intervention on academic outcome of students.
A number of recent empirical studies proposed Propensity Score Matching (PSM) as a way of
testing when pure randomization is difficult to implement or in a case where intervention has already been
done. This method has also been used by Krueger and Zhu (2004) in its study of New York City school
choice program, by Barrera- Osorio (2007) in Colombia effects of school construction, by Barrera- Osorio
and Patrinos (2009) in evaluation of school voucher program in Chile and more recently by Naseer, Patnam
and Raza, (2010) for CRI intervention assessment in the case of Pakistan. The method is illustrated as:
Consider our aim is to estimate the “treatment effect” of an intervention in a quasi-experimental
setup, where a binary treatment variable D is defined by:
If intervention affects an outcome variable Y than we can write treatment effect for some unit i as:
If we consider the whole sample rather an individual effect, then in expectation terms, the
treatment effect can be written as:
This expression is also called, average treatment effect (ATE). Using binary treatment variable, we
can further classify ATE into its two forms:
ATET:
ATENT:
-14-
In a case, where program intervention has already taken place, the method must settle for estimates
of the average impact of the program on the participants treatment group with D=1, compared with a
credible counterfactual. It is important to note that ATE expression given above between program
participants and the comparison group fails to give us an unbiased estimate for as shown in the
equation below:
Add and subtract, , we get:
The above expression shows that in the absence of pure randomization, some sort of selection bias
may be occurred in estimating ATE. In order to control this bias, on possibility could be the use of PSM
algorithms. This method requires an assumption of conditional independence of treatment for recovering
an unbiased estimator of mean impact. In addition to this assumption, the method also requires that the
propensity score function P(D|X) is strictly between zero and one. Rosenbaum (2002) and Rosenbaum and
Rubin (1983) show that if conditioning on Xi eliminates selection bias then it must be the case that
conditioning on P(D|Xi) also eliminates selection bias. It is important to note that any standard probability
model can be used to estimate the propensity score, e.g. a logit model:
Where h(Xi) is a function of covariates with linear and higher order terms. Using this expression,
ATET can be modified as:
With the help of above estimator, we matched on the factor which has led to the school choice.
After looking into the theory and the logic proposes that in families of lower social class the decision to
shift from public to public private partnership school could only be on how informed the parents are. As it
-15-
be providing better education. Thus along with key co-variates, we also use father education and the mother
education for matching the students potential outcomes. The outcome remained Math result, English
result, sum of mean-score result.
Survey and questionnaire design
With the purpose of evaluating the effect of an intervention in public school we surveyed the household,
community and academic profiles of students. To examine the change in outcomes we formed a
comparison group comprising a public school in the same neighbourhood, and conducted a similar survey
there. The survey consisted of collecting house hold data consisting of a number of dimensions (See, Box-2)
and conducting a test in both the schools.
Box 2: Dimensions of Household Survey
The dimensions of the house hold data consisted of the following Student information
Household information Parental information Parents education
Family income and employment information Possessions
Health status Hygienic conditions Mobility
Time spend at home Food intake
Eating habits Types of houses Religious beliefs Community data Parents desire
Household members from the students’ family were interviewed one-to-one to elicit their response on different dimensions. Schools were visited on a random unannounced day to avoid self-selection bias.
The sample size is 93 of which 52 belong to the treatment group and 41 to control group. This sample has
99 percent probability that the sample achieved statistical significance for a given sample size and a given
difference in mean. Through convenience sampling we confined our sample to students of Class 5 and 8.
The students not present there were less than 1 percent of the total population. We collected the house
-16-
for the mathematics test. Thus we were left with the sample size of 52 only. In the control group we started
with the sample size of 100, tests were conducted, but house hold data could only be collected for 41
students.
4. Results and Discussion
This section aims to address briefly our empirical findings. In the first subsection, we will analyse the
educational outcomes of the public schools and private schools students all over Pakistan. For testing our
key hypothesis under consideration at this stage would be, do private schools produce better academic
outcomes than public schools? To test this hypothesis, ASER dataset 2014 is being utilized. Once the
difference is established we will look for how the public schools differ from the public-private partnership
school. Thus in the second stage, we would like to test a similar hypothesis but with different treatment
group such as, do public-private partnership schools produce better academic outcomes than public schools?
The causation would be assessed while controlling a number of control variables under consideration.
Hypothesis testing – I: Comparison of Public vs. Private Schools
In ASER 2014 dataset, students were asked basic questions to assess the reading skills, learning skills, math
level, English reading, concluding word and sentence meaning, telling time, solving word problem and
naming things in English. The same question was asked from all the students irrespective of their grade and
they were awarded points between 1 to 5, 1 being very poor and 5 being very good. Using this dataset, we
first discussed results for the whole nation then for four major provinces and five major cities. In Pakistan
on average the private school might not have reached the threshold in educational scores but still it is better
than the average public school score; aggregately for all grades and subjects. On average the difference in
score among schools is no less than 1 point (See, Figure A1 and Figure A2).
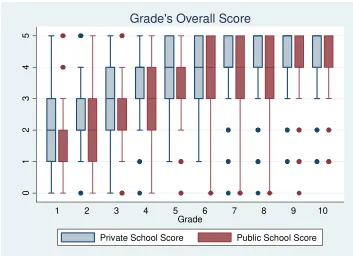
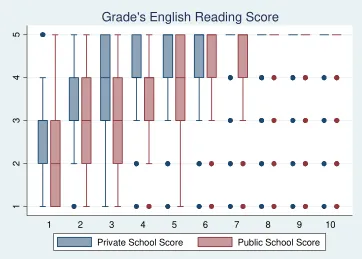
The absolute scores vary among schools; the 25th to 75th percentile range of private school is greater
in scores than that of public schools for all grades except grade 9 and 10 (See, Figure A25). The possible
reason the private school score is also very low may be that they include low cost private schools and other
private schools. May be the score of public schools are high because it include the data of Public Private
Partnership Schools. Thus on all the further result discussion there is a possibility that the differences are
under estimated.
For the purpose of this study we kept our focus to reading scores, math score and English reading
-17-
scales and all the grades among the schools. Private schools even after possible understatement of results are
performing better than possibly overstated public schools. The scores from the very beginning years are not
very hope full as the public school is performing way less than the private school. Reading Score on average
shows that not all Students in both the schools are able to read sentences. The private school is closer to 4
showing possibility that most of them can at least read sentences (score 4) while the public school on
average is half way between forming words (score 3) and sentences (score 4) (See, Figure A3).
Figure A4 shows that on average not all the students of both the school can write a Story (score 5).
The average difference between the Schools remained the public school lagging behind the private schools
for all grade levels, though the difference tends to decrease as the class increases. When observing the
absolute 25th to 75th percentile, Figure A26, there are no differences in scores among grade 3rd, 6th, 8th, 9th
and 10; exception of some outliers. The difference is most for grade 2nd and grade 7th. The non-existence of
variation at higher grade level may be explained by the fact that reading a story (score 5) is a basic task and
can be mastered by a grade 4th student.
Math score again portrays the same gloomy picture. On average not all the students know the
division of numbers, though the average for private school is closer to knowing subtraction (score 4) while
public schools are closer to recognizing numbers from 1 to 99 (Score 3) (see, Figure A5). In private school
on average 2nd grade student can recognize number from 1 to 99 (score 3) as compared to public school 3rd
grade students can do that. Similarly 4th grader on average in private school can subtract (Score 4) while a
5th grader in public school (see, Figure A6).
In absolute terms Figure A27 show that 7th grade and onwards the private school students has
mastered the division (score 5), exception of outliers. Public school 7th and 8th grade scores are lagging
behind, showing their in ability to divide. 1st grade students in public schools still ranges at not knowing
anything while in private school the students can at least recognize numbers from 1 to 9 (Score 3). There is
no improvement shown in private school score between grade 2 to 3 while a drastic change for public
school and no improvement in public school score while transition through grade 3 to 4 and grade 7 to 8.
The private school students on average can at least read words (score 4) while the public school students are
have mastered recognizing the small letters (score 3) (see, Figure A7). Probing into the differences on grade
level (see, Figure A8) the difference is huge on average. Most of the 1st grade students know the small letters
(score 3) while the 2nd grade of public school is compete able to it. The difference in scores among schools
tends to decrease as the class increases.
The 75th percentile of 3rd grade private school is the ability to read sentences while it is true for 5th
grade public school (Figure A28). The difference in score among school remains until grade 6; the grade 7
-18-
The difference is highly evident between grades 2 to 5. Score’s difference among schools tends to
decrease as the grade gets higher which may be justified by the basic nature of the questions. The private
school on average scores between 2.5 to 4.8, whereas, the public school on average varies from 1.5 to 4.7.
There is no major variance among subjects.
Province’s when compared on the educational outcomes shows that Punjab is followed by Khyber Pakhtunkhuwa than Balochistan and Sindh in the end for public school. For Private schools Khyber
Pakhtunkhuwa is replaced by Balochistan. The average scores for both the schools remained between 2 to
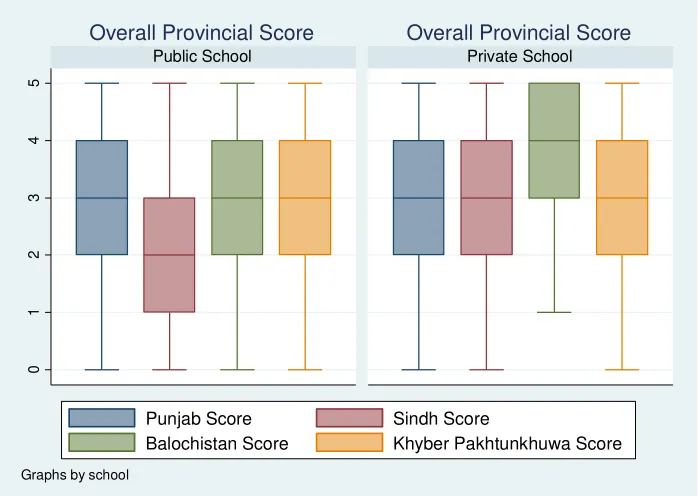
3.5 out of 5 (Figure A9). In absolute terms the Box graph (Figure A29) shows similar results for Punjab and
Khyber Pakhtunkhuwa. Sindh is lagging behind the other 3 provinces in public sector though the score is
similar to Punjab and Khyber Pakhtunkhuwa in private sector. Surprisingly Balochistan Private schools are
performing way better than the other provinces.
The overall score shows a gloomy picture and the argument can be made valid that the benchmark,
public schools, is so low that the counterfactual, private schools, does not have the incentive to perform any
better. The provincial results are consistent to the prior conclusion that the private schools are performing
better than the public schools at all levels and the differences are decreasing as the grade level increases.
Among the provinces Sindh shows the greatest difference then Baluchistan is next followed by Khyber
Pakhtunkhuwa and Punjab shows the least difference among schools (Figure A10). The box graph (Figure
A30) shows that Punjab’s scores is more or less identical, Khyber Pakhtunkhuwa shows slight variation,
Balochistan shows differences in scores and Sindh shows difference on all levels of at least a score.
On average none of the schools in the provinces could read the sentences (score 3); public school
have on average mastered reading the words while private schools are closer to reading sentences. The
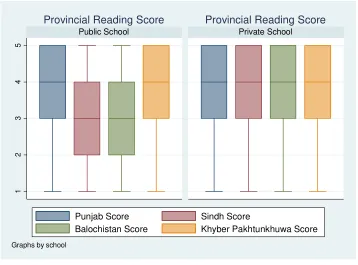
reading scores among provinces in different sectors remained as those of the overall scores (Figure A11).
The box graph (Figure A31) shows that public sector Sindh and Balochistan scores are lagging behind the
Punjab and Khyber Pkhtunkhuwa scores though all are performing similar in the private sector.
The differences in reading scores over grades are consistent to the conclusion for overall scores, the
difference in Punjab being least to being highest in Sindh. The difference also decreases as the grade level
increases (Figure A12). Punjab’s public school and Private schools are performing better than those of other
provinces at each grade level (Figure A32). For private schools Punjab is followed by Sindh then Balochistan
and Khyber Pkhtunkhuwa. Sindh is worst for the Public School followed by Balochistan and then Khyber
Pkhtunkhuwa.
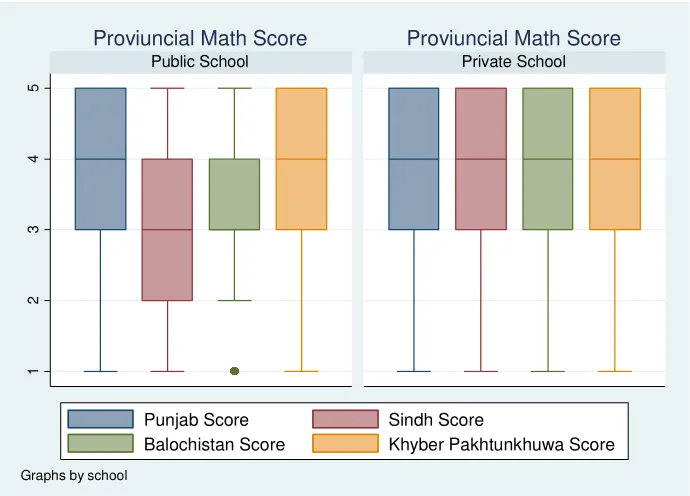
The provinces performance on average for math is more or less similar to that of the overall score
and the reading score. All the provinces in public sector have mastered recognizing the numbers from 1 to
-19-
(Figure A13). In Figure A31, Sindh public school is performing the worst followed by Balochistan. For
Private schools all are performing the same. When looking at the average math score on grade level grade 1
in Sindh private school is comparable to grade 3 of public school, in Balochistan grade 1 of private school is
comparable to grade 2 of the public school.
In Khyber Pkhtunkhuwa grade 2 is comparable to grade 3 and in Punjab public school is clearly
performing better than the private schools previous grade (Figure A14). Box Graph (Figure A34) shows
Sindh and Khyber Pkhtunkhuwa Math scores are clearly better in the private sector than in the other
provinces. Punjab’s public schools are clearly performing the best in math scores. English Reading scores shows that among both the schools on average the provinces have not mastered reading words in English.
Public schools are further lagging behind, Sindh is the only province which have not yet mastered
recognizing small letters (Figure A15). Figure A35 shows that the Sindh public school being the worst
followed by Balochistan while they boxes are all same for private schools.
The variation in score among schools is such that in Sindh public school grade 1 score is
comparable to grade 4 score, in Balochistan grade 1 is comparable to grade 3, Khyber Pkhtunkhuwa grade 1
is comparable to grade 2 and this comparison doesn’t fall for Punjab (Figure A16). Sindh private school English reading score is performing the best followed simultaneously by Punjab and Balochistan. And the
public school in Punjab are the best without any question (Figure A36).
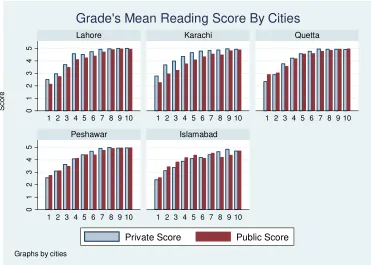
To further narrow down the scope of the study, it is important to find out the differences in the
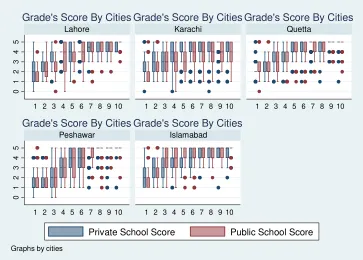
capital cities of the provinces. It will also show the results specific to the urban area only. The cities overall
result in public sector shows Quetta and Islamabad are performing equally and best followed by Lahore
than Peshawar and at last Karachi. In private sector Quetta is followed by Sindh and Lahore then Islamabad
and in the end Peshawar (Figure A17). In absolute percentiles all the cities are performing equally and
better in the public sector other than Karachi. While in the private sector Lahore and Quetta are lagging
behind remaining others are performing equally (Figure A37).
Islamabad’s public schools are performing better or equal to the private schools. Lahore, Quetta and Peshawar’s scores are varying, public school scores are better in some instances while private in others .In Karachi the private school scores are comparable to 2 grade higher public school score (Figure A18).
Peshawar’s public and private schools both are performing better than the other cities followed by Quetta. Islamabad and Lahore shows similar trend for both schools exception for private lagging behind in some
cases of Islamabad and public aging behind in some cases of Lahore. In Karachi public school score is
lagging behind the most (Figure A38).
The public school on average shows that reading sentences (score 4) is mastered by all the cities
-20-
performing equally in both the types of schools except for Quetta in public school which is performing
better than others (Figure A39).
When seen in terms of grades in Karachi private school score on average can be compared with two
grade higher public school score. Lahore’s private schools on average are performing slightly higher than the
public schools. Quetta and Peshawar public school is performing better than private school for first 2 grades
than the private school scores is greater or equivalent to the public school scores. In case of Islamabad
public schools are performing better than the private schools except for grade 8 and 9 (Figure A20).
Karachi’s private schools are performing the best as their students at grade 2 level read a story.
Followed by Lahore and Quetta then Peshawar and Islamabad is in the end. Lahore, Quetta and
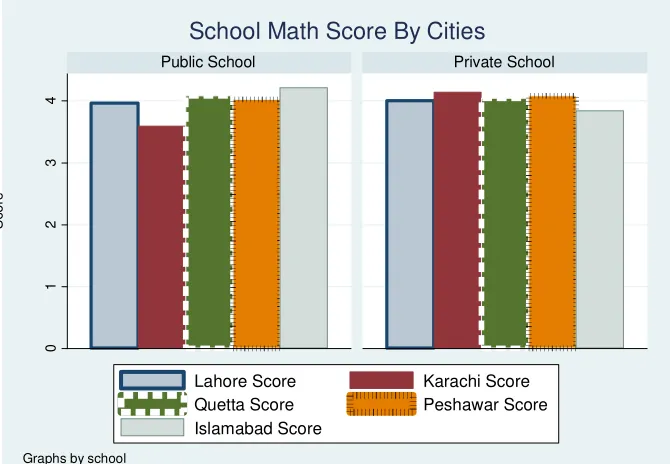
Peshawar’s public school result is the best followed by Karachi and then Islamabad (Figure A40). The cities on average have mastered subtraction (score 4) in both the schools except for Karachi’s public school and
Islamabad’s private schools (Figure A21). The box diagram (Figure A41) shows that all the cities are falling in the same range of scores except for Islamabad’s public school.
Karachi shows the greatest difference between the public schools and private schools followed by
Lahore. For grade 1 Quetta and Peshawar’s public school scores are greater than private school scores and for the remaining grades Private schools are greater. In case of Islamabad public school scores are greater or
equal to private school scores (Figure A20). Karachi’s private schools are performing way better as the 3rd
grader can do division (score 5) followed by Lahore.
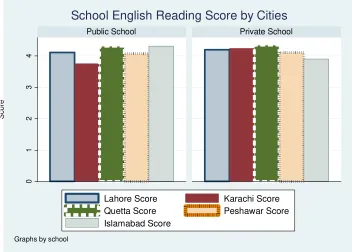
Quetta and Peshawar’s public schools are performing the best (Figure A42). English reading scores shows that on average public and private schools in all the cities has mastered reading words (score 4)
except for Sindh’s public school and Islamabad’s private schools (Figure A23). Public schools of Quetta and Islamabad are performing better while private school of Lahore, Karachi and Quetta are better for English
reading Score as compared to other cities (Figure A43).
Public and private school difference is huge in context of Karachi followed by Lahore. Quetta and
Peshawar showed similar result grade 1 result public school is performing better than the private school and
for the remaining private school is performing better or equivalent to public schools. For Islamabad the
public school is performing better or equivalent to private schools (Figure A24). Quetta is clearly
-21-
Hypothesis I: Impact Assessment
Propensity score matching algorithm together with logistic regression specification is used to pair the
students, on the basis of their household factors, among schools. Then the differences among the scores of
those students were recorded. The change in educational outcomes is then attributed to the school type or
the treatment provided. Math, English and their Average was treated as the outcome variable to measure
the change attributable to the treatment provided. The variables used in matching are Mother’s Education,
Father’s Education and House type (See, Descriptive Statistics available in, Table A01). The matching variables are limited in this analysis because of the limited variable’s data is available in ASER data set. The analysis remained consistent to the prior hypothesis that the provision of better school resources,
environment, teachers and infrastructure would lead to better educational outcomes. The educational
outcomes in partnership schools at all level are expected to be greater than the Public schools by at least
difference of two grades. The differences are also found to be significant at 5 percent level of significance
(see, Table 4).
Table 4: ASER – Average Treatment Effect on the
Treated: Propensity Score Matching
Unmatched ATT
Reading 0.35* 0.28*
(46.70) (3.85)
Math 0.36* 0.25*
(50.00) (3.65)
English 0.50* 0.24*
(66.14) (3.34)
Average Result 0.39* 0.30*
(51.13) (3.85) Treated Non Treated
Observations 41,494 101,354
Notes: Absolute values of bootstrapped t-statistics in parentheses. The first column reports un matched marks on the test and the second column is the effect on a weighted aggregate computed by using a 3-parameter item response model.
** indicates significance at 1% level; * indicates significance at 5% level; + indicates significance at 10% level
Figure 4 and Figure 5 are showing the bias across the covariates and the propensity score matching
-22-
all the blocks with statistically insignificant difference in means between all the observed covariates in three
strata of propensity scores. The Rosenbaum bounds test also confirms the same result.6
Figure 4: Histogram of Propensity Score Distribution for Treated and Control Groups ASER Case
Figure 5: ASER – PS Bias across Covariates
6
For assessing robustness of PSM estimation results in STATA, we have also used two alternative matching algorithms, like, Kernel matching and Radius Matching algorithms. Despite the fact, using these alternative schemes, there is no change in the significance of reported results.
0 .2 .4 .6 .8
Propensity Score
Untreated Treated
0 20 40 60 80
Standardized % bias across covariates Class
Father Education Mother Education House Type
-23-
Hypothesis testing – II: Comparison of Public-Private-Partnership vs. Public Schools (Zindagi Trust Intervention)
The differences in educational outcomes could easily be concluded through observation while the test was
conducted in each school. The treated school students showed immense confidence and were confident
enough to deal with the tests themselves. In the public school students kept asking for different questions,
showed a blank response and required translating help even in the English test. In PPP schools the teacher
also showed confidence in their students learning to deal with the test and left the Class room while the test
was conducted by independent invigilators. This was not the case in the public school, teachers never left
the class room nor did they restraint their selves from assisting the students. This was certainly the case
showed in the public school English results of class 8. We somehow were able to control it in other classes
and subject tests. Table 5 shows the differences in the differences in the mean of PPP school results and the
public school results. Similar observation can be seen in Figure A45.
Table 5: Zindagi Trust - Mean Differencing Results
Class 5 Class 8
Math result 1.196*
(0.292)
2.593* (0.44)
English result 2.582*
(0.5777)
0.677 (0.659) Sum of Math and English result 3.771*
(0.831)
3.447* (0.927) Average of math and English result 1.885*
(0.415)
1.723* (0.463) Standard errors in parentheses
* p<0.05
Figure A51 shows the absolute differences among the School overall outcome. The Box plots show
the 25th to 75th percentile range of school scores and the line on the box shows the median value. The blue
line on the graph, above, shows the mean score of partnership school while the red line, below, shows the
mean score of public school. All the differences are unanimously positive in favour of the PPP School.
When we probe into the scores for different grades the mean of PPP School is better than the Public school
(Figure A46). This is also relevant for the absolute values of both grade 5 and grade 8. In case of Grade 5
-24-
minimum difference observed is of at least 2 grades in between (Figure A52). The difference in Math and
English score among schools is significant (Figure A47 and Figure A49).
Overall the Math scores are lagging behind the English scores in both the schools. The difference
in math score is more than that of the English score among schools. In Figure A53, the math score of the
public school is unanimously at score 3 with some outliers while the private school 25th percentile starts
from score 3. Despite the ambiguity of English Score partnership school’s 25th percentile starts from the 75th
percentile of the public school (Figure A55).
The differences between mean math result in class 5 and 8 are significant at 5 percent level of
significance (Figure A48). The increase in the mean difference with not much difference in the standard
error may be a proponent that the lack of knowledge is accumulating over the years in public schools
or/and the incremental knowledge in PPP school is accumulating. Though before any concrete conclusion
is reached, over this matter, it requires a detailed study in the particular field. The box pot (Figure A54)
shows extreme variation in scores among schools. At grade 5 Public school remains a line and 8 grade is
practically no better than that. 8 grade’s highest value is at the 25th percentile of PPP school.
Mean difference in English result at grade 5 level is significant but not at grade 8 level it may be
because of the uncontrolled factor (Figure A50). Still the box plot (Figure A58) shows a greater difference,
consistent to prior analysis, at grade 5 level. At grade 8 level there is wide variation in scores at public
school. The 25th percentile of public school grade 8 begins way before that of Partnership school while the
75th percentile ends together. The mean difference in the sum of math and English result and in the average
of two results is significant at 5 percent level of significance at both the grade levels. It shows that the
understatement of difference in English result at grade 8th level was not enough to go against PPP School.
Thus it is proved there is a significant difference in the results and are in favour of PPP School.
Table 6: Zindagi Trust - Regression results
Math result English result Sum of Math and English result
Average of math and English result
School 1.83*
(.266) 1.642* (0.448) 3.615* (0.618) 1.807* (0. 309)
Class 0.484*
(0.088) 0.757* (0.146) 1.297* (0. .204) 0.648 (0.102) Constant -0.116
(0.569) 0.8652 (0.963) 0.382 (1.341) 0.191 (0.67) Standard errors in parentheses
-25-
For association of the differences in mean to the provision of treatment we used a simple
regression. Estimation results are shown in Table 6. We regressed the four ways of measuring educational
outcome on school and class. The constant remained in significant and all the other variables in regression
remained significant at 5 percent level of significance. The coefficient of variable school is signifying the
treatment; treated is 1 and control is 0. The coefficient is significant despite changes in the dependent
variable. The coefficient signifies that on average if a student provided with such a treatment will show
improvement in the results by a more then a level higher. The coefficient of variable class remained very
small signifying that on average the students of class 8 are not on a learning level much higher than the 5
grade students.
Assessment of control variables
To address the importance of covariates, first we consider the role of household factors like number of
households, number of children, gender and age of siblings, number of sibling, number of female siblings
and number of male siblings. Number of children in the household was the only variable which was
significantly different from between schools; there were more children on average in a PPP school attending
student’s household than in public school. When number of children in the house hold is included in regression its coefficient is insignificant. Then we probed into the students information, it included 13
questions. The question were who teaches at home, time spend studying students work status and its effect
on studies, is father happy or anybody else is not happy with students education and work, there response
about students involvement in extracurricular activities and vocational training and the students likeness
and disliking to different school dimensions.
Does the parent teach, does the student go to tuition, the time child spends studying at home and
does the child works are significantly different among schools. In public school more parents reported
teaches their children themselves while in PPP School most students goes to tuition and PPP school
student’s spends 0.4 hours more studying and a few of the students are reported to be working than the comparison group students. It may be as a result of the intervention that parents started sending their
children to tuition instead of teaching the children themselves, student started spending more time
studying and they were less involved in working. When run regression parental help have positive
significant coefficient with results while tuition, time spend studying and work status does not have
significant impact. We generated a variable which sums up the number of help a child gets from out of
-26-
disturb each other in studies. The variable has significant positive correlation with the educational
outcomes.
Fathers and families happiness about child’s education and work and is the child engaged are significantly different among the schools. These can be the factors which may influence the academic results
of students. Fathers are happier with child education and work in PPP School than the public school. It was
not reported in the government school that any family member is unhappy with child’s education while it was reported in PPP School. And the students in public school are reported to be engaged more than that
in PPP School. When these variables were included in the regression they all have in significant impact on
results.
The ranking to agreement to school level personal liking and disliking of different school
characteristics are significantly different among schools students. Public school students ranked making
friends the highest agreement while PPP school student gave highest rank to their likeness towards teachers.
Similarly PPP students report strong disagreement to all the disliking school level variables. While at public
school they ranked it highest that they don’t understand the course and they don’t get chance to play at school. But all these variables showed insignificant coefficient in relation to the educational outcome.
The next part is about the household information, these are among the house hold variable which
may trigger the change in educational outcomes. They consists of mother tongue, and the most spoken
language, relationship to the head of the family, gender of the house hold head, family structure and the
number of small household units existing under the same roof. Gender of the household head, relationship
to the house hold head and family structure are statistically different between both the schools. The PPP
students are more likely to be daughters of the house hold head than the public school. The gender of the
house hold head is most likely to be male than the gender of the house hold head in a public school. And
the PPP school student is more likely to be in a joint family than a public school student. Only gender of
the house hold head showed significant coefficient when regressed with educational outcome.
We then moved to the parental information of the students. Which included questions like are you
a permanent resident of Karachi, are parents alive, parents age and mothers age at the time of marriage.
These variables may contribute to the change in the results. All the variables are statistically different among
the schools except for the father’s age. The PPP students are more likely to be the residents of Karachi than
the public school students. In public schools none of the observations reported that the child is orphan
while there are such observations in PPP School. The age of mother now and at the time of marriage is also
expected to be higher in PPP than in the public school. Native place other than Karachi mother alive,