Munich Personal RePEc Archive
Social cooperatives, social welfare
associations and social networks
Degli Antoni, Giacomo and Sabatini, Fabio
University of Parma, Sapienza University of Rome
3 November 2015
Online at
https://mpra.ub.uni-muenchen.de/67623/
Social cooperatives, social welfare associations and social networks
Giacomo Degli Antoni♣
Fabio Sabatini♦
Abstract
We use an original dataset to study how participation in two types of
nonprofit organizations, i.e. social welfare associations and social
cooperatives, affects individual social capital, intended as networks of
cooperative relationships. Participation in both the types of organization
allows members to start new social relations. However, social welfare
associations seem to play a significantly greater role in the development of
volunteers’ social capital, favouring the creation of weak ties that are used
to exchange information and advice, and offering the opportunity to
establish stronger ties entailing concrete mutual support. Within social
cooperatives, workers appear to develop their individual social capital to a
greater extent than volunteers. Our results suggest that the composition of
the workforce, the depth of members’ involvement in the organization’s
activities and human resources strategies adopted by the management
influence the creation of cooperative relations through on-the-job
interactions.
Keywords: social capital, nonprofit organizations, social cooperatives,
social networks, volunteering.
JEL Codes: L31, L33, P13, Z1, Z13
♣
University of Parma, Department of Law and Econometica (Inter-University Center for Economic Ethics and Corporate Social Responsibility)
♦
1. Introduction
The early literature on social capital commonly claimed that nonprofit organizations play a
positive role in the diffusion of civic attitudes, sentiments of trust and the development of networks
of cooperative relationships. After the publication of the seminal work of Putnam et al. (1993),
many empirical studies have measured social capital through indicators of membership of nonprofit,
non-governmental, associations belonging to civil society. The habit of considering civil society as
an integral part of social capital has since then spread among scholars and policy makers, causing
some confusion between the two concepts (see for example the influential World Bank’s guidelines
for social development: World Bank, 2011). An implication of this approach is that support for the
nonprofit sector and for participatory processes has been long considered a decisive policy tool for
the accumulation of social capital, the promotion of welfare, and the strengthening of democracy
(Grootaert and van Bastelaer, 2001; European Commission, 2005; OECD, 2010).
We argue that nonprofit organizations are not all alike in how they contribute to the creation
of social capital. Different types of organization play a diverse role depending, for example, on their
institutional aims and purposes, the composition of the workforce (e.g. the proportions of workers
and volunteers), and the effort made by the organization to promote social interactions among its
members. To investigate this thesis, we study how participation in two specific types of nonprofit
organization - social welfare associations (hereafter SWAs) and social cooperatives (SCs) - is
related to the development of social networks of cooperative relationships among their workers and
volunteers.
With respect to the previous studies in the field (see section 3), our work innovates in two
ways. First, it focuses on social networks, by studying the effect of participation in different types
of organizations on the development of cooperative relations. Networks are analyzed through the
elaboration of indicators of the strength of relationships. We measure the weak ties allowing the
transmission of information and advice, and the stronger ties entailing concrete mutual support. The
affects aspects of social capital, such as networks of relations, which have not been investigated
before and primarily disclose their effect at the micro level both at the individual (e.g. Antoci et al.,
2012; 2013; 2015; Brown et al., 2006; Folland, 2006; Andriani & Sabatini, 2015; Fiorillo &
Sabatini, 2011; 2015) and at the organizational level (Hansen, 1999; Leana & Van Buren, 1999).
Second, unlike previous studies on the effect of membership in nonprofit organizations, which
focused solely on volunteers, our sample enables us to analyze the effect of participation on two
distinct types of subjects, i.e. volunteers and workers. In fact, we will specifically consider a
distinctive feature of SWAs and SCs in our sample, i.e. the composition of the organization’s
workforce.1
We specifically focus on those organizations that, in our view, better match Putnam’s concept
of civic community, as they share the institutional aim of pursuing solidarity goals,(Putnam et al.,
1993; Putnam, 2000). The strategy of distinguishing between organizations of a different nature and
with different characteristics but similar purposes enhances understanding of the relationship
between the nonprofit sector and social capital, by suggesting how nonprofit organizations may be
modelled for the purpose of fostering the accumulation of social capital. The effect of SCs – and,
more generally, of cooperative firms – on the structural components of individual social capital has,
to date, been unexplored, despite the growing attention that has been given to this type of enterprise
in the economics literature. Our study also makes a first step towards filling this gap.
Our research question can be summarized as follows: may different types of nonprofit
organization, with similar purpose but diverse nature and characteristics, produce different effects
on the creation of social networks of their members?
To reach our goals, we draw on a unique dataset of individual-level microdata collected by
the authors through the administration of a questionnaire to a sample of volunteers and workers in
SCs and SWAs in the Italian province of Parma.
1 In 1991, Law 266 (in Italy) established that, in order to access public grants and to benefit from tax relief,
Creating social capital across employees is often considered to be an important goal by
organizations. Case studies show that the building of a cooperative climate within the workforce
and favouring the establishment of trust relations among employees and between employees and
managers generally constitute key tasks for management. Studies on life satisfaction, on the other
hand, show that workers’ well-being is significantly affected by the quality of relationships with
colleagues, the establishment of friendships in the workplace, and other non-economic dimensions
of job quality (Findlay et al. 2013). According to Gui (2000), these “relational assets” contribute to
firms’ economic performance just as do new investments in physical capital, because they increase
workers’ effort and productivity, thereby improving the organization’s performance (Andrews,
2010; Sabatini et al., 2014; Zhang and Lin, 2015). The possible linkage between the workforce’s
social capital and labour productivity may develop along two dimensions. Firstly, social capital
fosters the diffusion of knowledge and information among workers (e.g. Nahapiet & Ghoshal, 1998
Mäkelä & Brewster, 2009), “making possible the achievement of certain ends that would not be
attainable in its absence” (Coleman, 1990: 302). Secondly, social interactions may affect workers’
effort and motivation. In their famous study on organizations, March and Simon (1958) argued that,
even if managers are authoritative and the enterprise’s hierarchy is definite and well functioning,
employees are able to influence the achievement of tasks in different ways, such as by delaying the
execution of orders and, more in general, engaging in opportunistic behaviour. Many studies show
that, if human relations within the workforce are trustful and relaxed, employees are more inclined
to do their best at work, and they will be more likely to sanction shirking behaviour through peer
monitoring (Kandel & Lazear, 1992; Sabatini, 2008; 2009; Huck, Kübler & Weibull, 2012). More
in general, the establishment of trust-intensive relationships across the workforce favours
organizational socialization, meaning “the process by which new members acquire the attitudes,
values, knowledge and expected behavior needed to participate as organizational members”
of attachment to the organization, identification with its goals, and willingness to work hard for it
(Haski-Leventhal & Bargal, 2008).
The experience of the nonprofit organizations investigated in this study shows that the
composition of the workforce, the depth of members’ involvement in the organization’s activities
and human resources strategies adopted by the management influence the creation of cooperative
relations through on-the-job interactions.
The next sections briefly provide some definitions and review the related literature. Then we
describe our data and empirical strategy. The following sections present some descriptive evidence
and the econometric analysis. A discussion and interpretation of results is offered in the last
sections.
2. Definitions and related literature
A SWA is a type of nonprofit organization that has the statutory objective of carrying out
charitable activities such as the provision of social welfare services for disadvantaged or deprived
people, or the promotion of collective actions on public interest issues such as civil rights and
environmental protection. Italian SCs conjugate characteristics of traditional cooperative enterprises
and traditional nonprofit organizations in which ownership and governance rights are assigned to
the workers or to a mix of categories of stakeholders (Degli Antoni & Portale, 2011). Residual
earnings are for the most part reinvested in reserves that are not available to members. In this
perspective, SCs can be considered nonprofit organizations with distribution constraint (Borzaga &
Tortia, 2006). Both these types of organization are widespread across the world. For example,
World Values Survey data include information about membership in all the possible types of SWA,
i.e. those engaged in activities of assistance, healthcare, environmental protection, childcare or
between 2001 and 2011, reaching a total of 11,264 and employing about 320,513 workers,2 may be included in the broader category of social enterprises3 (Borzaga & Defourny, 2001; Kerlin, 2006), whose presence has grown dramatically in many regions of the world over the past two decades
(Kerlin, 2010).
Social capital is generally referred to as all “features of social life – networks, norms, and
trust – that enable participants to act together more effectively to pursue shared objectives”
(Putnam, 1995, p.67). At the level of individuals, Bourdieu (1980) stressed the role of social
relations and defined social capital as “the sum of the resources, actual or virtual, that accrue to an
individual or group by virtue of possessing a durable network of relationships of mutual
acquaintance and recognition” (Bourdieu & Wacquant, 1992). Putnam (1995) argued that a research
priority is to clarify the dimensions of social capital. Uphoff (1999) drew a distinction between the
structural and cognitive dimensions of the concept. Structural social capital concerns individuals’
behaviours and mainly takes the form of networks. Cognitive social capital derives from
individuals’ perceptions resulting in norms, values and beliefs that contribute to cooperation.
Several studies have investigated the effect of associational participation on social capital’s
cognitive dimensions before. At the individual level, Stolle and Rochon (1998) used World Values
Survey cross-sectional data from the U.S., Germany and Sweden to show that membership of
diverse associations affects social capital in different ways. The authors found that the degree of
“associational diversity” is positively correlated with generalized trust and community reciprocity
among members (p.61). At the macro level, Knack and Keefer (1997) investigated the effect of
different types of organization on generalized trust. More recently, Grießhaber and Geys (2012),
found that the impact of membership on corruption significantly varies according to the
2 9° “Censimento industria e servizi e Istituzioni non profit 2011” (Census of industry and services and nonprofit institutions in 2011), http://dati-censimentoindustriaeservizi.istat.it/.
3
The category “social enterprise” presents some differences between the US and the European context. In the latter, SCs are explicitly considered as social enterprises (see in particular the approach developed by EMES: European Research Network; see also Kerlin, 2006).
association’s characteristics in terms of inclusiveness and interconnectedness in a cross-section of
20 European democracies. Similar results on the different effects of diverse types of association
have been obtained by other authors (e.g. Hooghe, 1998).
In this paper we focus on the so far neglected structural dimension of social capital. We study
how different types of organization may affect the social networks of their members.
3. Dataset, social capital indices and independent variables
3.1 Dataset
The empirical analysis is based on an original dataset obtained by merging data collected by
the authors through the administration of an anonymous questionnaire in two different surveys, in
2007 and 2011 respectively. Despite the economic crisis that occurred between the two years, the
merging of the two datasets seems not to undermine our empirical results. In fact, a dummy equal to
1 for subjects who filled in the questionnaire in 2007 and 0 for those who filled in the questionnaire
in 2011 is not significantly related to the formation of social networks when included in regressions
presented in Table 2.
In 2007, respondents were volunteers in SWAs. 290 members of 45 associations operating in
the province of Parma in northern Italy participated in the survey. The number of volunteers per
association was 6.4 on average (minimum 2, maximum 11 and standard deviation 2.4). The sample
of organizations was a stratified random sample4 that represents 10% of organizations in the province. Volunteers were randomly chosen among members of the associations. They filled in a
questionnaire of 64 questions about their experience as volunteers and returned it immediately to
the person in charge of administering and collecting the questionnaires. We did not observe
self-selection problems with respect to volunteers of SWAs, as volunteers where randomly selected and
they all returned their questionnaire.
4 Strata referred to the district where the association operated (the province of Parma is divided into four administrative
In 2011, the questionnaire was administered to volunteers and salaried workers at SCs
operating in the same province. SCs were contacted through a consortium of associations involving
37 SCs. This consortium represents a significant part of the 73 SCs operating in the province. All 37
SCs were invited to take part in the research project. 17 SCs agreed to participate (12 of which were
A-type, 1 was B-type and 4 were A+B-type).5 In total, we collected questionnaires from 32 volunteers in 12 SCs (2.7 volunteers per organization on average; minimum 1; maximum 5 and
standard deviation 1.5)6 and 106 workers in 17 SCs (6.2 workers per organization on average, minimum 1, maximum 15 and standard deviation 4.5). In the 2011 survey, we asked managers of
SCs to distribute questionnaires to all their workers and volunteers. Questionnaires were distributed
and filled in at home. Since many subjects did not return the questionnaires (we received
questionnaires from the 26% of workers and 9% of volunteers),7 there could be a problem of self-selection with respect to subjects involved in SCs. However, our main empirical result (i.e. that
volunteers seem to be less able to develop networks when they operate in SCs rather than in SWAs)
induces us to think that self-selection does not invalidate our result. What we found is that the
“more cooperative” individuals (more inclined to fill in and to return the questionnaires) among
volunteers of SCs develop less social capital than volunteers of SWAs. If self-selection is at work,
we should expect that, without it, our results would be even stronger.
In both the surveys, we asked senior members with a detailed knowledge of their organization
questions about the organization’s characteristics, such as its size, operational characteristics, etc.
Table 1 summarizes the size of sub-samples of volunteers and workers across the two types of
organization.
5 “Type A” cooperatives are those that aim to supply welfare services such as healthcare, assistance, education, and
environment protection services. “Type B” cooperatives are those promoting work integration for disadvantaged people. “Type A + B” cooperatives are those pursuing both aims (see Law 381/1991 - Disciplina delle cooperative sociali, available at the url: bit.ly/381-1991 – in Italian).
6 The sample of volunteers in SCs is smaller than the samples of workers in SCs and volunteers in SWAs. This reflects
the limited involvement of volunteers in SCs. 12 out of 17 SCs included in our sample have less than 10 volunteers and 14 out of 17 less than 20. Five SCs did not return any questionnaires filled by volunteers.
7 With respect to SCs, the lowest percentage of volunteers involved in the research is mainly due to the highest
Table 1 - here
Our data are not representative at a national level. They reflect a situation observed in a
province of Italy with 445,283 inhabitants characterized by many SWAs and a significant number
of SCs.8 However, the SWAs and the SCs that are considered in our analysis conform to Laws 266/1991(see footnote 1) and 381/1991 (see footnote 5) respectively. As such, they are in general
comparable to the associations and cooperatives operating in Italy and conforming to the previous
Laws.
The questionnaire was specifically designed by the authors to investigate the relationship
between participation in different kinds of organization and the creation of social capital. This
special focus allows us to carry out an analysis that would have not been possible using existing
national databases.
3.2 Social Capital Indices
Following the approach of (anonymized citation), who drew on a subset of our data to analyse
associations only, we elaborated two indices of social capital intended as networks of cooperative
relations. They explicitly consider the degree of attachment characterizing the relations formed
through the organization. A proxy named Strong_ties is the standardized9 mean value of the answers to the following questions:
“1. How many of the people you have met through the association/cooperative would you:
a. Talk to about family problems?
b. Trust to look after your relatives (e.g. children or elderly persons)?
8 With 7.3 voluntary associations per 10,000 inhabitants, Parma has the ninth largest number of voluntary associations
per inhabitant (Istat, 2003) of the 113 Italian provinces. It has the 37th largest number, with 17.08 per 100,000 inhabitants, of SCs (our calculation on data from Istat: http://dati-censimentoindustriaeservizi.istat.it/ and http://demo.istat.it/bil20111009/index04.html).
9 The standardization procedure is:
) x min( ) x max(
) x min( x
i i
i ic
− −
where:xic is the value i related to the organization c. This
c. Ask to take care of your home when you are on holiday?
d. Give/ask for help with errands such as shopping, accompanying children or elderly persons
to do different activities, etc.?”
The second index of social capital, named Weak_ties, is the standardized mean value of the
answers to the question:
“2. With how many of the people you’ve met through the association/cooperative have you started
the following relations:
a. Phone calls to ask for information or advice?
b. Doing not very demanding errands?
c. Asking for information about job opportunities?”
In adopting the labels “strong ties” and “weak ties” to denote these indicators, we basically
follow Granovetter’s (1973) notion of the strength of ties as a “combination of the amount of time,
the emotional intensity, the intimacy (mutual confiding), and the reciprocal services which
characterize the tie” (1973, p.1361). According to this definition, the act of providing concrete
mutual support reflects a high “degree of strength” of an interpersonal tie. However, we are aware
that ties entailing lighter forms of support – such as the provision of information or advice on the
telephone – may in principle match Granovetter’s (1973) definition of strong ties as well. The label
“weak” that we apply to the indicator serves only to compare these ties with the stronger relations
entailing more concrete forms of support.
3.3. Independent Variables
The two independent variables of main interest are:
• A dummy variable (Volunteer_in_association) equal to 1 if the respondent is a volunteer in
• A dummy variable (Worker) equal to 1 if the respondent is a worker in a SC and 0 if s/he is
a volunteer (in a SC or in a SWA).
We include in our regressions several control variables that give us the opportunity to
interpret our results in light of some characteristics of the organizations and of the associational
activities carried out by their members.
At the individual level, the independent variables included in the regressions concern
socio-demographic characteristics, and the depth and type of respondents’ involvement in the
organization. At the level of the organization, the independent variables included in the regressions
concern various operational and structural characteristics of the organization. See Appendix 1 for a
detailed description of these variables.
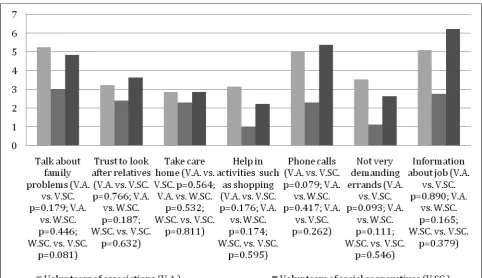
4. Descriptive findings
As regards the different trust-based relationships started between members and the people met
through the organization and considered to the elaboration of the two social capital indices:
• The following percentages of respondents declared to have met through the organization at
least one person they would: 1) talk to about family problems: 77.62% (mean and median of
answers: 4.873 and 2 respectively); 2) trust to look after their relatives (children/elderly
persons): 62.44% (3.192;1); 3) ask to take care of their home while they were on holiday
55.42% (2.756;1); 4) give/ask for help with errands such as shopping, accompanying a child
or elderly persons in different circumstances, etc.: 47.45% (2.717;0);
• The following percentages of respondents declared to have met through the organization at
least one person they would: 1) call to ask for information or advice: 71.28% (4.844;2); 2)
ask for help doing not very demanding errands: 54.85% (3.094;1); 3) ask for information
about a job: 65.24% (5.091; 2).
These figures are different, even though the difference was not always statistically significant,
a) Volunteers in associations show higher values than volunteers in SCs;
b) In SCs, workers show higher values than volunteers;
c) Volunteers in associations present almost the same values as workers in cooperatives.
When we specifically looked at the two social capital indices elaborated from the previous
indicators, we found that:
• The Weak_ties index presents a distribution of values significantly larger (at 10% of
significance) when it refers to volunteers in SWAs in comparison with volunteers in SCs
(Weak_ties: Wilcoxon p = 0.0581; Strong_ties: Wilcoxon p= 0.140);
• The two indices do not show statistically significant differences when we compare workers
and volunteers belonging to SCs (Weak_ties: Wilcoxon p = 0.160; Strong_ties: Wilcoxon p=
0.154);
• The indices do not show statistically significant differences when we compare workers in
SCs and volunteers in associations (Weak_ties: Wilcoxon p = 0.614; Strong_ties: Wilcoxon
p= 0.100).
Figure 1 - Here
5. Econometric results
We used OLS estimates where standard errors are clustered by accounting for the
organization to which the member belonged; that is, we assumed that observations were
independent across groups, but not necessarily between groups, where the groups were formed by
respondents belonging to the same organization.
Table 2 shows our regression results where the two indices of social capital are the dependent
variables, in regressions 1 and 2 respectively. The main independent variables are the dummies
Volunteer_in_association (equal to 1 if the respondent volunteers in a SWA) and Worker (equal to
Control variables are: age, gender, the number of years spent in the organization, and a
dummy variable equal to 1 if the respondent has at least a university degree. Notice that the
following results, including the robustness check, do not significantly change if we consider,
instead of this variable, a categorical variable measuring the level of education between 0 (no
education) and 6 (postgraduate qualification).10 Descriptive statistics of these variables are reported in Appendix 2.
After controlling for socio-demographic variables and for the degree of involvement in the
organization, we found that (Table 2):
Result 1 Volunteering in SWAs is associated with higher levels of volunteers’ social capital
than volunteering in SCs. Being a volunteer in a SWA instead of a volunteer in a SC
is associated with a 45% higher level of the Strong_ties index and with a 54% higher
level of the Weak_ties index with respect to the sample mean.
Result 2 In SCs workers exhibit higher levels of social capital. Being a worker instead of a
volunteer is associated with a 43% higher value of the Strong_ties index and a 59%
higher value of the Weak_ties index.
Result 3 There are no statistically significant differences in the two indices of Strong_ties11 and Weak_ties12 between volunteers in SWAs and workers in SCs.
Socio-demographic characteristics seem not to be significantly associated with the creation of
social capital.
Table 2- here
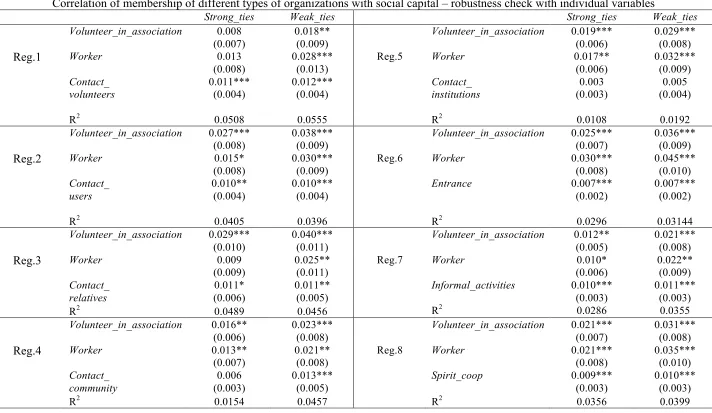
Tables 3 and 4 propose a robustness check for the significance of the different correlation of
participation in the two types of organization with social capital presented in Table 2. Evidence
presented in the following tables allows us to go further into both the investigation of the
10
There is only one case where a weakly significant effect disappears: Table 3, Reg.7, variable Workers in relation to Strong_ties.
determinants of social capital creation and the possible reasons – associated with the different
characteristics of the organizations and of the organizational activities performed by their members
– for the different effects recorded between volunteers and workers within and between
organizations.
In Table 3 we included variables measured at the individual level. In Table 4 we included
variables at the level of the organization. All the control variables were measured for both
volunteers and workers.
In Tables 3 and 4 we add one by one the control variables to the regressions presented in
Table 2. The practice of testing control variables individually is not common (even though some
other studies use similar approaches, e.g. Becchetti et al., 2010; Burks et al., 2003). We decided to
include them one by one in the robustness check because of the high number of missing values.
When we include all the independent variables in the regressions presented in Table 2, the number
of observations drops from more than 360 to less than 250. In particular, the limited sub-sample of
volunteers in SCs becomes very small when we include all the control variables in the same
regression. Moreover, the problem with missing values cannot be tackled by including all but one or
two control variables in the regression. In fact, missing values affect the different variables with
respect to different observations. Obviously the situation changes when we include the control
variables one by one, with regressions that, in the worst case, have 324 observations. All variables
are described in the Appendix 1.
Table 3 shows the coefficient of the independent variable of main interest
(Volunteer_in_association and Worker) when the control variables considered in the regressions
presented in Table 2 are included (Age, Female, University, Time_in_ org) along with other
individual covariates.
Regressions 1–5 account for the frequency with which the respondent participates in activity
groups with volunteers (Reg.1), or enters into relations with users (Reg.2), with family members of
institutions (Reg.5). The first four aspects are positively and significantly associated with social
capital creation. Moreover the degree of participation in activity groups with other volunteers is the
only control variable that eliminates the significance of the dummy Volunteer_in_association in
respect to the Strong_ties index.
Regression 6 highlights that the Strong_ties and Weak_ties indices positively correlate with
managers’ efforts to support the integration of new members into the organization, for example
through group presentations, welcoming dinners, and organized trips.
Regression 7 suggests that the frequency of respondents’ involvement in informal activities
promoted by the organization – such as social dinners, trips, cultural events, and discussion groups
– may promote the creation of networks of cooperative relations with the people met through the
organization.
Regression 8 reveals a significant correlation between the creation of social capital and the
importance given by respondents to the spirit of cooperation among members of the organization.
Regression 9 includes dummy variables representing the place of birth of respondents
(northern Italy, central Italy, or abroad). They are not significantly correlated with social capital
creation, with the exception of the abroad dummy, which significantly and negatively correlates
with the Strong_ties index.
Regression 10 includes binary variables representing the main type of activity that
respondents perform in their organization. The type of activity does not significantly affect the
creation of social capital, apart from a negative effect of accounting activities.
Regression 11 shows that the importance given by respondents to the embeddedness of the
organization in the local community is significantly and positively correlated with the Strong_ties
index.
Regression 12 considers the effect of the motivations that induced respondents to join the
organization. We considered both intrinsic and extrinsic motivation. Following Deci, one ‘‘is
activity itself’’ (Deci, 1971, p.105). Intrinsic motivations may have an important role in
organizations characterized by high participation in decisions and solidarity goals (Degli Antoni,
2009) and in nonprofit organizations in general and SCs (Becchetti et al., 2013), where the presence
of volunteer work may strengthen the idea that people act because they obtain satisfaction from the
action in itself (Frey and Goette, 1999). However, both volunteers and workers who join nonprofit
organizations may also be extrinsically motivated. They may want to enrich their social network
(Prouteau and Wolff, 2004) or they may look for the social recognition that derives from
volunteering or working in nonprofit organizations characterized by social goals (Schiff, 1990;
Meier and Stutzer, 2008). In our analysis, we consider two intrinsic motivations, i.e. ideal
motivation (Mot_ideal) and the desire to feel useful to others (Mot_usefulness), and two extrinsic
motivations, i.e. the desire to increase the number of acquaintances or friends (Mot_friends) and the
pursuit of social recognition (Mot_social).
Regression 12 shows that people with a higher ideal motivation seem to experience a larger
increase in their social capital than do people with poor ideal motivations. A weakly significant
effect emerges with respect to the pursuit of social recognition, in relation to the Weak_ties index.
Regression 13 reveals a strong association with social capital of the level of respondents’
current motivation in joining the organization’s activity.
Finally, Regression 14 includes two dummies related to work status. No-income takes the
value of 1 for unemployed workers and those who are not in the labour force (i.e. students and
housewives). Low-income refers to subjects with low-income occupations (blue-collar workers,
educators and workers with atypical contracts) and retired workers. The two proxies for subjects’
socio-economic conditions neither affect the formation of social networks nor do they significantly
change our main results.
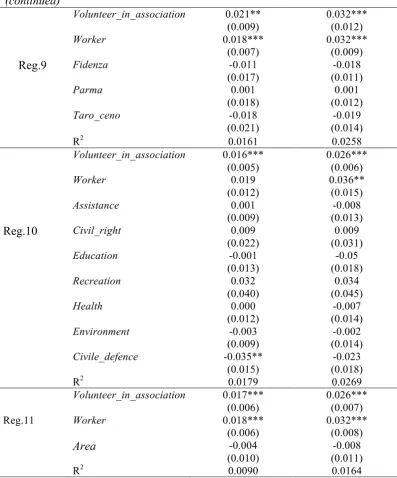
In Table 4, control variables at the level of the organization are considered.
The frequency of informal meetings to discuss organizational activity is positively associated
with the two social capital indices (Reg.1). This suggests that the integration of newcomers into the
organization may not entirely depend on workers’ individual efforts to learn how to fit in. Rather,
the organization’s relational climate and the human resources strategies adopted by the management
are likely to play a positive role. However, the negative coefficient of the number of formal
meetings held during the past year (Reg. 2) suggests that not all types of meeting can have the same
impact on the creation of social networks. The literature on relational goods provides possible
insights to explain this result. Uhlaner (1989) intended relational goods as intangible goods that
cannot be enjoyed alone and that are generated as the relation with non-anonymous agents goes on.
Examples of relational goods are friendship and social approval (Uhlaner, 1989, p.255). The
production of relational goods is strictly based on mutual agreement (Uhlaner, 1989). The creation
of relational goods cannot be imposed and goodwill is particularly important for their production.
Even though they may be generated through encounters that may happen in any circumstances,
some situations seem to be more convenient than others. In particular, relations that are started
spontaneously are more likely to foster the creation of relational goods (Prouteau and Wolff, 2004).
Following these arguments, we suppose that informal meetings promoted by the organization
represent a more effective circumstance for the creation of social relations than formal meetings.
When the percentage of volunteers in the workforce is considered, the difference in the
creation of social capital between volunteers in SWAs and in SCs is no longer significant with
respect to the Strong_ties and Weak_ties indices (Reg.3). However, multicollinearity between
Volunteer_in_association and Volunteers_% suggests caution in interpreting the result from
Reg.3.13
13
The other covariates considered in the Table (regressions 4–11) neither significantly affect, at
least in the large majority of cases, the creation of social capital, nor do they substantially change
the different effects of respondents’ participation within and between organizations as they emerged
in Table 2.The only exception is the Worker dummy, which becomes not significant with respect to
the Strong_ties index when the sector of activity of the organization is considered (Reg.10).
Table 4 – here
6. Discussion of results
Both workers in SCs and volunteers in the two types of organization report that in-the-field
interactions have contributed to the creation of new personal contacts. If we focus on the creation of
strong and weak ties by volunteers, the econometric analysis shows that SWAs perform better. If
we also account for salaried workers, our results suggest that on-the-job interactions within SCs
increase the individual social capital of workers to the same extent to which in-the-field interactions
influence the individual social capital of volunteers in SWAs.
We find that the establishment of both weak and strong ties is significantly and positively
associated with managers’ efforts to support the integration of newcomers and by the degree of
involvement in informal group activities promoted by the organization, such as social and cultural
events.
The significance of the relationship between volunteering in SWAs and the creation of strong
ties entailing mutual support disappears if we include in the analysis a control variable measuring
the degree of participation in group activities with other volunteers. This result suggests that the
main difference between SWAs and SCs may lie in the depth of volunteers’ involvement in group
activities with other volunteers. This may be related to differences in the composition of the
workforce between the two types of organization. In SWAs salaried workers constitute a minority
workforce. The effect of the degree of volunteers’ involvement in group activities with other
volunteers leads us to think that volunteers better empathize and develop new ties with people with
similar status and motivations, consistent with the claims of the literature on tokenism. Evidence
from this field of studies suggests that volunteers and workers may better empathize and develop
new ties with people with similar status and motivations. The concept of tokenism (Kanter, 1977) is
often used to explain the effects of being a numerical minority in a relatively homogeneous
environment (female tokens in male-dominated jobs in the seminal study by Kanter). Members of
numerical minorities in work environments are found to receive less support from colleagues than
members of the numerically dominating group (in terms, for example, of empathy and actual
assistance), to develop fewer informal ties and job-related contacts, and to report lower job
satisfaction and health (Ducharme and Martin, 2000; Wallace and Kay, 2012).
The analysis suggests that ideal motivations and cooperative attitudes also play an important
role in fostering workers’ and volunteers’ ability to develop their networks through in-the-field
interactions.
Overall, the empirical evidence suggests that the homogeneity of members’ status and
motivation may be an important driver of the association’s ability to foster the creation of social
capital by their members.
7. Conclusions
Our findings suggest that SCs and SWAs are not all alike in how they affect their members’
social capital. In-the-field interactions probably allow volunteers in SWAs to develop their
networks to a greater extent than is the case in SCs. The latter type of organization, however, is
likely to effectively foster the development of workers’ social capital through on-the-job
interactions.
Our results enrich the literature on associational diversity. First, we add to the debate by
Second, our questionnaire allows us to use as outcome variables refined and reliable indicators of
the structural dimensions of the concept – as given by social networks of human relations with
different degrees of strength. The specificity of these indicators is fundamental for providing a more
in-depth evaluation of the impact of participation in nonprofit organizations. In addition, our
research design allows us to exclude the existence of reverse causality – one of the most common
forms of endogeneity in social capital studies – since changes that have occurred in workers’ and
volunteers’ networks cannot in any way influence their past choice to work or volunteer for a SC or
for a SWA. Finally, unlike previous studies on associational participation, which prevalently focus
on volunteers, our sample also includes workers.
However, much research has to be done in the area to improve our understanding of the role
of nonprofit organizations– and of organizational diversity – in economic development and
well-being. Our results do not clarify whether the organization is able to “socialize” the sentiments of
trust that are developed in the context of workers’ and volunteers’ personal networks. The
relationship between our two main independent variables and the outcome variables accounted for
in Knack and Keefer (1997) and Stolle and Rochon (1998) – i.e. civic attitudes and generalized trust
– should be investigated, possibly in a larger sample.
Even if our research design allows us to overcome reverse causality issues, other endogenity
problems still remain open. Organizational participation, as workers or as volunteers, and the
individual propensity of workers to develop social networks as a consequence of their interaction
with the organization’s environment, may be influenced by omitted variables. An effort must be
made to collect suitable – possibly longitudinal – data to address causality in the econometric
Appendix 1 – Description of individual variables
Volunteer_in _association
Dummy variable (DV) = 1 if
volunteer in a nonprofit association Motivations for joining the association/social cooperative measured by response to the following question: “With respect to your decision to become a volunteer (to start/accept your work in the cooperative), how important were the following aspects, from 1 (not at all) to 7 (entirely)?”
Worker
DV = 1 if worker in a social cooperative Mot_social
Mot_ideal Mot_Usefulness Mot_friends
pursuit of social recognition ideal motivations
desire to feel useful for others
desire to increase your number of acquaintances or friends
Age Respondent’s age in years
Female DV=1 respondent is a female Current_
Motivation
Strength of the current respondent’s motivation for joining the organization, between 1 (I feel really poorly motivated in my activity) and 7 (very strongly motivated)
University
DV=1 respondent has at least a university degree
No-income
= 1 for people who do not have an occupation, e.g. students, housewives, and unemployed
Low-income subjects with low income occupations (manual workers, educators and workers with atypical contracts) and retired people
Time_in_ org Years spent in the organization Entrance Effort made by managers to welcome new members in the organization (e.g. group presentations, social dinners)
Informal_ activities
How often the respondent participates in informal activities promoted by the organization (e.g. dinners, trips), from 1 (never) to 5 (always)
How often, from 1 (never) to 5 (every week), the respondent:
Dummy variables measuring the activities carried out in the organization
Contact_ volunteers
participates in group activities with volunteers
Manual manual activities
Contact_Users enters into relations with users
Service service delivery Contact_relatives enters into relations with household members of users
Accounting accounting Contact_
institutions enters into relations with representatives of local institutions
Public public relations Contact_
community enters into relations with representatives of the local community
North Centre
Abroad Macroregion of birth
Contact_ Forprofit
enters into relations with managers of for-profit firms
Spirit_coop
Importance given to the creation of a spirit of cooperation among members (7- level scale)
Appendix 1 – Description of organizational variables
Parma, Fidenza, Taro_ceno, Sud_est DV indicating the administrative district of the province of Parma in which the organization operates
Assistance DV=1 if the organization operates in the sector of Assistance
Civil_right DV=1 " Civil Rights Promotion and Preservation
Education DV=1 " Education
Recreation DV=1 " Recreation and Culture
Health DV=1 " Health
Environment DV=1 " Environmental and Animal Conservation
Civile_defence DV=1 " Civil Defence
Commercial DV=1 " Commercial activity
Area DV=1 if the organization operates only within the province of Parma, 0 otherwise
Coop_a DV=1 social cooperative of type A
Coop_b DV=1 " of type B
Coop_ab DV=1 " of type A+B
Years_org Number of years in operation
Volunteers Number of volunteers in the organization
Workers Number of workers in the organization
Workers and volunteers Total number of workers and volunteers in the organization
Volunteers_% Percentage of volunteers in the organization
Formal_meetings Number of formal meetings held in the last 12 months
Appendix 2 - Descriptive Statistics
Observations Mean St. dev. Min. Max.
Dependent variables
Strong _ties 377 0.042 0.072 0 1
Weak _ties 378 0.056 0.085 0 0.702
Independent variables
Volunteer_in_association 428 0.678 0.468 0 1
Worker 428 0.248 0.432 0 1
Age 412 46.777 15.892 17 87
Female 421 0.563 0.497 0 1
University 422 0.280 0.449 0 1
Time_in_ org 422 8.633 7.802 1 49
References
Andrews Rhys (2010). Organizational social capital, structure and performance. Human Relations 63 (5): 583-608.
Andriani, Luca & Fabio Sabatini, (2015). Trust and Prosocial Behaviour in a Process of State Capacity Building: the Case of the Palestinian Territories. Journal of Institutional Economics 11 (4), 823-846.
Antoci, Angelo, Fabio Sabatini & Mauro Sodini (2012). The Solaria Syndrome: Social Capital in a Hypertechnological Growing Economy, Journal of Economic Behavior & Organization. 81(3): 802-814.
Antoci, Angelo, Fabio Sabatini & Mauro Sodini (2013). Economic growth, technological progress and social capital: the inverted U hypothesis. Metroeconomica 64 (3), 401-431.
Antoci, Angelo, Fabio Sabatini & Mauro Sodini (2015). Online and offline social participation and social poverty traps. Journal of Mathematical Sociology, dx.doi.org/10.1080/0022250X.2015.1022278.
Becchetti, Leonardo & Giacomo Degli Antoni (2010).The sources of happiness: Evidence from the investment game, Journal of Economic Psychology. 31(4): 498–509.
Becchetti, Leonardo, Stefano Castriota & Ermanno C. Tortia (2013). Productivity, wages and intrinsic motivations, Small Business Economics. 41(2): 379–399.
Borzaga, Carlo & Jacques Defourny (2001). The emergence of social enterprise. London: Routledge.
Borzaga, Carlo & Ermanno Tortia (2006). Worker Motivations, Job Satisfaction, and Loyalty in Public and Nonprofit Social Services, Nonprofit and Voluntary Sector Quarterly. 35(2): 225–249.
Bourdieu, Pierre (1980). Le capital social, Actes de la Recherche en Sciences Sociales. 31: 2–3.
Bourdieu, Pierre & Loïc Wacquant (1992). An Invitation to reflexive sociology. Cambridge: Polity.
Brown, Timothy T., Scheffler Richard M., Seo Sukyong & Mary Reed (2006). The empirical relationship between community social capital and the demand for cigarettes, Health Economics. 15: 1159–1172.
Burks, Stephen V., Jeffrey P. Carpenter and Eric Verhoogen (2003). Playing both roles in the trust game,
Journal of Economic Behavior & Organization. 51(2): 195–216.
Coleman, James S. (1990). Foundations of Social Theory. Cambridge: Harvard University Press.
Deci, Edward L. (1971). Effects of Externally Mediated Reward on Intrinsic Motivation, Journal of Personality and Social Psychology.18: 105–115.
Degli Antoni, Giacomo (2009). Intrinsic vs. Extrinsic Motivations to Volunteer and Social Capital Formation, Kyklos, 62(3): 359–370.
Degli Antoni, Giacomo & Elisa Portale (2011). The Effect of Corporate Social Responsibility on Social Capital Creation in Social Cooperatives. Nonprofit and Voluntary Sector Quarterly40 (3), 566-582. Ducharme, Lori J. & Jack K. Martin (2000). Unrewarding work, coworker support, and job satisfaction.
Work & Occupations,27, 223–43.
European Commission (2005). The Contribution of Social Capital in the Social Economy to Local Economic Development in Western Europe. EU Research in Social Sciences and Humanities. Final Report. Brussels: European Commission.
Fiorillo, Damiano & Fabio Sabatini (2011). Quality and quantity: the role of social interactions in individual health, Social Science and Medicine. 73: 1644–1652.
Fiorillo, Damiano & Fabio Sabatini (2015). Structural social capital and health in Italy. Economics & Human Biology 17, 129-142.
Folland, Sherman (2006). Value of life and behavior toward health risks: an interpretation of social capital,
Health Economics. 15(2): 159–171.
Frey, Bruno S. & Lorenz Götte (1999). Does Pay Motivate Volunteers? Unpublished Manuscript. Institute for Empirical Economic Research. University of Zurich.
Granovetter, Mark (1973). The Strength of Weak Ties, American Journal of Sociology. 78(6): 1360–1380.
Grießhaber, Nicolas & Benny Geys (2012).Civic Engagement and Corruption in 20 European Democracies,
European Societies. 14(1): 57–81.
Grootaert, Christiaan & Thierry Van Bastelaer (eds.) (2001).The Role of Social Capital in Development: an Empirical Assessment. Cambridge, UK: Cambridge University Press.
Gui, Benedetto (2000). Beyond Transactions: on the Interpersonal Dimension of Economic Reality. Annals of Public and Cooperative Economics 71(2): 139–169.
Hansen, Morten T. (1999). The search-transfer problem: The role of weak ties in sharing knowledge across organization subunits. Administrative Science Quarterly, 44(1), 82-111.
Haski-Leventhal, Debbie & David Bargal (2008). The volunteer stages and transitions model: Organizational socialization of volunteers. Human Relations 61(1): 67-102.
Hooghe, Marc (1998). Voluntary Associations and Democratic Attitudes: Value Congruence as a Causal Mechanism, in Marc Hooghe and Dietlind Stolle (eds.) Generating Social Capital. Civil Society and Institutions in Comparative Perspective. New York: Palgrave MacMillan.
Huck, Steffen, Dorothea Kübler, & Jörgen Weibull (2012). Social Norms and Economic Incentives in Firms. Journal of Economic Behavior & Organization 83(2): 173-185.
Istat (2003). Le Organizzazioni di Volontariato in Italia. Rome: Istat.
Kandel, Eugene & Edward, P. Lazear (1992). Peer Pressure and Partnerships. Journal of Political Economy
100(4): 801-817.
Kerlin, Janelle A. (2006). Social enterprise in the United States and Europe: Understanding and learning from the differences, Voluntas: International Journal of Voluntary and Nonprofit Organizations. 17(3): 247–263.
Kerlin, Janelle A. (2010). A Comparative Analysis of the Global Emergence of Social Enterprise, Voluntas: International Journal of Voluntary and Nonprofit Organizations.21(2):162-179.
Knack, Stephen & Philip Keefer (1997). Does Social Capital Have an Economic Payoff? The Quarterly Journal of Economics. 112(4): 1251–1288.
Leana, Carrie R., & Harry J. Van Buren (1999). Organizational social capital and employment practices.
Academy of Management Review, 24, 538-555.
Mäkelä, Kristiina, & Chris Brewster (2009). Interunit interaction contexts, interpersonal social capital, and the differing levels of knowledge sharing. Human Resource Management. 48.4: 591-613.
Nahapiet, Janine, & Sumantra Ghoshal (1998). Social capital, intellectual capital, and the organizational advantage. Academy of management review 23(2): 242-266.
OECD (2010). Social Capital, Human Capital and Health: What is the Evidence? Paris: OECD.
Prouteau, Lionel & François-‐Charles Wolff (2004). Relational Goods and Associational Participation,
Annals of Public & Cooperative Economics. 75(3): 431–463.
Putnam, Robert D. (1995). Bowling Alone: America’s Declining Social Capital, Journal of Democracy. VI: 65–78.
Putnam, Robert D. (2000). Bowling Alone. The Collapse and Revival of American Community. New York: Simon & Schuster.
Putnam, Robert D., Robert Leonardi & Raffaella Y. Nanetti (1993). Making Democracy Work. Princeton: Princeton University Press.
Sabatini, Fabio (2008). Does social capital improve labour productivity in Small and Medium Enterprises?.
International Journal of Management and Decision Making 9(5): 454-480.
Sabatini, Fabio (2009). Social Capital as Social Networks: a New Framework for Measurement and an empirical analysis of its determinants and consequences. Journal of Socio-Economics, 38 (3), 429-442. Sabatini, Fabio, Modena, Francesca and Ermanno Tortia (2014). Do cooperative enterprises create social
Schiff, Jerald Alan (1990). Charitable Giving and Government Policy. An Economic Analysis. New York: Greenwood Press.
Stolle, Dietlind, & Thomas R. Rochon (1998).Are All Associations Alike? American Behavioral Scientist. 42(1): 47–65.
Uhlaner, Carole Jeane (1989). Relational goods and participation: incorporating sociability into a theory of rational action, Public Choice. 62(3): 253–285.
Uphoff Norman (1999). Understanding Social Capital: Learning from the Analysis and Experience of Participation, in Partha Dasgupta and Ismail Serageldin (eds.) Social Capital: A Multifaceted Perspective. Washington, D.C.: The World Bank.
Wallace, Jean A. & Kay, Fiona M. (2012). Tokenism, organizational segregation, and coworker relations in law firms, Social Problems. 59(3): 389–410.
World Bank (2011). Social Capital and Civil Society, retrieved at the url
http://go.worldbank.org/4NQ143KXT0.
Tables
Table 1
Number of subjects per employment status (volunteers vs. workers) and type of organization
Volunteers Workers
Social welfare associations 290 0
[image:27.595.100.497.327.644.2]Social cooperatives 32 106
Table 2
The effect of membership of different types of organizations on individual social capital
Regression 1 2
Dependent Variable
Strong_ties Weak_ties
Volunteer_in_association 0.019*** (0.006)
0.030*** (0.008)
Worker 0.018***
(0.006)
0.033*** (0.008)
Age 0.000
(0.000)
0.000 (0.000)
Female -0.001
(0.008)
-0.012 (0.009)
University 0.004
(0.010)
0.008 (0.012)
Time_in_ org 0.001
(0.000)
0.000 (0.000)
Constant 0.016
(0.015)
0.032** (0.015)
R2 0.0084 0.0151
Root MSE 0.0717 0.08197
Obs. 364 366
Table 3
Correlation of membership of different types of organizations with social capital – robustness check with individual variables
Strong_ties Weak_ties Strong_ties Weak_ties
Volunteer_in_association 0.008 (0.007)
0.018** (0.009)
Volunteer_in_association 0.019*** (0.006)
0.029*** (0.008)
Reg.1 Worker 0.013
(0.008)
0.028*** (0.013)
Reg.5 Worker 0.017**
(0.006) 0.032*** (0.009) Contact_ volunteers 0.011*** (0.004) 0.012*** (0.004) Contact_ institutions 0.003 (0.003) 0.005 (0.004)
R2 0.0508 0.0555 R2 0.0108 0.0192
Volunteer_in_association 0.027*** (0.008)
0.038*** (0.009)
Volunteer_in_association 0.025*** (0.007)
0.036*** (0.009)
Reg.2 Worker 0.015*
(0.008)
0.030*** (0.009)
Reg.6 Worker 0.030***
(0.008) 0.045*** (0.010) Contact_ users 0.010** (0.004) 0.010*** (0.004)
Entrance 0.007***
(0.002)
0.007*** (0.002)
R2 0.0405 0.0396 R2 0.0296 0.03144
Volunteer_in_association 0.029*** (0.010)
0.040*** (0.011)
Volunteer_in_association 0.012** (0.005)
0.021*** (0.008)
Reg.3 Worker 0.009
(0.009)
0.025** (0.011)
Reg.7 Worker 0.010*
(0.006) 0.022** (0.009) Contact_ relatives 0.011* (0.006) 0.011** (0.005)
Informal_activities 0.010*** (0.003)
0.011*** (0.003)
R2 0.0489 0.0456 R2 0.0286 0.0355
Volunteer_in_association 0.016** (0.006)
0.023*** (0.008)
Volunteer_in_association 0.021*** (0.007)
0.031*** (0.008)
Reg.4 Worker 0.013**
(0.007)
0.021** (0.008)
Reg.8 Worker 0.021***
(0.008) 0.035*** (0.010) Contact_ community 0.006 (0.003) 0.013*** (0.005)
Spirit_coop 0.009***
(0.003)
0.010*** (0.003)
Table 3 (continued)
Volunteer_in_association 0.018** (0.007)
0.027*** (0.009)
Volunteer_in_association 0.022*** (0.007)
0.037*** (0.010)
Worker 0.017**
(0.007)
0.032*** (0.008)
Worker 0.023***
(0.007)
0.037*** (0.010)
Reg.9
North -0.008
(0.010)
0.0072 (0.014)
Mot_ideal 0.005**
(0.002)
0.006** (0.003)
Centre 0.030
(0.027)
0.076
(0.051) Reg.12
Mot_usefulness 0.003 (0.003)
0.002 (0.004)
Abroad -0.030***
(0.010)
-0.020 (0.012)
Mot_friends 0.003
(0.002)
0.001 (0.003)
R2 0.0169 0.0357
Mot_social 0.006
(0.004)
0.007* (0.004) Volunteer_in_association 0.016**
(0.007)
0.024***
(0.0109) R2 0.0589 0.0573
Worker 0.007
(0.008)
0.030*** (0.011)
Volunteer_in_association 0.016** (0.006)
0.026*** (0.008)
Reg.10 Service 0.016
(0.010)
0.005 (0.011)
Reg.13 Worker 0.021***
(0.007)
0.035*** (0.009)
Accounting -0.015**
(0.006) -0.021** (0.009) Current_ Motivation 0.011*** (0.004) 0.013*** (0.004)
Manual 0.003
(0.009)
0.002
(0.013) R2 0.0377 0.0434
Public -0.012
(0.007)
0.007 (0.021)
Volunteer_in_association 0.020*** (0.007)
0.030*** (0.009)
R2 0.0275 0.0254 Worker 0.017**
(0.006)
0.033*** (0.009) Volunteer_in_association 0.018**
(0.007)
0.030***
(0.010) Reg.14
No-income 0.003
(0.008)
0.014 (0.015)
Reg.11 Worker 0.019**
(0.008)
0.035*** (0.011)
Low-Income 0.010
(0.008)
0.007 (0.010) Local_community 0.006**
(0.003)
0.004
(0.003) R2 0.0113 0.0183
R2 0.0225 0.0196
Robust standard errors in brackets. *Significant at 10%; **significant at 5%; ***significant at 1%. All estimates include the constant and the following independent variables:
Age, Female, University, Time_in_ org. Estimates’ results related to these variables and Root MSE are omitted for reasons of space and available from the authors.
[image:29.842.58.774.76.497.2]Correlation of membership of different types of organization with social capital – robustness check with organizational variables
Strong_ties Weak_ties Strong_ties Weak_ties
Volunteer_in_association 0.022*** (0.007)
0.034*** (0.009)
Volunteer_in_association 0.019*** (0.007)
0.028*** (0.009)
Reg.1 Worker 0.019***
(0.007)
0.034*** (0.009)
Reg.5 Worker 0.018**
(0.007)
0.034*** (0.010) Informal_Meetings 0.026**
(0.011)
0.028* (0.015)
Workers 0.000
(0.000)
-0.000 (0.000)
R2 0.0190 0.0252 R2 0.0084 0.0143
Volunteer_in_association 0.021*** (0.006)
0.033*** (0.008)
Volunteer_in_association 0.017** (0.007)
0.029*** (0.009)
Reg.2 Worker 0.017***
(0.006)
0.032*** (0.009)
Reg.6 Worker 0.017**
(0.007)
0.032*** (0.009) Formal_Meetings -0.002***
(0.001)
-0.002** (0.001)
Workers and volunteers 0.000 (0.000)
0.000 (0.000)
R2 0.0215 0.0228 R2 0.0177 0.0159
Volunteer_in_association 0.018 (0.011)
0.024 (0.015)
Volunteer_in_association 0.023** (0.010)
0.037*** (0.012)
Reg.3 Worker 0.019***
(0.007)
0.034*** (0.010)
Reg.7 Worker 0.017**
(0.007)
0.030*** (0.008)
Volunteers_% 0.000
(0.000)
0.000 (0.000)
coop_a 0.008
(0.011)
0.007 (0.012)
R2 0.0084 0.0145
coop_b -0.015
(0.012)
0.059*** (0.012) Volunteer_in_association 0.016**
(0.007)
0.028***
(0.009) R2 0.0105 0.0228
Reg.4 Worker 0.018**
(0.007)
0.033*** (0.009)
Volunteer_in_association 0.019*** (0.007)
0.029*** (0.009)
Volunteers 0.000
(0.000)
0.000 (0.000)
Reg.8 Worker 0.018***
(0.006)
0.033*** (0.009) R2
0.0186 0.0169
Years_org -0.000
(0.000)
-0.000 (0.000)
Table 4 (continued)
Volunteer_in_association 0.021** (0.009)
0.032*** (0.012)
Worker 0.018***
(0.007)
0.032*** (0.009)
Reg.9 Fidenza -0.011
(0.017)
-0.018 (0.011)
Parma 0.001
(0.018)
0.001 (0.012)
Taro_ceno -0.018
(0.021)
-0.019 (0.014)
R2 0.0161 0.0258
Volunteer_in_association 0.016*** (0.005)
0.026*** (0.006)
Worker 0.019
(0.012)
0.036** (0.015)
Assistance 0.001
(0.009)
-0.008 (0.013)
Reg.10 Civil_right 0.009
(0.022)
0.009 (0.031)
Education -0.001
(0.013)
-0.05 (0.018)
Recreation 0.032
(0.040)
0.034 (0.045)
Health 0.000
(0.012)
-0.007 (0.014)
Environment -0.003
(0.009)
-0.002 (0.014)
Civile_defence -0.035**
(0.015)
-0.023 (0.018)
R2 0.0179 0.0269
Volunteer_in_association 0.017*** (0.006)
0.026*** (0.007)
Reg.11 Worker 0.018***
(0.006) 0.032*** (0.008) Area -0.004 (0.010) -0.008 (0.011)
R2 0.0090 0.0164
Figures
Figure 1