Comparing Automatic Evaluation Measures for Image Description
Desmond Elliott and Frank Keller
Institute for Language, Cognition, and Computation School of Informatics, University of Edinburgh
[email protected], [email protected]
Abstract
Image description is a new natural lan-guage generation task, where the aim is to generate a human-like description of an im-age. The evaluation of computer-generated text is a notoriously difficult problem, how-ever, the quality of image descriptions has typically been measured using unigram
BLEUand human judgements. The focus
of this paper is to determine the correlation of automatic measures with human judge-ments for this task. We estimate the correla-tion of unigram and SmoothedBLEU,TER, ROUGE-SU4, and Meteor against human
judgements on two data sets. The main finding is that unigramBLEU has a weak
correlation, and Meteor has the strongest correlation with human judgements.
1 Introduction
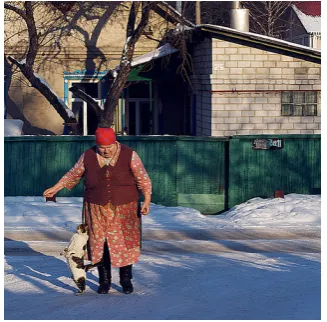
Recent advances in computer vision and natural language processing have led to an upsurge of re-search on tasks involving both vision and language. State of the art visual detectors have made it possi-ble to hypothesisewhatis in an image (Guillaumin et al., 2009; Felzenszwalb et al., 2010), paving the way for automatic image description systems. The aim of such systems is to extract and reason about visual aspects of images to generate a human-like description. An example of the type of image and gold-standard descriptions available can be seen in Figure 1. Recent approaches to this task have been based on slot-filling (Yang et al., 2011; Elliott and Keller, 2013), combining web-scale n-grams (Li et al., 2011), syntactic tree substitution (Mitchell et al., 2012), and description-by-retrieval (Farhadi et al., 2010; Ordonez et al., 2011; Hodosh et al., 2013). Image description has been compared to translating an image into text (Li et al., 2011; Kulkarni et al., 2011) or summarising an image
1. An older woman with a small dog in the snow. 2. A woman and a cat are outside in the snow. 3. A woman in a brown vest is walking on the
snow with an animal.
[image:1.595.335.499.204.365.2]4. A woman with a red scarf covering her head walks with her cat on snow-covered ground. 5. Heavy set woman in snow with a cat.
Figure 1: An image from the Flickr8K data set and five human-written descriptions. These descrip-tions vary in the adjectives or prepositional phrases that describe the woman (1, 3, 4, 5), incorrect or un-certain identification of the cat (1, 3), and include a sentence without a verb (5).
(Yang et al., 2011), resulting in the adoption of the evaluation measures from those communities.
In this paper we estimate the correlation of hu-man judgements with five automatic evaluation measures on two image description data sets. Our work extends previous studies of evaluation mea-sures for image description (Hodosh et al., 2013), which focused on unigram-based measures and re-ported agreement scores such as Cohen’sκrather than correlations. The main finding of our analysis is thatTER and unigramBLEU are weakly
lated against human judgements,ROUGE-SU4 and
SmoothedBLEUare moderately correlated, and the
strongest correlation is found with Meteor.
2 Methodology
We estimate Spearman’sρfor five different auto-matic evaluation measures against human judge-ments for the automatic image description task. Spearman’sρis a non-parametric correlation co-efficient that restricts the ability of outlier data points to skew the co-efficient value. The automatic measures are calculated on the sentence level and correlated against human judgements of semantic correctness.
2.1 Data
We perform the correlation analysis on the Flickr8K data set of Hodosh et al. (2013), and the data set of Elliott and Keller (2013).
The test data of the Flickr8K data set contains 1,000 images paired with five reference descrip-tions. The images were retrieved from Flickr, the reference descriptions were collected from Me-chanical Turk, and the human judgements were collected from expert annotators as follows: each image in the test data was paired with the highest scoring sentence(s) retrieved from all possible test sentences by theTRI5SEMmodel in Hodosh et al.
(2013). Each image–description pairing in the test data was judged for semantic correctness by three expert human judges on a scale of 1–4. We calcu-late automatic measures for each image–retrieved sentence pair against the five reference descriptions for the original image.
The test data of Elliott and Keller (2013) con-tains 101 images paired with three reference de-scriptions. The images were taken from the PAS-CAL VOC Action Recognition Task, the reference descriptions were collected from Mechanical Turk, and the judgements were also collected from Me-chanical Turk. Elliott and Keller (2013) gener-ated two-sentence descriptions for each of the test images using four variants of a slot-filling model, and collected five human judgements of the se-mantic correctness and grammatical correctness of the description on a scale of 1–5 for each image– description pair, resulting in a total of 2,042 human judgement–description pairings. In this analysis, we use only the first sentence of the description, which describes the event depicted in the image.
2.2 Automatic Evaluation Measures
BLEU measures the effective overlap between a
reference sentenceX and a candidate sentenceY. It is defined as the geometric mean of the effective n-gram precision scores, multiplied by the brevity penalty factorBPto penalise short translations. pn
measures the effective overlap by calculating the proportion of the maximum number of n-grams co-occurring between a candidate and a reference and the total number of n-grams in the candidate text. More formally,
BLEU=BP·exp
∑
Nn=1wnlogpn
!
pn=
∑
c∈cand ngram∑∈ccountclip(ngram)
∑
c∈cand ngram∑∈ccount(ngram)
BP=
1 ifc>r e(1−r/c) ifc≤r
UnigramBLEUwithout a brevity penalty has been
reported by Kulkarni et al. (2011), Li et al. (2011), Ordonez et al. (2011), and Kuznetsova et al. (2012); to the best of our knowledge, the only image de-scription work to use higher-order n-grams with
BLEUis Elliott and Keller (2013). In this paper we
use the smoothedBLEUimplementation of Clark et
al. (2011) to perform a sentence-level analysis, set-tingn=1 and no brevity penalty to get the unigram
BLEU measure, orn=4 with the brevity penalty
to get the SmoothedBLEUmeasure. We note that a
higherBLEUscore is better.
ROUGE measures the longest common
subse-quence of tokens between a candidateY and refer-enceX. There is also a variant that measures the co-occurrence of pairs of tokens in both the candidate and reference (a skip-bigram):ROUGE-SU*. The
skip-bigram calculation is parameterised withdskip,
the maximum number of tokens between the words in the skip-bigram. Settingdskipto 0 is equivalent to
bigram overlap and settingdskipto∞means tokens
can be any distance apart. If α=|SKIP2(X,Y)|
is the number of matching skip-bigrams between the reference and the candidate, then skip-bigram
ROUGEis formally defined as:
RSKIP2=α/
α
ROUGEhas been used by only Yang et al. (2011)
to measure the quality of generated descriptions, using a variant they describe asROUGE-1. We set dskip=4 and award partial credit for unigram only
matches, otherwise known asROUGE-SU4. We use ROUGEv.1.5.5 for the analysis, and configure the
evaluation script to return the result for the average score for matching between the candidate and the references. A higherROUGEscore is better.
TERmeasures the number of modifications a
hu-man would need to make to transform a candidate Y into a referenceX. The modifications available are insertion, deletion, substitute a single word, and shift a word an arbitrary distance. TERis expressed
as the percentage of the sentence that needs to be changed, and can be greater than 100 if the candi-date is longer than the reference. More formally,
TER=|reference tokens|edits| |
TERhas not yet been used to evaluate image
de-scription models. We use v.0.8.0 of theTER
evalu-ation tool, and a lowerTERis better.
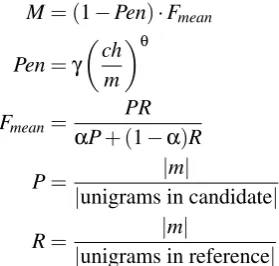
Meteor is the harmonic mean of unigram preci-sion and recall that allows for exact, synonym, and paraphrase matchings between candidates and ref-erences. It is calculated by generating an alignment between the tokens in the candidate and reference sentences, with the aim of a 1:1 alignment between tokens and minimising the number of chunksch of contiguous and identically ordered tokens in the sentence pair. The alignment is based on exact to-ken matching, followed by Wordnet synonyms, and then stemmed tokens. We can calculate precision, recall, and F-measure, wheremis the number of aligned unigrams between candidate and reference. Meteor is defined as:
M= (1−Pen)·Fmean
Pen=γ
ch
m θ
Fmean=αP+ (PR1−α)R
P=|unigrams in candidate|m| |
R= |m|
|unigrams in reference|
We calculated the Meteor scores using release 1.4.0 with the package-provided free parameter settings of 0.85, 0.2, 0.6, and 0.75 for the matching compo-nents. Meteor has not yet been reported to evaluate
Flickr 8K co-efficient n=17,466
E&K (2013) co-efficient
n=2,040
METEOR 0.524 0.233
ROUGE SU-4 0.435 0.188
SmoothedBLEU 0.429 0.177
UnigramBLEU 0.345 0.097
[image:3.595.111.251.572.705.2]TER -0.279 -0.044
Table 1: Spearman’s correlation co-efficient of au-tomatic evaluation measures against human judge-ments. All correlations are significant at p<0.001.
the performance of different models on the image description task; a higher Meteor score is better. 2.3 Protocol
We performed the correlation analysis as follows. The sentence-level evaluation measures were cal-culated for each image–description–reference tu-ple. We collected the BLEU, TER, and Meteor
scores using MultEval (Clark et al., 2011), and the
ROUGE-SU4 scores using the RELEASE-1.5.5.pl
script. The evaluation measure scores were then compared with the human judgements using Spear-man’s correlation estimated at the sentence-level.
3 Results
Table 1 shows the correlation co-efficients between automatic measures and human judgements and Figures 2(a) and (b) show the distribution of scores for each measure against human judgements. To classify the strength of the correlations, we fol-lowed the guidance of Dancey and Reidy (2011), who posit that a co-efficient of 0.0–0.1 is uncor-related, 0.11–0.4 is weak, 0.41–0.7 ismoderate, 0.71–0.90 isstrong, and 0.91–1.0 isperfect.
On the Flickr8k data set, all evaluation measures can be classified as eitherweaklycorrelated or mod-eratelycorrelated with human judgements and all results are significant. TER is only weakly
cor-related with human judgements but could prove useful in comparing the types of differences be-tween models. An analysis of the distribution of
TERscores in Figure 2(a) shows that differences in
candidate and reference length are prevalent in the image description task. UnigramBLEUis also only
0 20 40 60 80 100
METEOR ρ= 0.524
1
2
3
4
0.0 0.2 0.4 0.6
ROUGE-SU4 ρ= 0.435
1
2
3
4
0 20 40 60 80 100
Smoothed BLEU ρ= 0.429
1
2
3
4
0 20 40 60 80 100
Unigram BLEU ρ= 0.345
1
2
3
4
0 100 200 300 400
TER ρ= -0.279
1
2
3
4
Sentence-level automated measure score
Human Judgem
ent
(a) Flick8K data set, n=17,466.
0 20 40 60 80 100
METEOR ρ= 0.233
1
3
5
0.0 0.2 0.4 0.6 0.8
ROUGE-SU4 ρ= 0.188
1
3
5
0 20 40 60 80 100
Smoothed BLEU ρ= 0.177
1
3
5
40 50 60 70 80 90 100
Unigram BLEU ρ= 0.0965
1
3
5
0 50 100 150
TER ρ= -0.0443
1
3
5
Sentence-level automated measure score
Human Judgem
ent
[image:4.595.92.533.63.296.2](b) E&K (2013) data set, n=2,042.
Figure 2: Distribution of automatic evaluation measures against human judgements.ρis the correlation between human judgements and the automatic measure. The intensity of each point indicates the number of occurrences that fall into that range.
Figure 2(a) shows an almost uniform distribution of unigramBLEUscores, regardless of the human
judgement. SmoothedBLEUandROUGE-SU4 are
moderately correlated with human judgements, and the correlation is stronger than with unigramBLEU.
Finally, Meteor is most strongly correlated mea-sure against human judgements. A similar pattern is observed in the Elliott and Keller (2013) data set, though the correlations are lower across all mea-sures. This could be caused by the smaller sample size or because the descriptions were generated by a computer, and not retrieved from a collection of human-written descriptions containing the gold-standard text, as in the Flickr8K data set.
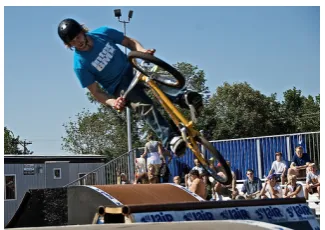
Qualitative Analysis
Figure 3 shows two images from the test collec-tion of the Flickr8K data set with a low Meteor score and a maximum human judgement of seman-tic correctness. The main difference between the candidates and references are in decidingwhatto describe (content selection), andhowto describe it (realisation). We can hypothesise that in both trans-lation and summarisation, the source text acts as a lexical and semantic framework within which the translation or summarisation process takes place. In Figure 3(a), the authors of the descriptions made different decisions onwhatto describe. A decision
has been made to describe the role of the officials in the candidate text, and not in the reference text. The underlying cause of this is an active area of research in the human vision literature and can be attributed to bottom-up effects, such as saliency (Itti et al., 1998), top-down contextual effects (Torralba et al., 2006), or rapidly-obtained scene properties (Oliva and Torralba, 2001). In (b), we can see the problem of deciding how to describe the selected content. The reference uses a more specific noun to describe the person on the bicycle than the candidate.
4 Discussion
There are several differences between our analysis and that of Hodosh et al. (2013). First, we report Spearman’sρcorrelation coefficient of automatic measures against human judgements, whereas they report agreement between judgements and auto-matic measures in terms of Cohen’sκ. The use of
Candidate: Football players gathering to con-test something to collaborating officials. Reference: A football player in red and white is holding both hands up.
(a)
Candidate: A man is attempting a stunt with a bicycle.
Reference: Bmx biker Jumps off of ramp.
[image:5.595.322.485.60.175.2](b)
Figure 3: Examples in the test data with low Meteor scores and the maximum expert human judgement. (a) the candidate and reference are from the same image, and show differences inwhatto describe, in (b) the descriptions are retrieved from different images and show differences inhowto describe an image.
some of which go beyond unigram matchings be-tween references and candidates, whereas they only report unigramBLEU and unigramROUGE. It is
therefore difficult to directly compare the results of our correlation analysis against Hodosh et al.’s agreement analysis, but they also reach the conclu-sion that unigramBLEUis not an appropriate
mea-sure of image description performance. However, we do find stronger correlations with Smoothed
BLEU, skip-bigramROUGE, and Meteor.
In contrast to the results presented here, Reiter and Belz (2009) found no significant correlations of automatic evaluation measures against human judgements of theaccuracyof machine-generated weather forecasts. They did, however, find signif-icant correlations of automatic measures against fluencyjudgements. There are no fluency judge-ments available for Flickr8K, but Elliott and Keller (2013) report grammaticality judgements for their data, which are comparable to fluency ratings. We failed to find significant correlations between gram-matlicality judgements and any of the automatic measures on the Elliott and Keller (2013) data. This discrepancy could be explained in terms of the dif-ferences between the weather forecast generation and image description tasks, or because the image description data sets contain thousands of texts and a few human judgements per text, whereas the data sets of Reiter and Belz (2009) included hundreds of texts with 30 human judges.
5 Conclusions
In this paper we performed a sentence-level corre-lation analysis of automatic evaluation measures against expert human judgements for the automatic image description task. We found that sentence-level unigramBLEUis only weakly correlated with
human judgements, even though it has extensively reported in the literature for this task. Meteor was found to have the highest correlation with human judgements, but it requires Wordnet and paraphrase resources that are not available for all languages. Our findings held when judgements were made on human-written or computer-generated descriptions.
The variability in what and how people describe images will cause problems for all of the measures compared in this paper. Nevertheless, we propose that unigram BLEU should no longer be used as
an objective function for automatic image descrip-tion because it has a weak correladescrip-tion with human accuracy judgements. We recommend adopting either Meteor, SmoothedBLEU, orROUGE-SU4
be-cause they show stronger correlations with human judgements. We believe these suggestions are also applicable to the ranking tasks proposed in Hodosh et al. (2013), where automatic evaluation scores could act as features to a ranking function.
Acknowledgments
References
Jonathon H. Clark, Chris Dyer, Alon Lavie, and Noah A. Smith. 2011. Better hypothesis testing for statistical machine translation: Controlling for op-timizer instability. In Proceedings of the 49th An-nual Meeting of the Association for Computational Linguistics: Human Language Technologies, pages 176–181, Portland, Oregon, USA.
Christine Dancey and John Reidy, 2011. Statistics Without Maths for Psychology, page 175. Prentice Hall, 5th edition.
Desmond Elliott and Frank Keller. 2013. Image De-scription using Visual Dependency Representations. In Proceedings of the 2013 Conference on Empiri-cal Methods in Natural Language Processing, pages 1292–1302, Seattle, Washington, U.S.A.
Ali Farhadi, Mohsen Hejrati, Mohammad Amin Sadeghi, Peter Young, Cyrus Rashtchian, Julia Hockenmaier, and David Forsyth. 2010. Every picture tells a story: generating sentences from im-ages. InProceedings of the 11th European Confer-ence on Computer Vision, pages 15–29, Heraklion, Crete, Greece.
Pedro F. Felzenszwalb, Ross B. Girshick, David McAllester, and Deva Ramanan. 2010. Object Detection with Discriminatively Trained Part-Based Models.IEEE Transactions on Pattern Analysis and Machine Intelligence, 32(9):1627–1645.
Matthieu Guillaumin, Thomas Mensink, Jakob J. Ver-beek, and Cornelia Schmid. 2009. Tagprop: Dis-criminative metric learning in nearest neighbor mod-els for image auto-annotation. InIEEE 12th Interna-tional Conference on Computer Vision, pages 309– 316, Kyoto, Japan.
Micah Hodosh, Peter Young, and Julia Hockenmaier. 2013. Framing Image Description as a Ranking Task : Data , Models and Evaluation Metrics. Jour-nal of Artificial Intelligence Research, 47:853–899. Laurent Itti, Christof Koch, and Ernst Niebur. 1998.
A model of saliency-based visual attention for rapid scene analysis. IEEE Transactions on Pattern Anal-ysis and Machine Intelligence, 20(11):1254–1259. Girish Kulkarni, Visruth Premraj, Sagnik Dhar, Siming
Li, Yejin Choi, Alexander C. Berg, and Tamara L. Berg. 2011. Baby talk: Understanding and gener-ating simple image descriptions. InThe 24th IEEE Conference on Computer Vision and Pattern Recog-nition, pages 1601–1608, Colorado Springs, Col-orado, U.S.A.
Polina Kuznetsova, Vicente Ordonez, Alexander C. Berg, Tamara L. Berg, and Yejin Choi. 2012. Col-lective Generation of Natural Image Descriptions. InProceedings of the 50th Annual Meeting of the As-sociation for Computational Linguistics, pages 359– 368, Jeju Island, South Korea.
Siming Li, Girish Kulkarni, Tamara L. Berg, Alexan-der C. Berg, and Yejin Choi. 2011. Composing simple image descriptions using web-scale n-grams. In Fifteenth Conference on Computational Natural Language Learning, pages 220–228, Portland, Ore-gon, U.S.A.
Margaret Mitchell, Jesse Dodge, Amit Goyal, Kota Ya-maguchi, Karl Stratos, Alyssa Mensch, Alex Berg, Tamara Berg, and Hal Daum´e III. 2012. Midge : Generating Image Descriptions From Computer Vi-sion Detections. In Proceedings of the 13th Con-ference of the European Chapter of the Association for Computational Linguistics, pages 747–756, Avi-gnon, France.
Aude Oliva and Antonio Torralba. 2001. Modeling the Shape of the Scene: A Holistic Representation of the Spatial Envelope. International Journal of Com-puter Vision, 42(3):145–175.
Vicente Ordonez, Girish Kulkarni, and Tamara L. Berg. 2011. Im2Text: Describing Images Using 1 Million Captioned Photographs. In Advances in Neural In-formation Processing Systems 24, Granada, Spain. Ehud Reiter and A Belz. 2009. An investigation into
the validity of some metrics for automatically evalu-ating natural language generation systems. Compu-tational Linguistics, 35(4):529–558.
Antonio Torralba, Aude Oliva, Monica S. Castelhano, and John M. Henderson. 2006. Contextual guid-ance of eye movements and attention in real-world scenes: the role of global features in object search.
Psychologial Review, 113(4):766–786.