Cold Rolling Texture of Ni-Based L1
2Ordered Intermetallic Alloys
Yasuyuki Kaneno, Akira Takahashi
*and Takayuki Takasugi
Department of Materials Science, Graduate School of Engineering, Osaka Prefecture University, Sakai, 599-8531 Japan
Cold rolling textures of three kinds of Ni-based intermetallic alloys with L12ordered structure (i.e., Ni3(Si,Ti), Ni3Al, and Ni3Fe) were
investigated by the orientation distribution function (ODF). For comparison, the rolling texture of pure nickel with fcc disordered structure was also determined. The rolling textures of the 70% and 90% cold-rolled L12alloys as well as fcc nickel are composed of the-fiber ({011}h100i
(G){011}h211i(Bs)) and-fiber ({112}h111i(C){123}h634i(S){011}h211i(Bs)) components, but the {011}h211i(Bs) (and also the {011}h100i(G)) orientation is remarkable in the L12alloys while the {123}h634i(S) (and also the {112}h111i(C)) orientation is prominent in
fcc nickel. Moreover, the intensity of rolling texture in the L12alloys depended on materials (i.e., constituent elements). The observed rolling
texture of the L12ordered alloys was discussed in terms of cross slips of extended dislocations whose width was estimated by the energies of
stacking-fault-like defect (SFLD) (i.e., antiphase boundary (APB) in the case of L12ordered structure and stacking fault (SF) in the case of fcc
disordered structure). [doi:10.2320/matertrans.47.1485]
(Received December 8, 2005; Accepted April 7, 2006; Published June 15, 2006)
Keywords: intermetallic alloy, ordered alloy, deformation texture, cross slip, orientation distribution function
1. Introduction
There are many kinds of Ni3X type intermetallic ordered alloys. Among them, Ni3Al and Ni3(Si,Ti) ordered alloys
with L12 crystal structure, which is derived from A1 (fcc)
structure, have attracted considerable attention because these ordered alloys show a positive temperature dependence of
yield strength (i.e., high strength at elevated temperatures)
and also good properties in oxidizing and corrosive
atmo-sphere.1,2)In addition, by micro-3)and macro-alloying,2)both
the polycrystalline Ni3Al and Ni3(Si,Ti) alloys can be
plastically deformed in air at ambient temperature,3,4)
where-as most of intermetallic compounds suffer from a limited
ductility at ambient temperature. On the other hand, Ni3Fe
shows order (L12)disordered (fcc) transition at Tc¼
776K and the ordered Ni3Fe as well as the disordered one
exhibits a considerable tensile ductility at ambient
temper-ature.5)Therefore, microstructure control by
thermomechan-ical processing is applicable to these deformable ordered alloys. Microstructural factors such as grain size, crystallo-graphic texture and grain boundary character, which notice-ably affect material properties are substantially changed through the thermomechanical process. Previous studies on
deformation texture for Ni-based L12 ordered alloys have
been mostly focused on Ni3Al doped with boron,6–10)but few
studies for other Ni-based L12 ordered alloys have been
conducted so far.11) A comprehensive understanding for
texture development during cold rolling of L12ordered alloys
is much needed not only in the scientific interest but also in the practical application of intermetallic compounds.
In the present study, polycrystalline Ni3Al, Ni3(Si,Ti) and
Ni3Fe ordered alloys with L12 structure, together with pure
nickel with fcc structure, were cold-rolled to 90% reduction. The cold rolling textures were investigated in terms of the ordered state and the constituent elements. Further, the
texture development during cold rolling of L12ordered alloys
was discussed in association with cross slips of extended
superlattice dislocations whose width was calculated by using the reported values of stacking-fault-like defect
(SFLD) energies (i.e., antiphase boundary (APB) energy in
the case of L12 ordered structure and stacking fault (SF)
energy in the case of fcc disordered structure).
2. Experimental
Raw materials used in this study were 99.9 mass% nickel, 99.999 mass% silicon, 99.9 mass% titanium, 99.99 mass% aluminum, 99.99 mass% iron and 99.5 mass% boron. A
Ni3(Si,Ti) alloy with a nominal composition of 79.0 at% Ni,
11.0 at% Si, 10.0 at% Ti and 50 mass.ppm B, a Ni3Al alloy
with a nominal composition of 76.0 at% Ni, 24.0 at% Al and
500 mass.ppm B, and a stoichiometric Ni3Fe alloy with a
nominal composition of 75.0 at% nickel and 25.0 at% Fe were prepared by arc melting in an argon gas atmosphere on a copper hearth using a non-consumable tungsten electrode. Homogenization heat treatment was conducted in a vacuum at 1323 K for 48 h for Ni3(Si,Ti) and Ni3Al, and at 1373 K for 48 h for Ni3Fe, followed by furnace cooling. Homogenized ingots were rolled at 573 K for Ni3(Si,Ti) and Ni3Al, and at room temperature for Ni3Fe, and then annealed at 1273 K for
5 h for Ni3(Si,Ti) and Ni3Al, and at 1023 K for 2 h for Ni3Fe,
respectively. This procedure was repeated several times until
a desired thickness (4{5mm) was obtained. To obtain
starting material, the rolled material was finally annealed at
1273 K for 5 h (Ni3(Si,Ti) and Ni3Al), and at 1023 K for 2 h
(Ni3Fe), respectively. Further, for Ni3Fe, the ordered
speci-men was prepared by annealing at 743 K for 30 days followed by furnace cooling. The degree of long-range order obtained in the ordered Ni3Fe specimen is assumed to be
approx-imately more than 0.9.12,13)For comparison, a fully-annealed
commercially available pure nickel with purity of 99.7 mass% was also used. These starting materials were cold-rolled at room temperature to 70% and 90% reduction. Deformed microstructure in the longitudinal sections of specimens was observed by an optical microscope. Textures in a central layer along the thickness of a sheet were
measured by CuKradiation. Three incomplete pole figures,
{111}, {200} and {220} were measured up to a maximal tilt
angle of 75by the Schultz reflection method14)and corrected
with respect to defocusing error by using the randomly oriented powder sample. From these pole figures, the complete orientation distribution functions (ODFs) including odd terms for ghost correction were determined up to an
order of l¼22 by the iterative series expansion method,
using positivity conditions in pole figures and an ODF.15,16)
3. Results
The starting materials before cold rolling show a fully-recrystallized microstructure and have almost no preferential
orientation (i.e., random texture). Initial grain sizes of L12
ordered alloys are in the range of100{200mmwhile those
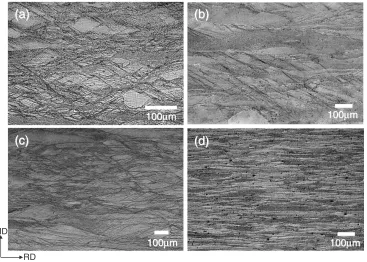
of fcc nickel are less than100mm. Figure 1 shows optical
micrographs of the longitudinal section of the 70% cold-rolled materials. Obviously, inhomogeneously deformed
microstructures are evolved in the Ni3(Si,Ti), Ni3Al and
Ni3Fe ordered alloys while homogeneously elongated grains
along rolling direction are developed in pure nickel. For
Ni3(Si,Ti), Ni3Al and Ni3Fe, shear bands are extensively
formed. These shear bands are mostly extended across several grains, and have been repeatedly observed in rolled
Ni3Al by other researchers.7,9,10) A similar feature of the
deformed microstructures are observed in the 90% cold-rolled materials: the shear bands are more intensively formed in Ni3(Si,Ti), Ni3Al and Ni3Fe but not in pure nickel.
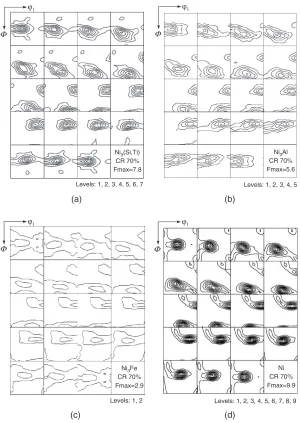
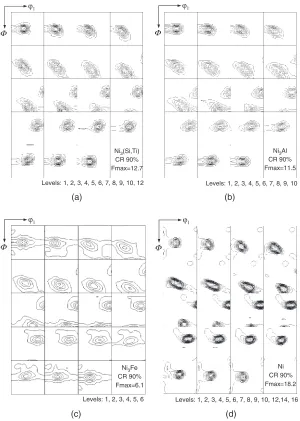
The’2sections of ODFs for the 70% and 90% cold-rolled
materials are given in Figs. 2 and 3, respectively. Some ideal orientations observed in the present materials are illustrated in Fig. 4. It is well known that rolling texture of
fcc materials is divided into two types,i.e. copper type(pure
metal type) andbrass type(alloy type), and also that nickel as
well as copper and aluminum typically show the copper type
rolling texture.17) The main features such as preferred
orientations and orientation spread in the rolling textures of
the L12 ordered alloys are basically similar to those for the
rolling texture of nickel, but the intensity of rolling textures is
significantly lower in the L12 ordered alloys than in fcc
disordered nickel. Moreover, the intensity of the rolling
texture is different among the L12 ordered alloys.
Figures 5(a) and (b) show texture index J18)(i.e., intensity
of texture) for the 70% and 90% cold-rolled materials,
respectively. Texture indexJ, which is a single parameter to
characterize the intensity of texture, is defined by the follows:
J¼
I
½fðgÞ2dg ð1Þ
Here, fðgÞ represents the orientation distribution function
(i.e., an orientation density) of the crystallites of a
poly-crystalline material. The texture indexJvaries between 1 in
the case of random orientation and1in the case of one or
more ideal single orientations.18)It is apparent from Fig. 5
that the intensity of L12rolling textures decreases in the order
of Ni3(Si,Ti), Ni3Al and Ni3Fe, and also the discrepancy
among four materials becomes larger in 90% reduction than in 70% reduction.
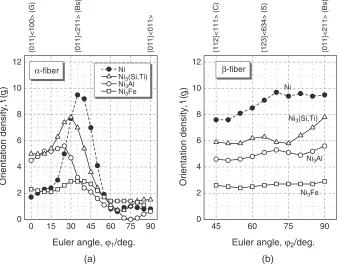
The copper type rolling texture is known to be composed
of the-fiber that has orientation spread from the {011}h100i
(G) orientation to the {011}h211i (Bs) orientation, and
-fiber that runs from the {112}h111i(C) orientation, through
the {123}h634i (S) orientation, to the {011}h211i (Bs)
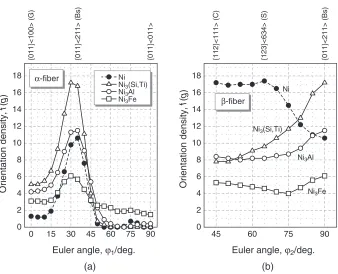
orientation.17)Figures 6 and 7 show the orientation density
along the - and -fibers in the rolling textures for the (a)
70% and (b) 90% cold-rolled materials, respectively.
Gen-erally, the copper type rolling texture of the heavily (e.g.
more than 90% reduction) rolled metals and alloys consists of 100µm
100µm
(c)
(c)
RD ND
100µm
100µm
(b)
(b)
100µm
100µm
(a)
(a)
100µm
100µm
(d)
(d)
[image:2.595.118.485.72.334.2]a weak -fiber and strong -fiber in which the S and C
orientations are stronger than the Bs orientation,19)as actually
observed in the 90% cold-rolled pure nickel (Fig. 7). For the 70% cold-rolled materials, the S and also C orientations are not so much developed compared with the Bs orientation
even in the case of nickel (Fig. 6b). For Ni3(Si,Ti) and Ni3Al,
the orientation distribution curves along the -fiber show a
peak at the Bs orientation and those along the-fiber show a
distinctive high orientation density from the G to Bs orientations, as clearly seen in Fig. 7. This result suggests that the texture transition from the copper type to brass type somewhat occurs in the Ni3(Si,Ti) and Ni3Al ordered alloys.
In the case of Ni3Fe, the trend for the - and -fibers is
essentially the same as that for Ni3(Si,Ti) and Ni3Al though the orientation density in Ni3Fe is considerably low in comparison with that in Ni3(Si,Ti) and Ni3Al.
4. Discussion
The observed rolling textures of the cold-rolled Ni-based
L12 ordered alloys are composed of the - and -fiber
components. Basically, this textural feature is similar to that of fcc materials with medium or high stacking fault energy. In general, deformation texture is formed by crystal lattice rotation due to slip deformation. Slip system for L12-type
ordered structure is the same as that for fcc structure, i.e.
h101i{111}. Therefore, it is deduced that deformation texture
developed in L12ordered alloys is fundamentally the same as
that developed in fcc materials.
When comparing rolling textures of the L12ordered alloys
with those of fcc disordered nickel, intensity and main component of rolling textures are different between them.
First, intensity of the rolling textures in the L12 ordered
alloys is low in comparison with that in the fcc disordered
nickel. Secondly, the Bs and also G orientations (i.e.,-fiber)
are prominent in the L12 ordered alloys while the S and C
orientations (i.e., a typical main component of the-fiber in
heavily rolled copper, aluminum and nickel, etc.) are marked in fcc nickel. The difference in the observed rolling textures
between the L12ordered and fcc disordered materials seems
Ni3(Si,Ti)
CR 70% Fmax=7.8
ϕ1
(a)
Levels: 1, 2, 3, 4, 5, 6, 7
Ni3Al
CR 70% Fmax=5.6
ϕ1
Φ
(b)
Levels: 1, 2, 3, 4, 5
Φ
Ni3Fe
CR 70% Fmax=2.9
ϕ1
(c)
Levels: 1, 2
Ni CR 70% Fmax=9.9
(d)
Levels: 1, 2, 3, 4, 5, 6, 7, 8, 9
ϕ1
Φ Φ
Fig. 2 ’2sectionsð’2¼0;5;. . .;90Þof the orientation distribution functions (ODFs) of 70% cold-rolled (a) Ni3(Si,Ti), (b) Ni3Al,
[image:3.595.149.449.72.495.2]to be associated with the difficulty of octahedral cross slips from {111} to {111} planes. The difficulty or the easiness of octahedral cross slip is closely related to the width of extended dislocations; the larger the width of extended dislocation becomes, the harder the octahedral cross slip becomes. The width of the extended dislocations is inversely proportional to the energy of the stacking-fault-like defect
(i.e., antiphase boundary in the case of L12ordered structure
or stacking fault in the case of fcc disordered structure). Consequently, it is deduced that the octahedral cross slip becomes easier and then the deformation texture becomes more intense with increasing energy of the stacking-fault-like defect.
Here, let us estimate the width of extended dislocations. It
has been reported that the superlattice dislocation h110i in
Ni3(Si,Ti),20) Ni3Al1) and Ni3Fe21) is dissociated into two
1/2h110i dislocations bounded for the antiphase boundary
(APB), while the dislocation 1/2h110i in fcc nickel is
dissociated into two Shockley partials 1/6h211ibounded for
the stacking fault (SF). These dissociation manners of
dislocations are expressed by the following schemes;
ah110i ¼a=2h110i þAPBþa=2h110i
(for L12 structure) ð2Þ
a=2h110i ¼a=6h211i þSFþa=6h121i
(for fcc structure) ð3Þ
Here,a is lattice parameter. The width (w) of the extended
dislocation for the L12ordered alloys is given as follows:22)
w¼ Gb
2
h
2APB
cos2’þsin
2’
1
ð4Þ
Similarly,wfor fcc materials is given as follows:23)
w¼ Gb
2
h
8SF
2
1 1
2
2cos 2’
ð5Þ
Here, Gis the shear modulus, bh is the Burgers vector for
super partial dislocation in the case of L12ordered alloys and
for Shockley partial dislocation in the case of fcc material,
APBis the antiphase boundary energy per unit area,SFis the
Ni3(Si,Ti)
CR 90% Fmax=12.7
ϕ1
(a)
Levels: 1, 2, 3, 4, 5, 6, 7, 8, 9, 10, 12
Ni3Al
CR 90% Fmax=11.5
ϕ1
(b)
Levels: 1, 2, 3, 4, 5, 6, 7, 8, 9, 10
Φ Φ
Ni3Fe
CR 90% Fmax=6.1
ϕ1
(c)
Levels: 1, 2, 3, 4, 5, 6
(d)
Levels: 1, 2, 3, 4, 5, 6, 7, 8, 9, 10, 12,14, 16
ϕ1
Ni CR 90% Fmax=18.2
Φ Φ
Fig. 3 ’2sectionsð’2¼0;5;. . .;90Þof the orientation distribution functions (ODFs) of 90% cold-rolled (a) Ni3(Si,Ti), (b) Ni3Al,
[image:4.595.149.449.73.494.2]stacking fault energy per unit area,’is the angle between the dislocation and the Burgers vector of the perfect dislocation
(’¼0in the case of screw dislocations and’¼90 in the
case of edge dislocations),is the Poisson’s ratio (¼1=3
was used in the present calculation). The lattice parameters
(a) of Ni3(Si,Ti), Ni3Al Ni3Fe and nickel are 0.3552,24)
0.3572,25) 0.355026) and 0.3524 nm,27) respectively. b
h is
given as a=pffiffiffi2 for the L12 alloys anda=
ffiffiffi
6
p
for fcc nickel,
respectively. The shear modulus (G) of Ni3(Si,Ti), Ni3Al
Ni3Fe and nickel has been reported as 84.7, 77.0, 79.2 and
86.5 GPa, respectively.28) Also, the values of
APB for
Ni3(Si,Ti), Ni3Al and Ni3Fe have been reported to be 215
(35),29)180 (20)30)and 133 (8)21)mJ/m2, respectively,
while the value of SF for nickel has been reported to be
Fig. 4 Some ideal orientations in Euler angle space. 1 2 3 4 5 6 7
Ni Ni3Al Ni3(Si,Ti)
Ni3Fe
Texture index,
J
1 2 3 4
Ni Ni3Al Ni3(Si,Ti)
Ni3Fe
Texture index,
J
(a)
(b)
Fig. 5 Texture index J18) for the (a) 70% and (b) 90% cold-rolled materials.
45 60 75 90
0 2 4 6 8 10 12
Euler angle, ϕ2/deg.
{112}<111> (C) {123}<634> (S) {011}<211> (Bs)
Orientation density,
f
(
g
)
β-fiber
Ni
Ni3(Si,Ti)
Ni3Al
Ni3Fe
0 15 30 45 60 75 90
0 2 4 6 8 10 12
Euler angle, ϕ1/deg.
α-fiber Ni
Ni3(Si,Ti)
Ni3Al
Ni3Fe
{011}<100> (G) {011}<211> (Bs) {011}<011>
Orientation density,
f
(
g
)
(a) (b)
[image:5.595.70.269.69.325.2] [image:5.595.327.528.79.362.2] [image:5.595.130.469.503.772.2]128 mJ/m2.31)By using these values, the width of extended dislocations can be calculated from equations (4) and (5). The results are summarized in Table 1. It is apparent from Table 1 that the width of both screw and edge dislocations is
significantly larger in the L12 ordered alloys than in fcc
disordered nickel. Also, it should be noted that the width of extended dislocations of the present Ni-based intermetallic alloys is considerably smaller than that of copper with
medium SF (80mJ/m2)31) in which width of extended
dislocations is estimated to be 1:1nm for screw
disloca-tions and 3:0nm for edge dislocations, respectively.32)
Actually, using by a transmission electron microscope (TEM), these widely extended (or dissociated) dislocations
have been observed e.g. for Ni3(Si,Ti),30) Ni3Al33) and
Ni3Fe34) deformed at low temperature. Furthermore, the
width of extended (screw) dislocations increases in the order of Ni (0.835 nm), Ni3(Si,Ti) (3.69 nm), Ni3Al (4.34 nm) and Ni3Fe (6.40 nm). This result is consistent well with the order of the intensity of the observed rolling textures (Fig. 5). As mentioned above, octahedral cross slips become more
difficult with increasing width of the extended dislocations.
As a result, the development of the -fiber texture is
suppressed and alternatively the Bs (and G) orientation (the
-fiber texture) remains as a main component of rolling
textures in the L12 ordered alloys. Moreover, these
dis-sociated superlattice dislocation bounded for the APB may lead to unusual (and various) crystal lattice rotation in the
L12 ordered structure different from that in fcc disordered
materials, resulting in weak deformation texture. It appears that such unusual crystal lattice rotation is a unique phenomenon in ordered intermetallic alloys in which widely extended superlattice dislocations are operated. Strictly describing, here, superlattice dislocations introduced in
ordered Ni3Fe show a four-fold dissociation scheme,21)i.e.,
ah101i ¼a=6h211i þCSFþa=6h112i þAPB
þa=6h211i þCSFþa=6h112i
ðCSF: complex stacking faultÞ:
It is therefore considered that cross slips hardly occur and at the same time unusual (unexpected) crystal rotation occurs in this case.
The texture transition from the copper-type to brass-type
has been often related to deformation twins,35–37) as have
been observed in -brass with a low stacking energy.
Concerning this point, TEM observations have been made so far and consequently, no deformation twins have been
observed for the 90% cold-rolled Ni3(Si,Ti)38) and for the
cold-rolled Ni3Al.39)As far as the present authors know, there
are no previous works reporting the deformation twins activated in Ni3X type ordered alloys deformed at low temperature. Therefore, an idea that the deformation twin is closely associated with the formation of the texture in L12-type Ni3X ordered alloys is excluded from the realistic
45 60 75 90
0 2 4 6 8 10 12 14 16 18
Euler angle, ϕ2/deg.
{112}<111> (C) {123}<634> (S) {011}<211> (Bs)
Orientation density,
f
(
g
)
β-fiber
Ni
Ni3(Si,Ti)
Ni3Al
Ni3Fe
0 15 30 45 60 75 90
0 2 4 6 8 10 12 14 16 18
Euler angle, ϕ1/deg.
α-fiber Ni
Ni3(Si,Ti)
Ni3Al
Ni3Fe
{011}<100> (G) {011}<211> (Bs) {011}<011>
Orientation density,
f
(
g
)
(a) (b)
[image:6.595.130.468.66.340.2]Fig. 7 Orientation densityfðgÞof orientations along the (a)-fiber and (b)-fiber for the 90% cold-rolled materials.
Table 1 Calculated width of extended dislocations for Ni3(Si,Ti), Ni3Al,
Ni3Fe and nickel. Values of lattice parameter (a), the Burgers vector (bh),
shear modulus (G), stacking fault energy (SF) and antiphase boundary energy (APB) quote from the literatures.
Ni3Fe Ni3Al Ni3(Si,Ti) Ni
a(nm) 0.355224Þ 0.357225Þ 0.355026Þ 0.352427Þ
bh(nm) 0.2512 0.2526 0.2510 0.1439
G(GPa) 84.728Þ 77.028Þ 79.228Þ 86.528Þ
SF(mJ/m2) — — — 12831Þ
APB(mJ/m2) 13321Þ 18030Þ 21529Þ — w(screw,’¼0) (nm) 6.40 4.34 3.69 0.835
[image:6.595.46.291.428.528.2]explanation. On the other hand, inhomogeneous deformation such as shear banding may result in a weak deformation texture. It has been reported that grains formed by shear bands have widely spread grain orientations, resulting in a weak cube recrystallization textures for polycrystalline fcc
copper.40) However, to furthermore clarify the rolling
textures in the L12 ordered alloys, more extensive studies,
particularly on the deformed microstructures, are required.
5. Conclusion
Polycrystalline Ni3(Si,Ti), Ni3Al, and Ni3Fe alloys with
L12 ordered structure, together with pure nickel with fcc
disordered structure, were cold-rolled up to 90% reduction and then rolling textures were determined. The rolling texture
of the 70% and 90% cold-rolled L12alloys was composed of
the - and-fiber components similar to that of fcc nickel,
but the {011}h211i (Bs) (and also the {011}h100i (G))
orientation is remarkable in the L12 alloys while the
{123}h634i (S) orientation is prominent in fcc nickel
Moreover, the intensity of rolling texture in the L12 alloys
depended on materials (i.e., constituent elements): the
intensity of the rolling texture increases in the order of nickel, Ni3(Si,Ti), Ni3Al and Ni3Fe. These results can be interpreted by consideration of cross slips for superlattice dislocations and ordinary dislocation whose width are estimated by energies of stacking-fault-like defect (SFLD)
(i.e., antiphase boundary (APB) in the case of L12 ordered
structure and stacking fault (SF) in the case of fcc disordered structure).
Acknowledgements
This work was supported in part by the Grant-in-aid for Scientific Research from the Ministry of Education, Culture, Sports and Technology, Japan.
REFERENCES
1) N. S. Stoloff and C. T. Liu:Physical Metallurgy and Processing of Intermetallic Compounds, edited by N. S. Stoloff and V. K. Sikka (Chapman & Hall, New York, N.Y., 1996) pp. 159–211.
2) T. Takasugi, M. Nagashima and O. Izumi: Acta Metall. Mater. 38
(1990) 747–755.
3) K. Aoki and O. Izumi: J. Japan Inst. Met.43(1979) 1190–1196. 4) T. Takasugi, S. Rikukawa and S. Hanada: Acta Metal. Mater.40(1992)
1895–1906.
5) H. Sakurai, H. Makita, S. Hanada and O. Izumi:Proc. of Recrystal-lization ’90, edited by T. Chandra (The Minerals, Metals and Materials Society, Warrendale, PA, 1990) pp. 623–628.
6) G. Gottstein, G. P. Nagpal and W. Kim: Mater. Sci. Eng.A108(1989) 165–179.
7) J. Ball and G. Gottstein: Intermetallics1(1993) 171–185.
8) C. Escher, S. Neves and G. Gottstein: Acta Mater.46(1998) 441–450. 9) S. G. Chowdhury, R. K. Ray and A. K. Jena: Mater. Sci. Eng.A277
(2000) 1–10.
10) B. Bhattacharya and R. K. Ray: Metall. Mater. Trans.31A(2000) 3011–3021.
11) Y. Kaneno, I. Nakaaki and T. Takasugi: Intermetallics10(2002) 693– 700.
12) D. G. Morris, G. T. Brown, R. C. Piller and R. E. Smallman: Acta Metal.24(1976) 21–28.
13) T. Takasugi, T. Eguchi, M. Yoshida and O. Izumi: J. Japan Inst. Met.53
(1989) 34–41.
14) L. G. Schulz: J. Appl. Phys.29(1949) 1030–1033.
15) M. Dahms and H. J. Bunge: J. Appl. Crys.22(1989) 439–447. 16) H. Inoue and N. Inakazu: J. Jpn. Inst. Metals58(1989) 892–898. 17) F. J. Humphreys and M. Hatherly: Recrystallization and Related
Annealing Phenomena(Elsevier Science, Oxford, U.K., 1995) pp. 44– 49.
18) H. J. Bunge: Texture Analysis in Materials Science (Butterworth, London, U.K., 1982) p. 88.
19) J. Hirsch and K. Lu¨cke: Acta Metall.11(1988) 2863–2882. 20) M. Yoshida and T. Takasugi: Phil. Mag.A65(1992) 41–52. 21) A. Korner and H. P. Karnthaler: Phil. Mag.A52(1985) 29–38. 22) N. S. Stoloff:Strengthening Methods in Crystals, edited by A. Kelly
and R. B. Nicholson (Elsevier Publishing Company, LTD, Amsterdam, Holland, 1971) p. 206.
23) L. E. Murr: Interfacial Phenomena in Metals and Alloys (Addison-Wesley Publishing Company, Reading, Mass., 1975) p. 144. 24) T. Takasugi, O. Shindo, O. Izumi and M. Hirabayashi: Acta Metal.
Mater.38(1990) 739–745.
25) N. Masahashi, T. Takasugi and O. Izumi: Acta Metall.36(1988) 1815– 1822.
26) T. Takasugi, T. Eguchi. M. Yoshida and O. Izumi: J. Japan Inst. Met.53
(1989) 34–41.
27) Selected Powder Diffraction Data for Metal and Alloys, edited by S. Weissmann (JCPDS International Centre for Diffraction Data, Swarthmore, PA, 1978) p. 91.
28) H. Yasuda, T. Takasugi and M. Koiwa: Acta Metal. Mater.40(1992) 381–387.
29) K. J. Hemker and M. J. Mills: Phil. Mag.A68(1993) 305–324. 30) M. Yoshida and T. Takasugi:Strength of Materials, ed. by H. Okikawa,
K. Maruyama, S. Takeuchi and M. Yamaguchi (Japan Institute of Metals, Sendai, Japan, 1994) pp. 357–360.
31) L. E. Murr: Interfacial Phenomena in Metals and Alloys (Addison-Wesley Publishing Company, Reading, Mass., 1975) p. 146. 32) A. Seeger and G. Scho¨ck: Acta Metall.1(1953) 519–530.
33) P. Veyssiere and J. Douin: Intermetallic Compounds, ed. by J. H. Westbrook and R. L. Fleischer (John Wiley and Sons, New York, 1995) p. 519.
34) A. Korner: Acta Metal.33(1985) 1399–1406. 35) V. G. Wassermann: Z. Metallk.54(1963) 61–65.
36) H. Hu, R. S. Cline and S. R. Goodman: Recrystallization, Grain Growth and Textures, (American Society for Metals, Metals Park, Ohio, 1965) pp. 295–367.
37) J. Hirsch, K. Lu¨cke and M. Hatherly: Acta Metall.36(1988) 2905– 2927.
38) Y. Kaneno and T. Takasugi: unpublished work.
39) K. Kishida, M. Demura and T. Hirano: Mater. Res. Soc. Symp. Proc.
842(2005) 85–91.