Hydrogen Production from Waste Aluminum at Different Temperatures,
with LCA
Takehito Hiraki
1, Masato Takeuchi
2, Masaaki Hisa
2and Tomohiro Akiyama
1;*1
Center for Advanced Research of Energy Conversion Materials, Hokkaido University, Sapporo 060-8628, Japan
2Department of Chemical Engineering, Osaka Prefecture University, Sakai 599-8531, Japan
The recycling of waste metallic aluminum with high chemical exergy, which consumes a large quantity of electricity in the refining process, is insufficient. In particular, the so-called dross generated during the remelting process a part of recycling requires expensive treatment, particularly when the metallic concentration is less than 20%, before it can be landfilled. The purpose of this study is to produce hydrogen from waste aluminum sources, such as dross, using an aqueous solution of sodium hydroxide in a beaker and an autoclave. During the study, the effects of temperature of the aqueous solution on the rate of hydrogen generation are to be chiefly examined. The result obtained from an XRD analysis showed that the white product that precipitated during the experiments contained aluminum hydroxide, the rate of hydrogen generation significantly increased with the concentration of sodium hydroxide and temperature of the aqueous solution, and the activation energy was 68.4 kJ mol1. In the autoclave experiments, hydrogen is released quickly, along with an increase in the inner pressure to a minimum of 1.0 MPa
and an increase in the temperature above 473 K. The results suggested a possibility of a new cost effective process of hydrogen production from waste aluminum along with the by prodution of sodium hydroxide. The life cycle assessment (LCA) of the proposed process for producing not only 1 kg of hydrogen but also 26 kg aluminum hydroxide from waste aluminum was carried out to assess the energy requirement and amount of carbon dioxide emissions. Results suggest that the energy requirement of our process is only 2% and the amount of carbon dioxide emissions is 4%, in comparison to a conventional method.
(Received November 18, 2004; Accepted March 1, 2005; Published May 15, 2005)
Keywords: waste aluminum, hydrogen generation, aluminum hydroxide, sodium hydroxide aqueous solution, pressurized hydrogen, life cycle assessment
1. Introduction
According to the aluminum data of Japan,1,2) the annual consumption of aluminum in Japan is 3.6 million ton (Mt), of which 2.4 Mt is imported and 1.2 Mt is domestically recycled from waste aluminum through a remelting treatment. Since the amount of aluminum recycling is insufficient, thus we have still not a small missing, unutilized aluminum.3–7)The amount of missing reaches 0.80 Mt in processes such as beverage can production and 0.77 Mt in market places. Furthermore, even if we successfully collect the used aluminum products, 0.30 Mt of dross, containing metallic aluminum as a byproduct, is released into the atmosphere during the remelting process. Metallic aluminum has a high potential with a large chemical exergy. Therefore, the purpose of this study is to understand the manner in which aluminum can be utilized in the process with the help of alkaline solutions to chiefly evaluate the effects of temper-ature of NaOH aqueous solutions on the reaction rate,8,9) explore the possibility of pressurized hydrogen generation, and perform a life cycle assessment (LCA) of this process.
2. Experimental Procedures
A powdered aluminum reagent (Kojundo Chemical Labo-ratory Co., Ltd.) was prepared, having a purity mass% of 99% and a particle size of 180–425mm. Aqueous solutions of NaOH were prepared from a NaOH aqueous solution of 5 mol dm3 (Kishida Chemical Co., Ltd.). The reactor in which the reagent and the diluted solutions were mixed is schematically represented in Fig. 1. Table 1 lists the exper-imental conditions used in this study WAl: the weight of
aluminum reagent,MAl: the molar mass of aluminum,CNaOH: the concentration of NaOH aqueous solutions, VNaOH: the volume of NaOH aqueous solutions, T0: the initial temper-ature of NaOH aqueous solutions. To promote the chemical reaction, the mixture was continuously agitated using an RCN-3 magnetic stirrer (Tokyo Rikakikai Co., Ltd.). The gas generated during the experiments was passed through a
Magnetic stirrer pH meter
PC
Data logger
Flow meter Sample powderin alkaline solution
Dehumidifier
Thermocouple
To Air
GC
[image:1.595.307.547.386.517.2]Fig. 1 Schematic diagram of the experimental apparatus.
Table 1 Experimental conditions for validating the reaction between aluminum and NaOH aqueous solutions and evaluating the effect of temperature of NaOH aqueous solutions on the reaction rate.
Experiment WAl=MAl (mol)
CNaOH (molm3)
VNaOH (m3)
Molar ratio Al/NaOH
T0
(K)
a-1 0.25 500 0.0005 1.00 309.5
b-1 0.03 500 0.0005 0.12 291.2
b-2 0.03 500 0.0005 0.12 313.2
b-3 0.03 500 0.0005 0.12 323.2
b-4 0.03 500 0.0005 0.12 333.2
*Corresponding author, E-mail: takiyama@eng.hokudai.ac.jp
[image:1.595.305.548.592.678.2]dehumidifier and then channeled to a flow meter for volume measurement. A fraction of the generated gas was collected and subjected to a composition analysis by gas chromatog-raphy using a GL Sciences GC-323 chromatograph. Throughout the experiments, the temperature and pH of the NaOH solution were recorded using a TES-1380 pH/ temperature meter (TES Electrical Electronic Corp.) at regular intervals between 10 and 30 s. For the phase identification of the reaction products, X-ray diffractometry (XRD) was carried out using a Rigaku RINT-1500 diffrac-tometer equipped with a rotational Cu anode and a graphite monochromator. To explore the possibility of generating pressurized hydrogen, an autoclave with a safety valve was prepared with the following specifications: an inner volume of 1 dm3 and a maximum pressure of 10 MPa. In the experiments, a data acquisition controller monitored the temperature of the aqueous solution and the changes that occurred in the pressure with time.
3. Results and Discussions
3.1 Description of reaction between aluminum and
NaOH aqueous solution
In the present investigation, the generation of gas bubbles was detected immediately after the aluminum powder and NaOH aqueous solution were mixed in the reactor. The generated gas was identified as high purity hydrogen, the purity of which was higher than 99.9 mol%. As shown in Fig. 2, the generation rate of H2 monotonically increased with reaction time up to 540 s, and beyond this time, it started to decrease. With the generation of H2gas, the temperature of the NaOH aqueous solution rose quickly with the reaction time and reached its maximum at 338 K within 1200 s after the reaction terminated in the reactor. On the other hand, the pH of the NaOH solution gradually decreased with the reaction, implying the formation of Al(OH)4 ions in the
solution. When the reaction time exceeded beyond 1200 s, the temperature of the NaOH solution began to decrease. However, the pH of the solution showed a gradual increase beyond this point. The pH increase was found to be preceded by precipitation that occurred att1000s, and the precip-itation compound was later identified to contain aluminum
hydroxides. Therefore, the variation in the pH after 1200 s is attributable to the decomposition of Al(OH)4 ions into
aluminum hydroxide and OHions.
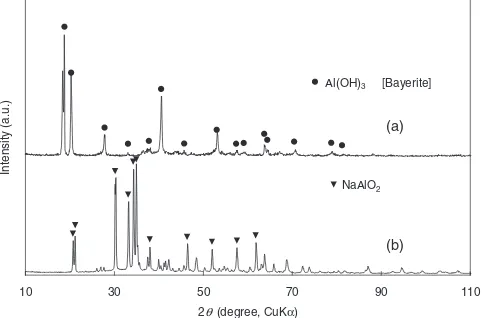
3.2 XRD analysis of reaction products
In the present investigation, it was found that precipitation occurred in two stages. The first precipitation was occurred at the time of reaction between aluminum powders and NaOH aqueous solutions, which occurred in the reactor. Upon completion of this reaction, the precipitate was separated by filtration and examined by XRD. The XRD spectrum of the precipitate, shown in Fig. 3(a), was found to correspond essentially to the spectrum of bayerite, an Al(OH)3 poly-morph, provided in PDF No. 20-0011. However, a careful examination revealed that the intensity of the observed reflections did not correspond to the relative intensity listed in the PDF datum, and the reflection occurring at218:8
was likely to split into two. These results imply that a partial structural modification occurred in the precipitate; thus, a part of the structure might get transformed into another type of polymorphic structure. The second precipitation occurred in the filtered solutions when they were allowed to stand for 86.4 ks under an ambient temperature. The XRD spectrum for the first and second precipitates appeared similar but they differed slightly in their relative intensities of reflections. This observation suggests the possibility that the crystal structure of the second precipitate is similar to that of the first one although the chances of both these precipitates to have identical atomic arrangements are unlikely. Consequently, the precipitates formed in the NaOH aqueous solutions were expected to have a crystal structure close to that of bayerite and to have the composition of Al(OH)3.
In this study, an attempt was also made to obtain a crystalline phase of NaAlO2 by rapid dehydration of the filtered aqueous solution. The filtrate was heated in a muffle furnace set at 473 K until water in the filtrate was completely evaporated; this process usually took 1.8 to 3.6 ks, depending on the volume of the filtrate. An XRD of the residual product was performed and the spectrum shown in Fig. 3(b) was obtained. The major reflections in the spectrum were found to be indexible for NaAlO2 though some other low-intensity
300 310 320 330 340
0 600 1200 1800 2400
Time, t/s
Temperature,
T
/K
0 2 4 6 8 10 12 14 16
Accumulated volume of H
2
,
V
H
2
/dm
3
Generation rate of H
2
,
R
H
2
/dm
360s
-1
pH of the NaOH solution
Temperature
pH
VH2
RH2
Fig. 2 Time evolution of the temperature and pH of the NaOH aqueous solution, the accumulated volume and the generation rate of hydrogen. (Experiment a-1)
10 30 50 70 90 110
2θ (degree, CuKα)
Intensity (a.u.)
Al(OH)3 [Bayerite]
NaAlO2
(a)
(b)
[image:2.595.307.548.74.233.2] [image:2.595.50.289.597.749.2]peaks were also included. NaAlO2 is a highly deliquescent compound that reacts easily with moisture present in the air. Therefore, the small peaks might be attributable to a hydrated sodium aluminate that is possibly formed while the specimen was being prepared for XRD measurements.
3.3 Determination of the reaction equations
Based on the results of the gas chromatography and XRD analysis, the possible reactions between aluminum and NaOH aqueous solutions are shown as follows.
Alþ3H2OþNaOH!NaAl(OH)4þ3/2H2 ð1Þ
NaAl(OH)4!Al(OH)3þNaOH ð2Þ The overall reaction can thus be summed up as follows.
Alþ3H2O!Al(OH)3þ3/2H2 ð3Þ
The degree of reaction, f, for the above reaction is accordingly defined in terms of the volume of generated hydrogen,VH2:
f ¼ VH2=1:5
22:4103ðT a=273Þ
WAl MAl 1
100
¼8:1310
5MAlVH
2
WAlTa ;
ð4Þ
whereWAlandMAlare the weight of aluminum reagents and the molar mass of aluminum, respectively, and Ta is the ambient temperature measured in Kelvin. In the present investigation, it was also revealed that sodium aluminate can be obtained through the dehydration of NaAl(OH)4, which is expressed by the following equation.
NaAl(OH)4 !NaAlO2þ2H2O ð5Þ
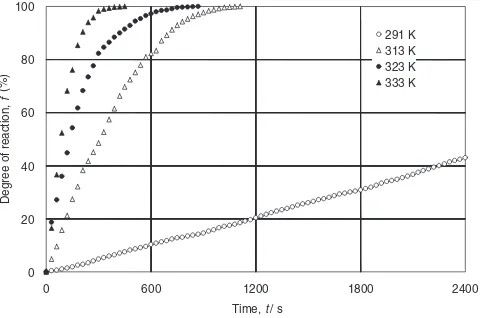
3.4 Effect of temperature
The effect of temperature on the reaction rate was examined by the following procedure. Prior to the experi-ment, the NaOH aqueous solutions were initially heated to appointed temperatures between 291 and 333 K. Once the temperature was equilibrated, the experiment was terminated by adding aluminum reagent to the preheated NaOH aqueous solution. The results shown in Fig. 4 clearly indicate that the
reaction rate is significantly influenced by the initial temper-ature of NaOH solutions. The reaction was completed within 1200 s when the initial temperature was set at 313 K or above, while the generation of H2 continued at 291 K even after 2400 s. In order to calculate the rate constants for the reaction, the obtained results were analyzed using the shrinking core model.10) Since the chemical reaction ex-pressed by eq. (3) is a first order reaction, the molar reaction rate of aluminum can be described as follows:
d
dt
4 3
Al
MAlrc 3
¼4rc2dnAl
dt ; ð6Þ wherercis the radius of the unreacted core,Alis the density of aluminum, andnAlis the amount of reacted aluminum. The reaction rate, dnAl=dt, is also given by the following equation:
dnAl
dt ¼
CNaOH
1=kcþ1=ks; ð7Þ where CNaOH is the concentration of the NaOH aqueous solution,ksandkcare the surface reaction rate constant and the mass transfer constant in laminar boundary layers, respectively. Equation (8), the reaction rate equation in terms of time variation ofrc, can be obtained by combining eqs. (6) and (7).
drc
dt ¼
CNaOHMAl
Alð1=kcþ1=ksÞ
; ð8Þ
The following relationship is derived from the definition forf.
rc=r0¼ ð1fÞ1=3 ð9aÞ
For a small value ofrc,kccan be approximated as follows:11)
kc¼r0
rc
kc0; ð9bÞ
wherer0is the initial radius of the reacting core andkc0is the initial value of kc. On substituting eqs. (9a) and (9b) into eq. (8), and on integrating it, eq. (10) is obtained.
1
ks
r01 ð1fÞ1=3 þ 1
2kc0
r01 ð1fÞ2=3
¼CNaOHMAl
Al
t
ð10Þ
On assuming that the NaOH aqueous solution is sufficiently stirred, the value ofkc0 can be set as infinite. In this case, eq. (10) can be written as
r0
1 ð1fÞ1=3 ¼ CNaOHMAl
Al
t
ks: ð11Þ
The above equation indicates that the slopes of the linear plots of r0f1 ð1fÞ1=3g against (CNaOHMAlt=Al) yield the reaction rate constants ks. Equation (11) was applied to the experimental data presented in Fig. 4 andks at each temper-ature was obtained as follows: 1:97106ms1 at 291 K,
2:28105ms1at 313 K,3:49105ms1at 323 K, and
6:93105ms1 at 333 K (see Fig. 5). These results are summarized in an Arrhenius plot, as shown in Fig. 6, and a good fit was obtained. The apparent activation energy for the reaction,Ea, was consequently determined to be 68.4 kJ mol1.
0 20 40 60 80 100
0 600 1200 1800 2400
Time, t/ s
Degree of reaction,
f
(%)
291 K 313 K 323 K 333 K
[image:3.595.50.290.599.758.2]3.5 Generation of pressurized hydrogen
Figure 7 shows the changes in temperature and pressure with time. The experimental conditions were as follows: (1) dross was used as the sample, containing 40 mass% of metallic aluminum, (2) the sample had 1 mole of aluminum, (3) the concentration of NaOH was 600 molm3 and
0.0003 m3, (4) the initial temperature was 299 K. The temperature gradually increased with an increase in the pressure. Finally, when the temperature reached 523 K, pressure reached 10 MPa and the safety valve was functional. These results show that the reaction of hydrogen generation is definitely not limited by pressure under the experimental conditions. A very large equilibrium constant of the order of
1074 supported this experimental result. The phenomenon of generation of high-pressure hydrogen appears very attractive from the viewpoint of hydrogen purification by placing hydrogen storage alloys, etc., at the down stream.
4. Systematic Evaluation Based on Life Cycle Assess-ment (LCA)
To determine the effect of the proposed process on the energy requirement and amount of carbon dioxide emissions, we performed a life cycle assessment (LCA) along with the conventional process. LCA is a well-known method used for assessing the environmental aspects and potential impacts associated with a byproduct. The assessment is performed by (a) compiling a life cycle inventory (LCI) of relevant inputs and outputs of a product system; (b) evaluating the potential environmental impacts associated with the inputs and out-puts; (c) interpreting the results of the inventory analysis and impact assessment phases in relation to the objectives of this study. Our proposed process can be expressed by eq. (12), while the conventional process is expressed by eqs. (13a) and (13b).
Waste Alþ3H2O!3/2H2þAl(OH)3þResidue ð12Þ
CH4þ2H2O!4H2þCO2 ð13aÞ
[image:4.595.51.289.311.469.2]Al2O3þ3H2O!2Al(OH)3 ð13bÞ
Figure 8 shows the system boundaries of the two methods for LCA. The proposed process (A) shows co-production of hydrogen and aluminum hydroxide from waste aluminum and deionized water, is assumed that produced by ion exchange of water. Here, the residual generated by the proposed process can be landfilled. The conventional hydro-gen production (B1) means so-called steam reforming of
0.00000 0.00005 0.00010 0.00015
0 2 4 6 8 10 12
CNaOHMAltρAl -1
(s) r0
{1-(1-f
)
1/3
} (m)
291K 313K 323K 333K
Fig. 5 Linear plot used for the evaluation of the surface reaction rate constants,ks. The lines in the figure are obtained by a linear regression analysis of the experimental data, and their slope provides the reaction rate constant at each temperature. The details of the plot can be found in eq. (11) in the text.
-14 -13 -12 -11 -10 -9
2.9 3.0 3.1 3.2 3.3 3.4 3.5
1000/T, K-1
ln k
s
(ms
-1)
Fig. 6 Arrhenius plot of the surface reaction rate constants.
250 300 350 400 450 500 550 600
0 2 4 6 8 10 12
Time, t/ks
Temperature,
T/K
0 2 4 6 8 10 12
Pressure,
p
/MPa
Temperature Puressure
Fig. 7 Time evolution of the temperature and pressure in the closed reactor.
Production and separation of
H2 CO2
(B1)
Heat sink
Heat or Electricity
Production of H2 and
Al(OH)3 Residual H2O(Deionized)
(A)
Production of deionized water
Landfill Treatment
Elect-ricity Heat sink
H2
Waste Al Al(OH)3
H2O Residual
Fuel CO2, H2O
Bauxite (B2)
Mining
Elect-ricity
Production of Al(OH)3
Heat sink
H2 Bauxite H2O
Al(OH)3
Fuel
Red mud H2O
CO2, H2O Fuel
Air H2O
[image:4.595.50.288.511.663.2] [image:4.595.308.547.578.739.2]natural gas, which is the most common method of hydrogen production. Steam, at a temperature of 973–1373 K, is mixed with methane gas and introduced into a fixed bed reactor of catalyst.12,13)The conventional aluminum hydroxide produc-tion (B2) corresponds to the 1st-stage of Bayer process. In the process, sodium hydroxide dissolves the aluminum compo-nent of bauxite ore to remove impurities from the solution and precipitates aluminum hydroxide.14)
In the LCA, the following assumptions were made: (a) Concentration of waste aluminum used was 15 mass%. (b) Latent environmental burden of waste aluminum was
zero.
(c) Deionized water was used for the hydrogen production. (d) Construction material and scrappings of both buildings and machines were not included in the proposed process because this process was under development.
(e) Waste aluminum and residue was transported to a plant for hydrogen production, and reacted waste aluminum to be used in the landfill was not considered.
(f) In evaluating the conventional process, not only was the production of Al(OH)3 based on the so-called Bayer process considered, but the hydrogen production based on steam reforming of natural gas was also taken into consideration.
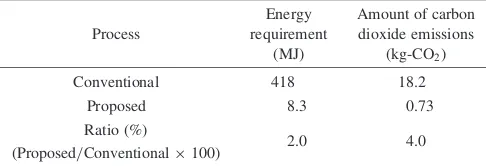
Table 2 lists the energy requirement and the amount of carbon dioxide emissions for producing 1.0 kg hydrogen and 26 kg Al(OH)3. The LCA evaluation of the conventional process concluded that the required energy was 418 MJ and the amount of carbon dioxide emissions was 18.2 kg. In contrast, the proposed process showed remarkably small values; the required energy was 8.3 MJ and amount of carbon dioxide emissions was 0.73 kg. These values respectively correspond to only 2.0 and 4.0% of those obtained through the conventional process. The results show that the proposed process has an extremely mild effect on global warming. Appendix gives key information used for LCA.
5. Conclusions
A new technology was proposed for hydrogen production using aluminum and sodium hydroxide solution; this tech-nology was studied both experimentally and theoretically. (1) In the experiments, the generation of hydrogen and the
formation of aluminum hydroxide were observed. We confirmed that the overall reaction of this phenomena, if all the aluminum hydroxide is precipitated, is expressed by: Alþ3H2O!Al(OH)3þ3/2H2.
(2) Temperature dependence on hydrogen generation was
expressed by the following equation.
ks¼4:29106exp
68:4
RT
ð14Þ
Using the above equation, the activation energy was calculated as 68.4 kJ mol1.
(3) The autoclave experiments showed that the proposed process has a possibility of generating hydrogen at a pressure higher than at least 1.0 MPa.
(4) A systematic evaluation by LCA showed that the proposed process was only 2% in terms of energy requirement and 4% in terms of carbon dioxide emission in comparison to the conventional processes used for generation of hydrogen and formation of aluminum hydroxide.
The basic data that we obtained will be effective for designing a new furnace of waste aluminum treatment together with the production of valuable materials such as hydrogen. In fact, such a furnace that produces hydrogen at a scale of 45 Nm3/day is currently under construction.
Acknowledgements
The authors wish to thank the Ministry of the Environment of Japan for providing the Grant-in-Aid for Waste Processing (Project No. K1424). Technical support and fruitful dis-cussions provided by the staff of ITEC Co., Ltd. and ChuoAoyama PwC Sustainability Research Institute are greatly appreciated.
A part of this research was conducted in charge of the project ‘‘Fabrication of the Model of Green-Hydrogen Community in Honjo-Waseda area’’, Ministry of the Envi-ronment, Japan.
REFERENCES
1) Japan Aluminum Association:http://www.aluminum.or.jp/
2) C. Ohnishi ed.: Investigation Report of Treatment and Recycle of Aluminum Dross(Journal of Japan Institute of Light Metals, 1998) pp. 1–20.
3) J. Gronostajski, H. Marciniak and A. Matuszak: J. Mater. Process. Tech.106(2000) 34–39.
4) M. Samuel: J. Mater. Process. Tech.135(2003) 117–124.
5) M. Matsuyama, H. Miyake and K. Ashida: Annual Report of Hydrogen Isotope Research Center-Toyama University12(1992) 49–58. 6) T. Akiyama, Y. Hirai and N. Ishikawa: Mater. Trans., JIM42(2001)
460–463.
7) S. Kanehira, Y. Miyamoto, K. Hirota and O. Yamaguchi: Trans. JWRI 30(2001) 67–72.
8) Yu. A. Aleksandrov, E. I. Tsyganova and A. L. Pisarev: Russ. J. Gen. Chem.73(2003) 689–694.
9) R. D. Armstrong and V. J. Braham: Corros. Sci.38(1996) 1463–1471. 10) J. Szekely, J. W. Evans and H. Y. Sohn: Gas-solid Reactions, Academic
Press, New York, (1976).
11) S. Kawai, K. Onoe and Y. Imamura: B utsurikagaku-niyoru-Kagaku-kougaku-Kiso, Maki Shoten, Tokyo, (1996), 272.
12) W. Balthasar: Int. J. Hydrogen Energ.9(1984) 649–668.
13) Meyer Steinberg and Hsing C. Cheng: Int. J. Hydrogen. Energ.14 (1989) 797–820.
14) I. Seyssiecq, S. Veesler, R. Boistelle and J. M. Lamerant: Chem. Eng. Sci.53(1998) 2177–2185.
[image:5.595.47.290.105.188.2]Appendix appear on next page.
Table 2 Energy requirement and amount of carbon dioxide emissions for producing 1 kg hydrogen and also 26 kg aluminum hydroxide from waste aluminum.
Process
Energy requirement
(MJ)
Amount of carbon dioxide emissions
(kg-CO2)
Conventional 418 18.2
Proposed 8.3 0.73
Ratio (%)
2.0 4.0
Name Comments Data Characterization Process Description Sources
241I Aluminium Production of
hydroxyde
A2O3þ3H2O!2Al(OH)3
aluminium BUWAL 132 (Bundesamt fur Umwelt, Wald und Landschaft) Bern, Februar
(Al(OH)3): hydroxide 1991 Page A22.
Productio (Al(OH)3)
Red mud obtained by the production of aluminium oxide is
241I Aluminium treated as a substance with soil characteristics and is not oxide (Al2O3):
included in the balance. Red mud is deposited in immediate Swiss Federal Office of Environment, Forests and Landscape (FOEFL or
Production proximity of the bauxite mine, covered with soil and then BUWAL) Environmental Series No. 132. Bern, February 1991. Page A22. recultivated with flora specific for the site. No information
exists about negative impacts of red mud landfills.
241I Hydrogen (H2, Stoechiometric reaction Production of
steam cracking of
Process route: CH4þ2H2O!CO2þ4H2
for mass input and output Hydrogen by Steam Ullmann’s Encyclopedia of Industrial Chemistry 5th edition, Vol A21, VCH
natural gas): and energy from Cracking of Weinheim 1992.
Production bibliography. Natural Gas
241I Water (De- Production of Laboratorium fur Energiesysteme ETH (Eidgensische Technische
ionized): Distilled Water by Hochschule Zurich) Zurich, 1996 Teil 3: Basismaterialieren Page: 83
Production exchange of ion primary source: Persliche Mitteilung von Herrn Kamberger von der Firma
SULZER THERMTEC, CH-8401 Winterthur, Februar 1993.
Breakdown of energy sources in Japan: – Coal: 14.39% – Lignite: 0% – Fuel Oil: 20.86% – Natural Gas: 20.07% –
Nuclear: 29.86% – Hydro: 8.84% (assumption: hydro + Production of
401 Electricity wind + waves + tide) – Process Gas: 3.63% (coke oven gas Representative of average Electricity in 1) For production and combustion of coal, lignite, heavy fuel oil, natural gas, (Japan, 1996): + blast furnace gas) – Free Electricity: 2.37% (geothermal, production in Japan Japan: production process gas: Laboratorium fur Energiesysteme ETH, Zurich, 1996
Production. 1 solar, biomass and animal products, industrial waste, (1996). of fuels and 2) for breakdown efficiencies: Energy statistics of OECD countries 1995–1996 municipal waste, non-specified assumed being impact free) combustion in International energy agency Paris, 1999
Import: 0% Distribution losses: 3.64% Efficiencies: – Coal: power plants 39.2975% – Lignite: 32.3% – Oil: 38.5% – Natural Gas:
33% – Nuclear: 33% – Hydro: 90%
Buwal 250 (Bundesamt fur Umwelt, Wald und Landschaft) Oekoinventare fur Verpackung: Band II Bern, 1996 page 453
900 Aluminium
Net calorific value: 31 MJ/kg Landfill of primary source: Doka G., Huber F., Labhardt A., Menard M., Zimmermann P.,
(Al): Landfill Aluminium (Al) Oekoinventare von Entsorgungprozessen-Grundlagen zur Integration der
Entsorgung in Oekobilanzen, ESU-Reihe 1/96; Institut fur Energietecknik, Gruppe Energie-Stoffe-Umwelt, ETH Zurich, 1996.
Hydrogen
Production
from
Waste
Aluminum
at
Different
Temperatu
res,
with
LCA