Article
1
A Heterogeneous Distributed Virtual Geographic
2
Environment for Crowd Evacuation Experiments
3
Shen Shen1,2, Jianhua Gong1,3,*, Jianming Liang4,*, Wenhang Li1, Dong Zhang1, Lin Huang1,2 and
4
Guoyong Zhang1,2
5
1 State Key Laboratory of Remote Sensing Science, Institute of Remote Sensing and Digital Earth, Chinese
6
Academy of Sciences, Beijing 100012, China; [email protected] (S.S.); [email protected] (W.L.);
7
[email protected] (D.Z.); [email protected] (L.H.); [email protected] (G.Z.);
8
2 University of Chinese Academy of Sciences, Beijing 100049, China
9
3 Zhejiang-CAS Application Center for Geoinformatics, Jiaxing 314199, China
10
4 School of Life Sciences, Arizona State University, Tempe 85287, USA
11
* Correspondence: [email protected] (J.G.); [email protected] (J.L.); Tel.: +86-10-6484-9299 (J.G. & J.L.)
12
Abstract: Due to their strong immersion and real-time interactivity, helmet-mounted VR devices
13
are becoming increasingly popular. Based on these devices, an immersive virtual geographic
14
environment (VGE) provides a promising method for research into crowd behavior in an
15
emergency. However, the current cheaper helmet-mounted VR devices are not popular enough and
16
will continue to coexist with PC-based systems for a long time. Therefore, a heterogeneous
17
distributed virtual geographic environment (HDVGE) could be a feasible solution to solve the
18
heterogeneous problems caused by various types of clients, and support implementation of virtual
19
crowd evacuation experiments, with large numbers of concurrent participants. In this study, we
20
developed an HDVGE framework and put forward a set of design principles to define the
21
similarities between the real world and the VGE. We discussed the HDVGE architecture and
22
proposed an abstract interaction layer, a protocol-based interaction algorithm and an adjusted dead
23
reckoning algorithm to solve the heterogeneous distributed problems. We then implemented an
24
HDVGE prototype system focusing on subway fire evacuation experiments. Two types of clients
25
are considered in the system, PC and all-in-one VR. Finally, we evaluated the performances of the
26
prototype system and the key algorithms. The results showed that in a low-latency LAN
27
environment, the prototype system can smoothly support 90 concurrent users consisting of PC and
28
all-in-one VR clients. HDVGE could serve as a new means of obtaining observational data about
29
individual and group behavior in support of human geography research.
30
Keywords: virtual geographic environment; virtual geographic experiment; virtual reality; VRGIS;
31
heterogeneous distributed clients
32
33
1. Introduction34
1.1. Background35
Geo-visualization started with two-dimensional (2D) mapping and later developed to include
36
three-dimensional (3D) interactive rendering. Starting from the mid-1990s, with the advent of the
37
virtual reality modeling language [1], the applications of virtual reality geographic information
38
system (VRGIS) in various fields have been rapidly developing [2]. VRGIS offers an immersive GIS
39
environment and could be considered an advanced form of geo-visualization [2]. Since VRGIS needs
40
to process massive amounts of GIS data, and render VR graphics at the same time, VRGIS
41
applications at this time can only run on high-end workstations, even requiring supercomputers. A
42
virtual geographic environment (VGE) is a VRGIS-based platform for multidimensional
43
visualization, dynamic process simulation and geo-collaboration [3, 4]. The second wave of VR has
44
brought better graphics hardware and cheaper helmet-mounted display (HMD), greatly improving
45
the availability and affordability of VR technology. This will also promote an upgrade of VRGIS, and
46
facilitate the development of new theories and methods of visualization, analysis and
geo-47
collaboration.
48
VR-based virtual experiments have been widely used in spatiotemporal behavioral research. In
49
the field of cognitive behavior research, virtual behavioral experiments have been used to study
50
spatial cognition, path selection, obstacle avoidance and other factors [5–9]. In the game industry, in
51
order to improve game design and enhance the gaming experience, data mining and visualization
52
have been used to analyze users’ spatiotemporal behaviors in massively multiplayer online
role-53
playing games (MMORPGs) [10–12]. In education and training, virtual reality simulators such as
54
flight [13], driving [14], fire escape [15] are used to train the user’s skills and enhance learning
55
effectiveness. In the field of urban design and planning, the impact of the urban environment upon
56
pedestrian decision-making behavior [16], pre-occupancy assessment [17], and guidance layout [18]
57
also need the support of observational data about users’ spatiotemporal behaviors, which could be
58
easily acquired in the virtual environment.
59
In recent years, there have mainly been three crowd behavior research methods. First,
60
computer vision technology has been used to extract pedestrian motion trajectories from surveillance
61
video and other multimedia data. With trajectories, researchers can identify and analyze pedestrian
62
behavioral patterns and the characteristics of spatial-temporal motion [15, 16][21, 22]. The second has
63
been to use a classic social force model [23, 24] and field model [25,26] to model, simulate and analyze
64
pedestrian behavior in specific situations [27,28]. Third, controlled real-world crowd experiments
65
[29,30] have been designed with particular research goals in mind, in order to obtain observations
66
that faithfully represent pedestrian movement patterns in the real world.
67
Real-world evacuation experiments are difficult to implement due to two reasons. First, it is
68
difficult to resolve the safety issues in evacuation experiments, involving the participation of real
69
people. Second, it is difficult to capture and quantitatively describe the spatiotemporal behavior
70
observed in emergency scenarios. A virtual geographical experiment (VGEx) is becoming a
71
promising research method. Immersed in a helmet VGE, the user not only has a strong sense of
72
presence and immersion, but can flexibly control an avatar to evacuate in an emergency scene. This
73
new form of experiment not only avoids the aforementioned safety problems, but can also faithfully
74
capture the behavioral characteristics of real people. This would greatly facilitate behavior analysis
75
and rule discovery. However, most of the current emergency drill systems have been designed only
76
for single-users [15][31, 32]. There are few multi-user collaborative experimental platforms to support
77
the study of crowd behavior.
78
1.2. Related works
79
Head-mounted VR devices can provide participants with a strong sense of immersion and
real-80
time interactivity, which can enhance the effectiveness of existing research. Moussaïd et al. [33]
81
constructed a multi-person collaborative virtual environment. They carried out crowd movement
82
experiments in both real and virtual scenes. They also proved the feasibility of using a shared 3D
83
virtual environment to carry out crowd experiments by involving real people. A cave automatic
84
virtual environment (CAVE) is an immersive virtual reality environment where projectors are
85
directed to between three and six of the walls of a room-sized cube [34]. Weiya Chen [35] used a large
86
CAVE-like system to design an immersive, multi-user and multi-sensor virtual environment. The
87
system used infrared devices to track user movements, and used shutter glasses to provide
88
immersion and access to head activity data. However, the virtual environment in [33] is not
89
sufficiently immersive, and large CAVE-like system devices in [35] are expensive.
90
Currently, there are many multiplayer online communities and games, such as Second Life and
91
World of Warcraft. However, they are not suitable for user behavior research. On the one hand, we
92
cannot obtain user behavior data from them. On the other hand, they are not designed for a specific
93
experimental purpose.
94
95
96
Preprints (www.preprints.org) | NOT PEER-REVIEWED | Posted: 30 December 2017 doi:10.20944/preprints201712.0201.v1 Peer-reviewed version available at ISPRS Int. J. Geo-Inf. 2018, 7, 54; doi:10.3390/ijgi7020054
In reality, the widespread adoption of helmet-mounted VR devices will require a long time, and
97
until then, we will continue to depend upon PC based systems. Therefore, to carry out large scale
98
virtual experiments for crowd evacuation, we need to solve the compatibility problems arising from
99
heterogeneous clients. The heterogeneous issues mainly come from the following three aspects: 1)
100
The computational capacity varies greatly across clients, for example, PCs usually have much higher
101
performance all-in-one VR units; therefore, how can different configurations of heterogeneous
102
computing platforms be made compatible with each other? 2) Participants engage in experiments
103
with heterogeneous interactions. How can the consistency of user experience across different clients
104
be ensured? 3) The LAN is not an ideal network environment for organizing large numbers of users
105
to participate in evacuation experiments. If necessary, organizers may need to use the Internet. Lastly,
106
how can a heterogeneous network environment be supported?
107
In this paper, we propose the following methods to solve the above heterogeneous problems.
108
We use several optimization methods to ensure that our system runs smoothly even on
low-109
configuration computing platforms. We propose an abstract interaction layer to adapt to the
110
interactions of heterogeneous devices, and use protocol-based interaction algorithms to ensure the
111
consistency of user experience across different clients. We use a distributed architecture design to
112
solve the problem of the non-synchronization of user states caused by network delays, so that the
113
system can be deployed in heterogeneous networks. This design allows us to conduct virtual
114
experiments both using the LAN and the Internet, which could facilitate participation from different
115
geographic locations. The specific algorithms will be described in section 3.2.
116
In section 2, we introduce the conceptual framework and design principles of heterogeneous
117
distributed virtual geographic environment (HDVGE). Then, we design the overall architecture and
118
key technologies of the experiment platform in section 3. In section 4, we implement a prototype
119
system for crowd evacuation in a subway fire scene. Through performance analysis, we demonstrate
120
the capability of this prototype system to support heterogeneous distributed virtual experiments for
121
crowd evacuation. The proposed system can serve as a data collection tool for further behavior
122
analysis. In section 5, we discuss the key issues in the experiments. In the end, we summarize the
123
conclusions and highlight future work.
124
2. HDVGE conceptual framework
125
2.1. Conceptual framework
126
The human-environment relationship refers to the relationship between the existence and
127
development of human society, or the human activities and the geographical environment [36]. The
128
geographical environment here is considered as the entire geographic environment encompassing
129
natural and human elements. They are intertwined in accordance with certain rules and are closely
130
integrated. The literature [37] suggests that VGEx can be categorized into virtual natural geographic
131
experiments and virtual human geographic experiments. Virtual natural and human elements
132
constitute the “environment”, while individuals, groups, and society in the VGE constitute the
133
“human” in a virtual experiment. Due to network and other technological limitations, collaborative
134
VGEx, even based on distributed technology, cannot normally support the number of concurrent
135
users of a real human society. However, virtual crowd experiments at the individual or group level
136
could be affordable. According to the human-environment relationship theory [36], we categorize the
137
VGEx into three types of elements: human, entity and environment. These elements and their
138
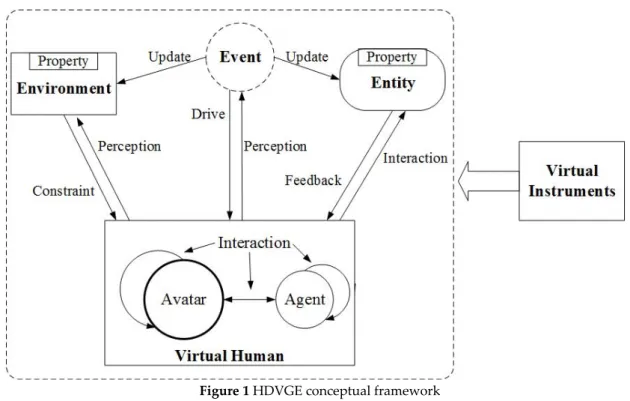
relationships are shown in Figure 1.
140
Figure 1 HDVGE conceptual framework
141
• Virtual Human:HDVGE regards the human as the core, and emphasizes the subjectivity of
142
human beings. The virtual human in the HDVGE include avatars controlled by real users and
143
agents driven by computer programs. They can interact with other elements as well as
144
themselves, such as interaction between avatars or avatars and agents. Multiple virtual human
145
form a group through social relations, roles and tasks. Massive groups in collective activities form
146
a crowd.
147
• Environment:The environment is the background of the VGEx and is the static part of the VGE.
148
We mainly use 3D models to simulate the real geographical environment, including terrain,
149
vegetation, architecture, etc., which constitute the physical part of the VGE. Like the real
150
environment, it can be perceived and recognized. At the same time, different environments will
151
constrain virtual human’s behaviors.
152
• Entity:Entity refers to dynamic variable entities in VGE. They have the ability to interact with
153
humans. They can not only be perceived by humans but can also provide feedback to the humans.
154
For example, small obstacles in evacuation process, such as desks and chairs, can affect the route
155
choice of virtual humans, meanwhile, their state variables can also be changed by the humans. In
156
HDVGE, how the consistency of entity state variables in heterogeneous clients can be maintained
157
is an essential issue.
158
In addition, HDVGE includes an important non-physical element, the event. An event can not
159
only express natural and human geographic processes but can also express their interactions, such as
160
the transfer of crowds in the course of mountain floods, and the evacuation of crowds during subway
161
fires. Events are represented by the updating of attributes of entities and environments. They can be
162
perceived by humans, and they can also drive people to respond. From the experiment organizer’s
163
point of view, virtual instruments are their tools for observing and documenting the spatiotemporal
164
states of various elements in virtual experiments.
165
2.2. HDVGE design principles
166
In the literature [38], the similarities in human behavior between the virtual and real worlds
167
have been studied, and a mapping principle been proposed. As the research purposes and objects
168
differ from one virtual world to another, a research frame based on four aspects has been put forward:
169
group size, traditional controls and independent variables, contextual and social architecture factors,
170
and directionality. Similarly, the virtual-real geographic similarity principal has been proposed in the
171
Preprints (www.preprints.org) | NOT PEER-REVIEWED | Posted: 30 December 2017 doi:10.20944/preprints201712.0201.v1 Peer-reviewed version available at ISPRS Int. J. Geo-Inf. 2018, 7, 54; doi:10.3390/ijgi7020054
literature [37], which establishes similar principles from four aspects: geographic space-time,
172
geographic attribute, geographic attributes group and geographic spatial cognition. The higher the
173
similarity between the virtual and real, the closer is user behavior in the virtual experiment to the
174
real-world. From the above principles, we propose the following HDVGE design principles.
175
• Similarity in geographic space-time: The time and space in VGE should be similar to that in the
176
real geographic environment (RGE). That is, the spatial scale and time scale in VGE should be
177
identical to the real ones. This similarity provides principles for modeling the 3D virtual
178
environment and process simulation. It requires strict reference to the size and proportion of real
179
space when modeling VGE. Additionally, the time scale of the VGE cannot be changed.
180
• Similarity in spatial attributes: The spatial attributes and distributions of entities and processes
181
in the VGE should be similar to that in the RGE. VGEx includes the simulation of processes in
182
natural geography and human geography. This principle stipulates that the modeling and
183
presentation of objects and geographic processes should be similar to reality.
184
• Similarity in group composition: Through observation of pedestrians in public places [39], at least
185
70% of pedestrians in a given population are not traveling alone, but walk in groups. In a VGEx
186
for crowd evacuation, group composition and member attributes must be similar to reality.
187
Because of the limitation of the 3D modeling, VGEx cannot provide every user with an elaborate
188
avatar. We use avatar models which are easy to discern to represent the members of the group,
189
while those who are outside the group use an avatar with a different appearance. This similarity
190
provides the basis for group modeling, observation, record and analysis.
191
• Similarity in perception: The subject of VGEx perceives the environment, entities, other subjects’
192
spatiotemporal positions, attributes and group relations from a first-person perspective. The
193
results of this perception process should be similar to the perception results of RGE. For example,
194
during a fire, the subjects’ perceptions of the evacuating crowd and their own companions in the
195
VGEx, should be similar to those in an actual fire environment. This similarity could stimulate
196
the subject to behave similarly to reality. Therefore, this similarity provides the framework and
197
principles for virtual scene design, process simulation, and interactions between multiple
198
subjects.
199
In addition, HDVGE designs are also constrained by factors such as VR device performance,
200
usability, and user experience [40]. The design of an HDVGE should consider these aspects in an
201
integrated manner. The ultimate design would reflect a compromise between the various factors
202
mentioned above.
203
3. HDVGE architecture and key technologies
204
3.1. HDVGE Architecture
205
According to the framework and design principles described in section 2, considering user
206
experience, system performance and research objectives, we propose a detailed architecture for an
207
HDVGE, as shown in Figure 2.
209
Figure 2 Architecture of HDVGE
210
• Collaborative Server
211
A collaborative server is primarily responsible for providing network services to the HDVGE.
212
The VGEx for crowd evacuation often requires multiple participants distributed in different
213
geographic locations. With this in mind, we adopted an authoritative-server-based architecture
214
instead of a peer-to-peer client. The server supports deployment in heterogeneous network
215
environments, to meet the experimental needs in either a LAN or WAN. The authoritative server
216
maintains the states of all the objects in the virtual scene and is responsible for computing and
217
updating them. Each operation on a client requires sending a synchronization request to the server.
218
The server periodically performs object status verification, computation, updating, and then sends
219
the latest statuses back to the target client. Due to the performance of heterogeneous clients varying
220
enormously, this architecture shifts computation stress from the client side to the server side, enabling
221
clients to focus on the high-fidelity rendering of HDVGE. In addition, the architecture is easy to scale
222
given the possibility of large numbers of concurrent users.
223
The collaborative server can provide a variety of services. The TCP service is mainly used for
224
frequently updated user data, such as the location, orientation and action of the avatar. The HTTP
225
service is mainly used for transactional network requests, such as user authentication and
226
background management. Voice communication between users in a group is achieved through voice
227
services. The database is mainly used to store structured data during the experiment, while the
228
storage cluster is mainly used to store unstructured data, and data that needs to be serialized. The
229
logging module periodically records the status and behavior of all users in the experiment. Due to
230
the high real-time requirements and interactivity, when there are large number of massive concurrent
231
users, the load balancing module is responsible for the scheduling of computing resources and
232
storage, and distributing the tasks according to the actual situation.
233
• Heterogeneous Clients
234
Although all-in-one VR offers a better sense of immersion, its availability and performance
235
remain limited. As large numbers of users are required in virtual crowd evacuation experiments, the
236
system has been designed to be able to interact with heterogeneous clients so that PC users can be
237
included. All-in-one VR uses high-precision sensors and gamepads as input devices, HMD as the
238
output device, while a PC uses the traditional mouse and keyboard as input devices, and the monitor
239
as the output device. To accommodate interactions between heterogeneous clients, we designed a
240
device-oriented graphic user interface (DGUI). On a PC, it appears as a screen-space user interface,
241
while on an all-in-one VR, it is a view-centered user interface that follows the user’s head movement.
242
The DGUI is mainly used to display user-related information. The interaction algorithm for
243
heterogeneous clients will be described in detail in section 3.2.
244
As an HDVGE is a common workspace shared by multiple users, 3D modeling of the
245
environment must be sufficiently photorealistic. In light of the limited computing and rendering
246
Preprints (www.preprints.org) | NOT PEER-REVIEWED | Posted: 30 December 2017 doi:10.20944/preprints201712.0201.v1 Peer-reviewed version available at ISPRS Int. J. Geo-Inf. 2018, 7, 54; doi:10.3390/ijgi7020054
capabilities of the heterogeneous clients, 3D models and scene rendering must also be optimized to
247
meet the requirements of user experience and system availability. A heterogeneous distributed
248
virtual environment is a trade-off between high fidelity and availability. As an important reference
249
point for users to perceive the virtual environment, avatars’ skin, bones and animations also need to
250
meet the above requirements. We distinguish between different groups of avatars using easily
251
identifiable colors of clothing. The avatars’ skeletal animations meet the non-verbal communication
252
needs between users in the HDVGE.
253
We add a logging module to the heterogeneous client, which is responsible for recording the
254
local user’s locations, orientations, actions and other status information. This module is different from
255
the server-side logging module, which records the status data for all users. Although the log data
256
have some degree of redundancy, it increases the reliability of data logging.
257
The network synchronization module is used mainly to communicate with the server. Data
258
transmission is based on the TCP protocol. Heterogeneous distributed clients perform collaborative
259
tasks through the network. Its real-time and interactivity are important factors that affect the user
260
experience. The architecture of the HDVGE uses the ideas of authoritative server and dumb client.
261
All clients will send their own status changes to the server, and then the collaborative server forwards
262
them to each client as requested. This architecture can reduce the client’s computing pressure and
263
avoid cheating. However, the disadvantage is that since all the data sent and received must first go
264
through the collaborative server, the overall performance is greatly affected by the speed of the
265
network. Therefore, the client prediction algorithm is very important. The algorithm will be described
266
in detail in section 3.2.
267
3.2. Key technologies
268
3.2.1. Abstract interaction layer for heterogeneous clients
269
Interactive devices and methods vary greatly between HDVGE clients. Interactive devices on
270
PC clients are keyboard, mouse and monitor. They use the mouse to control the viewpoint rotation,
271
use the keyboard to control the viewpoint movement, trigger skeletal animation and other actions.
272
Interactive devices of all-in-one VR clients mainly use the HMD, gamepad, and stereo screen. The
273
HMD is equipped with a high-precision 9-axis sensor, which is a combination of three sensors: a
3-274
axis accelerometer, a 3-axis gyro and a 3-axis electronic compass. Among them, the HMD mainly uses
275
the 3-axis gyroscope to measure, obtain the attitude parameters of the helmet, and then reconstruct
276
the user’s 3D motion. That is, the user controls the rotation of the viewpoint using the HMD, controls
277
the viewpoint movement using the gamepad, and triggers the skeleton animation using buttons.
278
Although the devices and methods vary considerably, the ultimate goals are the same. Therefore, in
279
order to be compatible with different interactions between heterogeneous clients, we designed an
280
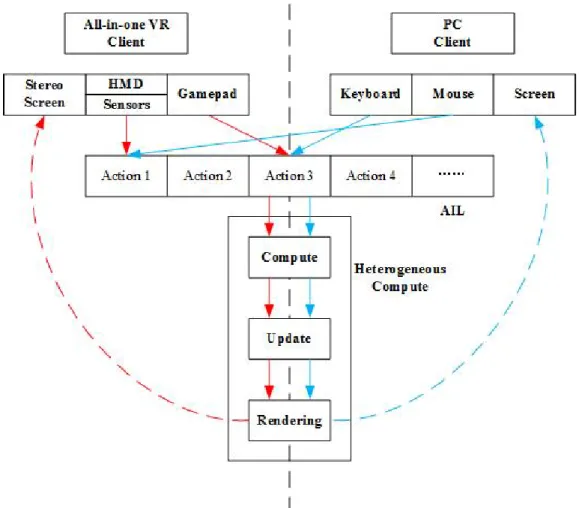
abstract interaction layer (AIL), so that the different interactive methods can achieve the same results.
281
Figure 3 shows a typical interaction process. The left and right sides of the figure represent the
282
interaction process of the all-in-one VR and the PC client, respectively.
284
Figure 3 Flow chart of abstract interaction layer for heterogeneous clients
285
The AIL is a collection of predefined actions. It is responsible for converting interactions from
286
heterogeneous clients into standard actions. First, we define the standard actions that can be
287
recognized by system. Second, we establish a mapping relationship between the various types of
288
operations from heterogeneous clients and AIL standard actions. This mapping relationship bridges
289
the differences between heterogeneous clients, and guarantees that different operations from
290
heterogeneous clients can produce the same effect. Third, according to the specific interaction action,
291
each client computes and updates the rendering scene in its own heterogeneous computing platform.
292
Finally, the rendering results are sent to the client’s display device.
293
3.2.2. Protocol-based interactions between heterogeneous clients
294
The standard actions defined in AIL also provide a common language for interactions between
295
the heterogeneous clients. For heterogeneous clients to communicate and interact with each other,
296
we propose protocol-based interactions to implement the collaboration between the heterogeneous
297
clients. The agreement is a data structure that the system appoints in advance for data exchange
298
between the clients. It can be understood and applied by each client in its own form, thereby masking
299
the differences between clients.
300
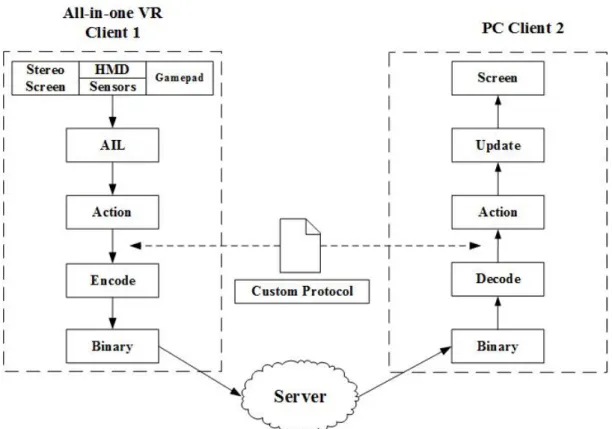
A typical data transmission process based on a custom protocol is shown in Figure 4. First, a
301
user of an all-in-one VR changes his status locally. Then, based on the type of heterogeneous client,
302
this interaction is mapped to standard actions by the AIL. Next, the system uses the custom
303
protocol to encode the standard action. To improve network transmission efficiency, the encoded
304
result is converted to binary form before being transmitted to the server. After receiving the status
305
update from client 1, the server calculates and processes the status information and then forwards
306
to other clients in the current scene.
307
Preprints (www.preprints.org) | NOT PEER-REVIEWED | Posted: 30 December 2017 doi:10.20944/preprints201712.0201.v1 Peer-reviewed version available at ISPRS Int. J. Geo-Inf. 2018, 7, 54; doi:10.3390/ijgi7020054
308
Figure 4 Flow chart of protocol-based interactions for heterogeneous clients
309
Let’s take PC client 2 as an example. After receiving the binary data, client 2 first converts it to
310
text data and decodes it. Then, it continues to restore the interaction of client 1 according to the
311
custom protocol, and updates the local client 1 status. Finally, based on the latest status of client 1,
312
client 2 performs calculation, rendering, and output display, and responds according to its needs and
313
feedback. All client-side interactions are similar to this.
314
3.2.3. Adjusted dead reckoning algorithm for client prediction
315
The network environment in which the distributed client is located to a large extent determines
316
the system’s real-time experience. Network latency is a key issue affecting the overall performance
317
of the system. In an HDVGE, not only does the status of the virtual avatars in the client needs to be
318
synchronized but many other scene elements also require consistent maintenance through the server,
319
such as interactions between avatars and entities, user entry and exit events, and the instantiation
320
and deletion of networked entities. Virtual scene maintenance can ensure the consistency of scene,
321
entities, avatars and other elements in each client to avoid user perception differences caused by
322
distributed clients.
323
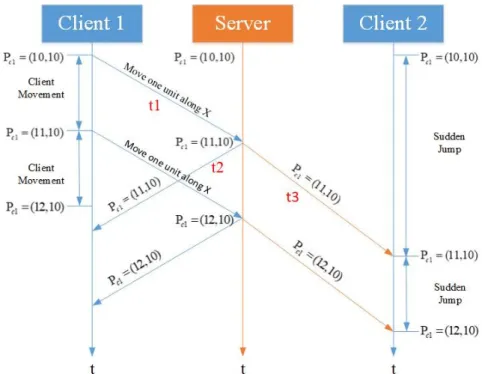
A typical client state synchronization process of an HDVGE is shown in Figure 5. We assume
324
that network latency for each client is constant throughout the process. The initial position of client 1
325
is (10, 10), and it moves one unit along the x-axis. Client 1 sends a new status to the server while
326
moving the local avatar. The data reaches the server after t1 time. Then, the server receives the new
327
status sent by client 1 and starts to broadcast to other clients. The broadcasted data reaches client 1
328
after time t2 and reaches client 2 after time t3. At this point, client 2 can see the new status of client 1.
329
In the process, the network delay of client 1 is (t1 + t2), while the new status of client 1 reaches client
330
2 after (t1 + t3). That is, the status of client 1 as seen by client 2 is actually the former’s status before
331
time (t1 + t3).
333
Figure 5 States synchronization process between clients
334
Out-of-sync status between distributed clients can cause serious problems. Assume that in the
335
HDVGE for crowd evacuation experiment, users need to control the avatars to escape quickly from
336
the scene of the fire. Client 1 and client 2 are in one group and need to escape together. Client 2 sees
337
the status of client 1 before time (t1 + t3), which is slightly behind client 2. Thus, client 2 stops and
338
waits for client 1. However, in fact, client 1 has already come to the front. At this point client 1 sees
339
client 2 falling behind. Therefore, client 1, in turn, will need to stop and wait for client 2. It can be
340
seen that the out-of-sync status between distributed clients will eventually make client 1 and client 2
341
stop moving. We need to predict the state of the next moment based on the client’s current state, so
342
that the avatars of different clients appear to be synchronized. We also need to minimize deviations
343
between the true and the predicted values.
344
There are many algorithms that predict a moving object’s future states based on the latest state.
345
The most widely used are dead reckoning (DR) and the Kalman filter (KF). DR is an algorithm to
346
predict the motion parameters of a moving object. It predicts the state of an object based on the latest
347
position, velocity, and acceleration and is widely used in the fields of aviation and navigation [41].
348
Curtiss Murphy [42] uses projective velocity blending, which mixes the newly acquired velocity with
349
the current velocity, and predicts the position combined with the time variable. The KF is an
350
algorithm that estimates the state of a system from measured data. It is commonly used in guidance,
351
navigation, and control systems. In computer vision applications, the KF is used for object tracking
352
to predict an object’s future location, to account for noise in an object’s detected location, and to
353
help associate multiple objects with their corresponding tracks [43]. Comparing the two, the DR
354
algorithm is more widely used and has been applied in networked games [44,45]. Therefore, we
355
adjusted the DR algorithm to provide client-side predictions, and compare its performance with KF.
356
The algorithm in [42] uses a fixed update rate to implement the DR algorithm. In HDVGE, the
357
client uploads the data to the server only when its status data changes. Then, the server pushes the
358
data to other subscribed clients. Thus, the client status data are not sent and received at regular
359
intervals. Due to the asynchronous updating scheme, we cannot use the original algorithm to
360
calculate the velocity blending factor needed for predicting the future position, and therefore we
361
developed a modified form of the algorithm. The formulas of the modified algorithm are shown in
362
(1) - (4).363
' 0 ( 0 0) b = + − Tw V V V V (1)Preprints (www.preprints.org) | NOT PEER-REVIEWED | Posted: 30 December 2017 doi:10.20944/preprints201712.0201.v1 Peer-reviewed version available at ISPRS Int. J. Geo-Inf. 2018, 7, 54; doi:10.3390/ijgi7020054
' 2 0 0
1
2
t=
+
b tT
+
T
tP
P
V
A
(2) ' ' ' ' 2 0 0 01
2
t=
+
T
t+
T
tP
P
V
A
(3) ' ( ) t = +t t − t Tw Q P P P (4)The velocity blending factor Tw is a normalized value determined according to the client data update
364
time. Formula (1) calculates the blended velocity
V
b using the velocity blending factor, whereV
0365
represents the current velocity, ' 0
V
represents the last known velocity. Formula (2) projects the future
366
position
P
t after Tt from the current positionP
0, the blended velocityV
b and the latest known367
acceleration ' 0
A
, where Tt represents the time elapsed since the last data update. Formula (3) projects
368
the future position '
t P
after Tt based on the last known position ' 0
P
, last known velocity ' 0 V , and last
369
known acceleration ' 0 A. Formula (4) blends the results of (2) (3) to obtain the final projected position
370
Qt.
371
As seen from the formulas, the predicted position is a linear combination of the current position,
372
and the known position. During the operation of the system, each time the data are updated, new
373
data will be used to correct the current data, to reduce errors and improve accuracy. We need to
374
adjust the velocity blending factor based on the actual system data update time. The larger the Tw
375
value, the greater the weight of the current positions; the smaller the Tw, the greater the weight of the
376
last known position.
377
4. Prototype system
378
4.1. Heterogeneous distributed virtual evacuation prototype system
379
Based on the above architecture design and key algorithms, we implemented a heterogeneous
380
distributed virtual evacuation prototype system. The system is based on a subway fire scene and can
381
support multi-user collaborative virtual evacuation drills. The server side of the system uses the
382
Smartfox Server as the TCP server for data synchronization, and Flask as the HTTP server. The client
383
side uses the Unity3D game engine as the development platform. We use the all-in-one PicoVR and
384
a mid-range PC as a heterogeneous interaction and computing client. The refresh frequency of the
385
PicoVR HMD is 90 Hz. The monocular resolution is 1200*1080 and the field of view is 102 degrees.
386
The all-in-one is equipped with a gamepad. With the high-precision 9-axis sensor in the HMD, the
387
system enables 3 degrees of freedom interactions. The price of this all-in-one device is about $450,
388
and the main hardware is a Qualcomm Snapdragon 820 CPU, Adreno 530 GPU, 4GB of RAM, and
389
Qualcomm QCA6174A wireless card. As a result, the all-in-one no longer requires high-performance
390
PC support, which reduces experiment costs.
391
The virtual scene mainly consists of a manually modeled 3D subway station, in which the
392
platform is approximately 8 m in width and 90 m in length. There are four exits in total, which are
393
labeled with A, B, C, and D, and located at the two ends of the platform. There are round pillars in
394
the middle of the platform. A fire breaks out on one side of the subway, thus two exits on one end
395
are blocked. The user-controlled avatar sets off from the center of the platform, climbs the stairs,
396
crosses the gates, and finally reaches the correct exit. Considering the weak performance of the
all-397
in-one, the prototype system does not use real-time lighting. Instead, the system uses some area light
398
sources and bakes the lighting into lightmaps. To improve the fidelity of the fire scene, the system
399
uses particle systems to simulate heavy black smoke. At the same time, the system establishes weak
400
lighting to create a low-visibility scene. Accompanied by a sharp fire alarm, the system creates a sense
401
of urgency to the user both visually and audibly. The pillars in the middle of the platform have a
clear exit-point marking, which is self-illuminated to ensure clarity. The pillars in the middle of the
403
platform have clear exit-oriented signs that use self-luminous materials to ensure a clear view.
404
The system uses low-precision 3D models as avatars. The number of triangles in each model are
405
between 600 and 700. To make it easy to distinguish avatar’s group information, we designed the
406
coat texture of avatars of the same group to have the same color. We design three skeletal animations
407
for each avatar, where “run” is used to represent the user’s escape animation, “idle” is used to
408
indicate that the user is not moving, and “greet” is used for non-verbal communication between the
409
group members. We have implemented two different modes of interactions, all-in-one VR and PC,
410
both of which use the first-person perspective. We use the device-oriented GUI to display the local
411
user group, flag, correct exit, evacuation countdown, system prompts and other news. Both types of
412
clients record the position, orientation, movement and other status data of the avatar in 0.3 second
413
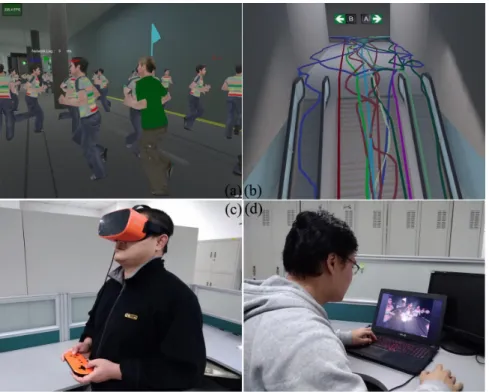
intervals. Figure 6 is a prototype system diagram.
414
415
Figure 6 Prototype system (a) overview of subway scene; (b) trajectory visualization;
416
(c) all-in-one VR client; (d) PC client
417
Since the LAN environment is pure, and it is easy to simulate complex conditions such as
418
network latency, the prototype system server is deployed in the LAN. At the same time, we
419
implement HTTP services to complete user authentication, configuration parameters and so on. We
420
define in advance the data structures of the request and response between server and client, which
421
are used to transfer the data such as status and message between the local and remote users. The
422
server records the status, actions and events of all the users in the virtual scene, according to the data
423
sent by the user.
424
4.2. Performance evaluation of key algorithms
425
Since the AIL and protocol-based interaction algorithms for heterogeneous clients cannot be
426
measured using numeric values, we have supplemented the implementation of the prototype system.
427
The availability of the system can prove the effectiveness of our additions. Therefore, only the
428
adjusted dead reckoning (ADR) algorithm is evaluated here.
429
• Adjusted dead reckoning algorithm
430
We used a prototype system to conduct a virtual evacuation experiment for a crowd in a subway
431
fire scene. Taking the trajectories of user activities collected in the experiment as an example, we
432
Preprints (www.preprints.org) | NOT PEER-REVIEWED | Posted: 30 December 2017 doi:10.20944/preprints201712.0201.v1 Peer-reviewed version available at ISPRS Int. J. Geo-Inf. 2018, 7, 54; doi:10.3390/ijgi7020054
implement the KF, with a constant acceleration model and ADR for position prediction. To study the
433
running time and prediction accuracy of the algorithm under different update frequencies, we use a
434
uniform distribution of fixed intervals to simulate the update frequency with some randomness. We
435
use the total time consumed by the prediction algorithm to evaluate the algorithm’s time complexity,
436
and use root mean squared error (RMSE) to measure the deviation from the observed value to the
437
true value.
438
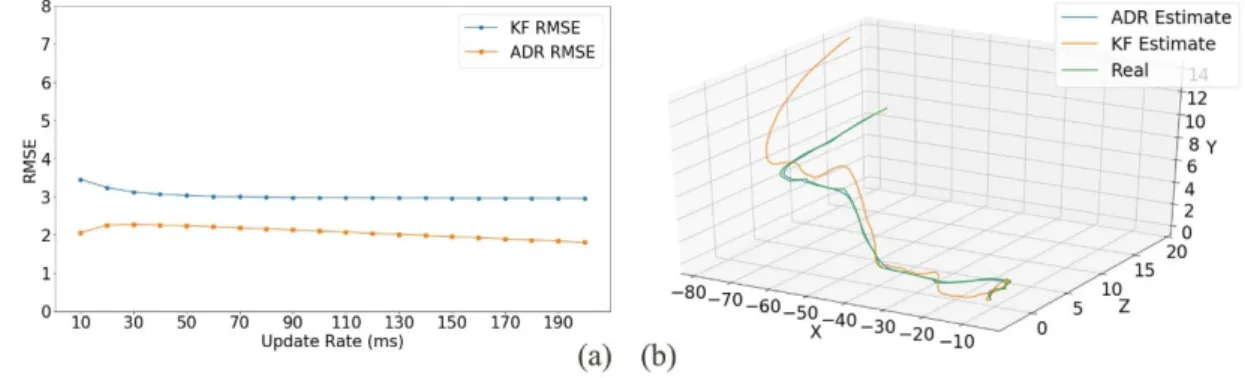
The test results are shown in Figure 8. In this test, we implement the ADR algorithm that takes
439
a velocity blending factor of 0.3. This means that the predicted value receives higher priority than the
440
latest updated position data. As seen from Figure 7 (a), from the accuracy of the algorithm, the
441
prediction error of the ADR algorithm is smaller than the KF algorithm by an average of 0.961 m,
442
which is lower by 31.76%. From the running time, the single run time of ADR is almost negligible,
443
while the KF algorithm requires an average of 0.23 ms. This is because KF needs to update the state
444
transition model and covariance model in each time step, and performs a series of matrix
445
multiplications. Therefore, we recommend that the ADR algorithm should be considered in 3D
446
rendering programs that require high real-time performance. Figure 7 (b) shows the prediction
447
results of the ADR algorithm and the KF algorithm. The XZ plane is the user’s activity plane, and the
448
positive Y axis represents the height value. The error in the prediction trajectory of the KF algorithm
449
increased after the avatar moved vertically. The trajectory predicted by the ADR algorithm is subject
450
to unsatisfactory accuracy when the avatar’s acceleration changes, but the error is quite small in other
451
places. This is more in line with the actual situation.
452
453
Figure 7 Comparison between ADR and KF
454
4.3. System overall performance test
455
To verify the usability of the prototype system, we conducted an overall system performance
456
test. Here, an important question we aim to address is: with the heterogeneous clients of general
457
configuration, how many concurrent users can the system support in distributed virtual
458
experiments? We assume that the hardware and networks of all clients are the same. The performance
459
metrics of the prototype system are mainly influenced by the number of concurrent users and the lag
460
of packets. Therefore, we take them as two factors used in a factorial experiment. The number of
461
concurrent users includes 5 levels, namely, 10, 30, 50, 70 and 90. To simulate different network
462
environments, we use software to add delays to the packets sent and received. The packet lag
463
includes 4 levels, namely, 0, 10, 20, and 30 milliseconds; that is, each replicate of the experiment
464
contains all 20 treatments, and each treatment contains 5 replicates.
465
The prototype system performance indicators include resource consumption, rendering
466
pressure, and network latency. Resource consumption is measured by CPU usage, memory usage
467
and network throughput. The indicator of rendering pressure is the frame per second (FPS) of the
468
client. Network latency is measured by the overall latency recorded by the client. We use a PC and
469
an all-in-one VR as test clients, and develop a simulation program for simulating a given number of
470
distributed clients. The main hardware in the PC: Intel (R) Core (TM) i5 750, NVIDIA GeForce GTX
650 and 8GB RAM. The configuration of the all-in-one VR is described in section 3.1. The main
472
hardware in the server: Intel (R) Core (TM) i7 6700, NVIDIA GeForce GTX 1060, 8GB RAM.
473
At the beginning of the test, the simulation program created a specified number of concurrent
474
avatars and allowed them to move randomly in the scene. The user controlled the avatar, ran through
475
the crowd, and finally reached the other end on the subway platform from where the fire started. The
476
server and the clients of two types recorded the resource consumption during the running of the
477
program. The clients additionally recorded the frame rate and the overall network delay data. The
478
result of each test is the average of each parameter in the process. We took the average of each
479
indicator in each test as the test result.
480
4.4. Data analysis
481
As the hardware and computing capacity vary greatly between the server, PC and all-in-one VR,
482
the evaluation indicators are also different, and we will discuss them separately.
483
• Server side
484
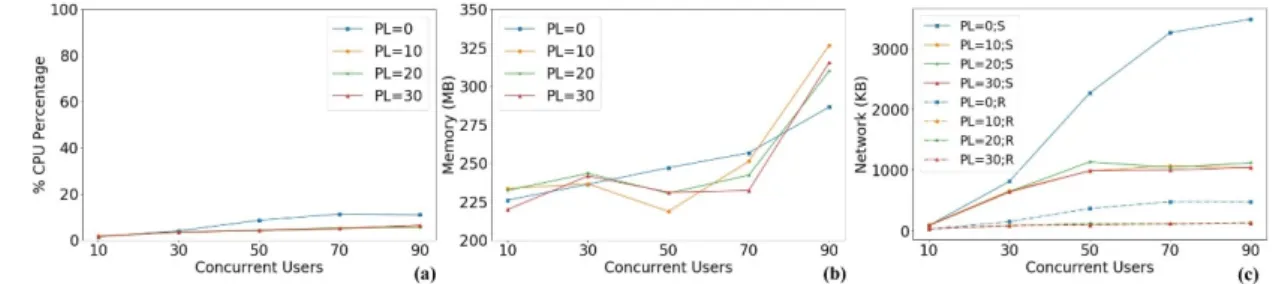
The resource consumption of the prototype system with different numbers of concurrent users
485
on the server side is shown in Figure 8 (a) (b) (c). The system resource consumption increases with
486
the number of concurrent users. With 90 concurrent users, this process takes up to 10% of the CPU.
487
Memory usage increases significantly with the number of concurrent users, with the maximum being
488
320 MB. Network sent traffic (up to 3500KB per second) is several times higher than network received
489
traffic (up to 500KB per second). This is because after the server received a user update, it sends the
490
update to all other users. When the packet lag is 0, the network traffic both received and sent reaches
491
the highest level. One of the possible reasons is that the latency has caused data packets to get stuck
492
in the network, without reaching the server processing flow on time. Some packets are discarded due
493
to timeout and are no longer being processed. This results in a reduction in the total network traffic.
494
In general, the system’s CPU usage is not high. This process does not occupy much of the server’s
495
resources, and more concurrent users can be supported.
496
497
Figure 8 Server resource consumption with different numbers of concurrent users and packet lags (PL
498
stands for packet lag. S refers to send traffic while R refers to received traffic. Abbreviations in other figures
499
have the same meanings.)
500
• PC side
501
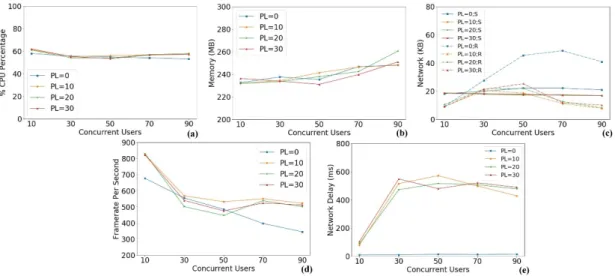
Figure 9 shows the resource consumption of the PC client under different numbers of concurrent
502
user and packet lags. (a) shows that as concurrent users increase or as packet lags increase, CPU usage
503
does not increase significantly. (b) shows that memory usage is mainly affected by the number of
504
concurrent users. Since the client only needs to send the status data of the local user, the network sent
505
traffic is stable. On the other hand, the client needs to receive the status data of all other remote users,
506
so there is an increasing process in (c) as the number of concurrent user increases. However, an
507
increase in packet lags causes network congestion and some data is discarded. With the increase of
508
concurrent users, the decline of FPS in (d) is obvious, but it is still at a very high level. It can be seen
509
from (e) that in the absence of packet lags, the increase in the number of concurrent users has no effect
510
on the network delay on the PC side. However, once the packet lag is introduced, the impact of both
511
factors on the overall network delay is approximately logarithmic. Overall, the prototype system is
512
stable on this medium-configured computer.
513
Preprints (www.preprints.org) | NOT PEER-REVIEWED | Posted: 30 December 2017 doi:10.20944/preprints201712.0201.v1 Peer-reviewed version available at ISPRS Int. J. Geo-Inf. 2018, 7, 54; doi:10.3390/ijgi7020054
514
Figure 9 PC resource consumption in different number of concurrent users and different packet lags
515
• VR side
516
Because the all-in-one PicoVR system is Android, its performance is measured in a slightly
517
different way. In the following indicators, CPU Time refers to the average of the total time consumed
518
in the most recent 30 frames. The larger the value, the greater the overall pressure on the device.
519
Memory refers to the used heap size. FPS has been limited by their SDK, up to 60 FPS.
520
In Figure 10, we can see from (a) that the number of concurrent users and packet lags have no
521
significant impacts on CPU time-consuming. Used heap size in (b) increases with concurrent users,
522
and has no obvious relationship with packet lag. The network traffic in (c) is similar to the PC client.
523
The FPS in (d) shows a decreasing trend with the number of concurrent users but has no obvious
524
relationship with packet lag. This shows that the packet lag does not affect the FPS. That is, packet
525
lag can lead to poor interactivity, but it does not affect the real-time user experience. (e) shows that
526
the impact of these two factors on the overall network delay in the VR client is also logarithmic.
527
528
Figure 10 All-in-one VR’ resource consumption for different numbers of concurrent users and packet lags
529
In summary, the overall performance of the server, PC client and all-in-one VR is stable and less
530
demanding on system resources. The number of concurrent users does not have significant effect on
531
the overall performance. The main bottleneck of system expansion depends on the performance of
532
the all-in-one VR. Packet lag has a great impact on the overall network delay, and will make system
533
performance decline rapidly. The conditions such as network congestion and packet loss, will have
534
negative effect on system performance and user experience. In an actual experiment, high network
535
latency should always be avoided.
5. Discussion
537
Organizing large numbers of people over a network to conduct virtual experiments is a
538
challenging task. The LAN environment is pure and has low network delays, generally less than 20
539
ms. Our HDVGE prototype system supports the participation of 90 or more concurrent users in
540
collaborative virtual evacuation experiments. The main limitation is the performance of the all-in-one
541
VR. Under the conditions of 90 concurrent users and no packet lags, the PC client can maintain a
542
rendering performance of approximately 300 FPS, while the all-in-one VR can only run at
543
approximately 20 FPS, which could barely meet the requirements for a real-time user experience and
544
interactivity. With the continuous development of hardware, all-in-one VR will become more
545
powerful and better meet the experimental requirements. At present, the heterogeneous distributed
546
architecture is probably the most effective option to conduct virtual experiments with high numbers
547
of concurrent users.
548
The Internet is a complicated network environment subject to high latency due to the large
549
number of users distributed around the world. Network delay has more influence on real-time and
550
interactivity than numbers of concurrent users. It should be noted that overall network delay and
551
packet lag is not a simple linear relationship. This shows that the Internet experimental environment
552
may introduce more complex factors, which would make it more difficult to meet the real-time and
553
interactivity requirements of HDVGE. When conducting virtual experiments on an HDVGE, the
554
network environment should be selected according to the actual experimental needs.
555
When conducting virtual crowd evacuations in emergency scenarios, a very important question
556
to consider, is that of how tension can be created for the participants? As mentioned in the literature
557
[25], there are several main ways. First, create more realistic emergency elements, such as dim lights
558
and thick smoke; second, set a time limit using a countdown to urge participants to escape; third,
559
develop experimental policies, the shorter the time needed for a successful evacuation is, the better
560
the payoff will be. In practice, these methods all play a role in the experiment, but the immersion and
561
presence brought by the HMD VR device can provide a better user experience. For non-immersive
562
devices, the 3D virtual environment on the computer screen is independent of the participant’s
563
cognitive space. While in a helmet-based VGE, the virtual environment space and cognitive space are
564
closely coupled, so that the user’s cognition of the virtual world is consistent with that of the real
565
world.
566
6. Conclusions and future works
567
In recent years, low-cost HMD VR devices are becoming popular, but they are not sufficiently
568
widely available. Hence, they will coexist with PC based systems for a long time. To solve the
569
heterogeneous problems caused by various types of clients and to support implementation of virtual
570
crowd evacuation experiments with large numbers of concurrent participants, the HDVGE
571
represents a feasible solution. In this paper, we present HDVGE as a practical solution and
572
demonstrate the technical feasibility of HDVGE.
573
First, we have proposed an HDVGE framework for crowd evacuation, and analyzed the design
574
principles of the HDVGE platform based on this framework. We then designed the architecture and
575
the key technologies of the experiment platform. Finally, using a subway fire as an example, we
576
implemented an HDVGE prototype system for crowd evacuation. Through testing and analyzing the
577
key algorithms and overall performance, we demonstrated the effectiveness of the proposed system.
578
The results show that in a low-latency LAN environment, the system could support 90
579
concurrent users for collaborative virtual experiments as heterogeneous distributed clients. System
580
performance bottlenecks were dependent on the all-in-one VR. Packet lag had a great impact on the
581
overall network delay, and would result in a rapid decline in the system performance, leading to
582
further issues such as network congestion, packet loss, etc. In actual experiments, high-latency
583
network environments should be avoided.
584
The HDVGE could serve as a new means of obtaining observational data on individual and
585
group behaviors. Future work will include: 1) Crowd behavior varies greatly in different scenes; so
586
analyzing the behavioral data of individuals and groups in different scenarios may lead to different
587
Preprints (www.preprints.org) | NOT PEER-REVIEWED | Posted: 30 December 2017 doi:10.20944/preprints201712.0201.v1 Peer-reviewed version available at ISPRS Int. J. Geo-Inf. 2018, 7, 54; doi:10.3390/ijgi7020054
conclusions. 2) Compared with the data of a real scene experiment, we will analyze the similarities
588
in the behaviors between the virtual and real scenes.
589
Acknowledgements: This research is supported by the National Natural Science Foundation of China
590
(41371387), National Key Research and Development Program of China (2016YFB0502502), Sensing Location
591
Semantics Based on Multisource Big Geodata (2017YFB0503602), Pre-research Project of Equipment
592
Development Department (315050501) and Internal Program of SLRSS China (Y7Y00200KZ).
593
Author Contributions: Shen Shen, Jianhua Gong, Jianming Liang and Wenhang Li conceived and designed the
594
methods; Dong Zhang, Lin Huang and Guoyong Zhang performed the experiments; Shen Shen analyzed the
595
data and wrote the paper; all the authors reviewed and edited the manuscript.
596
Conflicts of Interest: The authors declare no conflict of interest.
597
References
598
1. Raggett, D. Extending WWW to support platform independent virtual reality. In Proc. Internet
599
Society/European Networking; 1995; p. 242.
600
2. Haklay, M. E. Virtual reality and GIS: Applications, trends and directions. Virtual Real. 2002, 47–57.
601
3. Lin, H.; Chen, M.; Lu, G.; Zhu, Q.; Gong, J.; You, X.; Wen, Y.; Xu, B.; Hu, M. Virtual Geographic
602
Environments (VGEs): A New Generation of Geographic Analysis Tool. Earth-Science Rev. 2013, 126,
603
74–84, doi:10.1016/j.earscirev.2013.08.001.
604
4. Xu, B.; Lin, H.; Chiu, L.; Hu, Y.; Zhu, J.; Hu, M.; Cui, W. Collaborative virtual geographic
605
environments: A case study of air pollution simulation. Inf. Sci. (Ny). 2011, 181, 2231–2246,
606
doi:10.1016/j.ins.2011.01.017.
607
5. Mallot, H.; Gillner, S.; Veen, H. Van; Bülthoff, H. Behavioral experiments in spatial cognition using
608
virtual reality. Spat. Cogn. 1998, 447--467, doi:10.1007/3-540-69342-4_21.
609
6. Bülthoff, H. H.; Campos, J. L.; Meilinger, T. Virtual Reality as a Valuable Research Tool for
610
Investigating Different Aspects of Spatial Cognition (Abstract). Spat. Cogn. 2008, 1–3,
doi:10.1007/978-3-611
540-87601-4_1.
612
7. Notelaers, S.; De Weyer, T.; Goorts, P.; Maesen, S.; Vanacken, L.; Coninx, K.; Bekaert, P. HeatMeUp: A
613
3DUI serious game to explore collaborative wayfinding. IEEE Symp. 3D User Interfaces 2012, 3DUI 2012
614
- Proc. 2012, 177–178, doi:10.1109/3DUI.2012.6184219.
615
8. Fajen, B. R.; Warren, W. H. Behavioral dynamics of steering, obstable avoidance, and route selection. J.
616
Exp. Psychol. Hum. Percept. Perform. 2003, 29, 343–362, doi:10.1037/0096-1523.29.2.343.
617
9. Kretz, T.; Hengst, S.; Roca, V.; Perez Arias, A.; Friedberger, S.; Hanebeck, U. D. Calibrating dynamic
618
pedestrian route choice with an Extended Range Telepresence System. Proc. IEEE Int. Conf. Comput.
619
Vis. 2011, 166–172, doi:10.1109/ICCVW.2011.6130239.
620
10. Anders Drachen; Thurau, C.; Togelius, J.; Yannakakis, G. N.; Bauckhage, C. Game Data Mining. In
621
Game Analytics; 2013; pp. 205–253 ISBN 978-1-4471-4768-8.
622
11. Guardini, P.; Maninetti, P. Better Game Experience Through Game Metrics: A Rally Videogame Case
623
Study. In Game Analytics; 2013; pp. 325–361 ISBN 978-1-4471-4768-8.
624
12. Medler, B. Visual Game Analytics. In Game Analytics; 2013; pp. 403–433 ISBN 978-1-4471-4768-8.
625
13. Gower Jr., D. W.; Fowlkes, J. E. Simulator Sickness in the UH-60 (Black Hawk) Flight Simulator. 1989,
626
60.
627
14. Brooks, J. O.; Goodenough, R. R.; Crisler, M. C.; Klein, N. D.; Alley, R. L.; Koon, B. L.; Logan, W. C.;
628
Ogle, J. H.; Tyrrell, R. A.; Wills, R. F. Simulator sickness during driving simulation studies. Accid. Anal.
629
Prev. 2010, 42, 788–796, doi:10.1016/j.aap.2009.04.013.