Viscoplastic Parameter Identification for Lead-Free Solder Alloy
by Micro-Indentation, FE Simulation and Optimization
*1Hiroshi Hamasaki, Kazuhiro Shinbata
*2and Fusahito Yoshida
Department of Mechanical System Engineering, Faculty of Engineering, Hiroshima University, Hiroshima 739-8527, Japan
A system for material parameter identification by depth-sensing micro-indentation, Finite Element (FE) simulation and optimization has been developed. In this system, the material parameter identification is treated as an optimization problem by minimizing the difference between experimentally obtained indentation load vs. penetration (P-h) curves and the corresponding FE simulation results. To reduce the computation time, a multipoint approximation response surface methodology (MARS) is used in combination with the interaction of high- and low-fidelity analysis algorithms. Using this system, the viscoplastic properties of a lead-free solder (Sn-3.5Ag-0.75Cu) were identified. This identification method has been confirmed by comparing the obtained material parameters with those determined from uniaxial compression tests.
[doi:10.2320/matertrans.P-MRA2007887]
(Received July 2, 2006; Accepted November 29, 2007; Published February 6, 2008)
Keywords: micro-indentation, finite element simulation, optimization, material parameter identification, lead-free solder, high- and low-fidelity models
1. Introduction
Since the strength of solder joints in electronic products under thermal fatigue and impact loading determines to a large degree their lifetime and reliability, numerous studies on the stress/strain analysis of solder joints have been being carried out.1–3) It is well known that viscoplastic (creep) deformations are dominant in solder alloys even at room temperature; therefore, for the analysis, a constitutive model that properly describes the viscoplasticity behavior, as well as its material parameter identification, is required. In particular, the determination of the mechanical properties of lead-free solder alloys is of vital importance, since, nowadays, several types of lead-free solder alloys have been developed and introduced into the market in order to overcome the serious environmental problems caused by Pb-containing solder alloys.4)
As for material testing, uniaxial tension tests and creep tests using specimens cut from a cast bulk metal are popular. However, one of the serious problems in those tests is that it is difficult to give the thermal histories, which a solder joint has, to a bulk specimen. As a result, the mechanical properties obtained from the bulk test are not precisely the same as those of the solder joint.
Instead of such conventional material tests, the depth-sensing micro-indentation test, where a small tip of an indenter penetrates into a material surface, has a great advantage over other conventional experimental techniques. In this test, indentation load (P)-depth (h) response is continuously recorded during the indentation process, and from thus obtained P-h data, mechanical properties of materials are determined. For the identification of viscoplas-ticity parameters, the creep indentation test is very popular, where the indentation depth vs. time (hvs.t) relationship is recorded under constant indentation load. Sargent and Ashby5)presented a framework of the method of identifying
material parameters in a steady-creep constitutive model from self-similar indentation tests, such as Berkovich (triangularly based pyramidal indenter) and Vickers (square-based pyramidal indenter) indentations. On the basis of this theory, Fujiwara and Otsuka6)determined the material
parameters in Norton’s law for a lead solder, and further-more, Miyamotoet al.7)obtained the parameters for several lead-free solder alloys. In the above studies, indentation-creep data (progressive indenter penetration vs. time under a constant load) are exclusively used for material parameter identification, but the P-h responses are never taken into account. In contrast, there are some studies which include some discussions on the loading process of viscoplastic indentation. For example, Nakamura et al.8) proposed a
method of determining the strain-rate exponent from exper-imental results of a indentation-speed-controlled dynamic hardness test with a conical indenter, and Maet al.9)reported
thatP-hresponses on a lead-free solder alloy were strongly affected by the loading speed of indentation.
In this paper, to identify the accurate viscoplasticity properties of lead-free solder alloy, we propose to use the loading part of theP-h curve together with the indentation-creep data. Since the stress and strain distributions in a material beneath the indenter are highly nonhomogeneous, we cannot determine its material properties (stress-strain curve) directly from the experimental data of indentation. As an indirect way of material parameter identification, here we propose an inverse approach based on a curve fitting technique using the experimental P-h curve and the corre-sponding FE simulation result. Generally speaking, such an FE-analysis-based inverse approach is computationally ex-pensive, because a large number of iterative FE simulations are necessary to obtain the solution, and furthermore, the FE simulation itself takes a long time. To solve this problem, a new algorithm using the interactions of high- and low-fidelity simulation models is employed. This method of material parameter identification is verified by comparing thus determined viscoplasticity properties of a lead-free solder alloy with those obtained from bulk-compression tests.
*1This paper was originally published in Japanese in J. Jpn. Soc. Technol.
46–532 (2005) 397–401.
*2Graduate Student, Hiroshima University
2. Depth-Sensing Micro-Indentation Test
2.1 Preparation of experiment
Sn-3.5Ag-0.75Cu lead-free solder alloy (Senjyu Co., Ltd.), which is expected as a next-generation standard lead-free solder alloy because of its high performance in terms of stability and reliability, was selected as a specimen. Upper and bottom surfaces were parallelized to enable the indenter to sink vertically into the specimen surface. Due to the small indenter-penetration depth, prior to the experiments, the surfaces of specimens were mechanically polished with sandpaper (#2000) and the subsequent buffing to make smooth surfaces, and cleaned with acetone. As an exper-imental apparatus, a depth-sensing microindenter MZT-4 (Akashi Co., Ltd.) was employed. To study the effect of indenter shape on the identified viscoplasticity parameters, two different indenters were used: a Berkovich indenter (a pyramidal indenter with a triangular base and whose angle between the vertical axis and its facet is 65) and a spherical
indenter with a radius of 100mm. Experimental conditions are summarized in Table 1. Maximum loads of 500 mN for Berkovich indentation and 700 mN for spherical indentation were selected, under which the scattering of P-h curves obtained from several indentation trials was very small. To determine rate-dependent material properties (viscoplastic-ity), two different loading speeds (100 mNs1 [fast] and
1 mNs1 [slow]) were selected; moreover, the indentation
creep (strain vs. time) when the maximum load was held for 5 seconds was recorded.
2.2 Experimental results
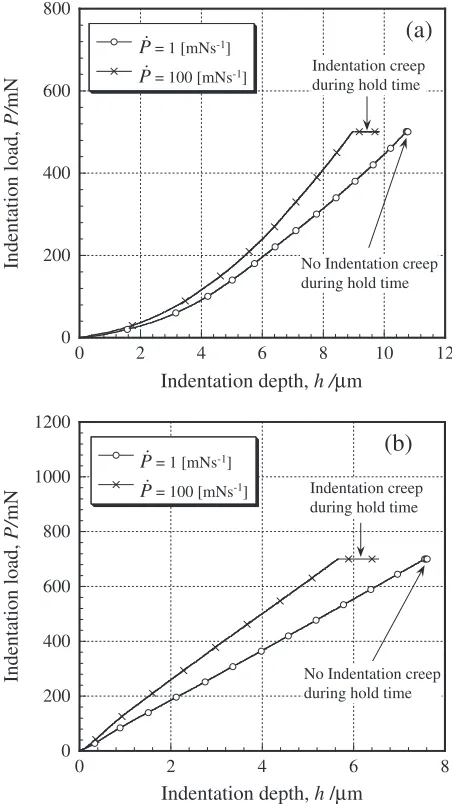
Figures 1(a) and (b) show the P-h curves obtained from Berkovich and spherical indentations, respectively. It is obvious that the shapes ofP-hcurves were strongly depend-ent on the type of inddepend-enter. P-h curvs for the Berkovich indentation can be expressed by a power law relation (P¼Khm, where K and m are constants), while those for the spherical indentation are almost linear. It should be noted that P-h responses are highly rate-dependent in both Berkovich and spherical indentations. The slow loading speed gave a larger penetration depth. The indentation creep, i.e., the increase in indenter-penetration depth during the holding time, was observed in the fast loading, while in the slow loading, almost no creep appeared.
3. Automated Material Parameter Identification
Meth-od
3.1 Viscoplasticity constitutive model and its material
parameters
Sn-3.5Ag-0.75Cu lead-free solder alloy shows a strong
rate dependence, while it exhibits almost no workhardening except in small strain regions. Hence, in this study, Norton’s law expressed by eq. (1) is assumed for this alloy’s constitutive model:
_ " " "
"¼C
0 n
ð1Þ
where""""_and denote the equivalent viscoplastic strain rate and equivalent stress, respectively. The normalizing stress parameter0is assumed to be 1 MPa for simplicity.Candn
are the material parameters to be identified.
3.2 Parameter identification method as an inverse
problem
A general optimization problem can be formulated as
F0ðxÞ !minimize ð2aÞ
AixiBi;ði¼1;. . .;NÞ ð2bÞ
where F0ðxÞ is an objective function, that is minimized
[image:2.595.313.539.74.476.2]during the optimization process, and vector x is a set of design variables, which are to be the material parameters to be identified.AiandBiare the side constraints for each design Table 1 Experimental conditions.
Indenter Maximum load (mN)
Loading speed (mNs1)
Hold time (s)
Berkovich 500 1 (Low), 100 5 (High)
Spherical 700 1 (Low), 100 5 (High)
0 200 400 600 800
0
Indentation load,
P/
mN
Indentation depth, h /µm
(a)
Indentation creep during hold time
No Indentation creep during hold time
P = 1 [mNs-1]
P = 100 [mNs-1]
12 10 8 6 4 2
0 200 400 600 800 1000 1200
0
Indentation load,
P/
mN
Indentation depth, h /µm
(b)
Indentation creep during hold time
No Indentation creep during hold time
P = 1 [mNs-1]
P = 100 [mNs-1]
8 6
4 2
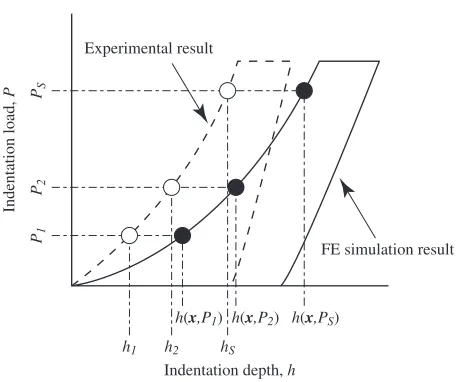
variable and N is total number of design variables. In this paper, the objective function is defined as a normalized squared deviation between experimentally obtained inden-tation depth h
s and the corresponding FE simulation result
hðx;PÞ10)(see Fig. 2):
F0ðxÞ ¼ XL
¼1
FðxÞ ð3Þ
FðxÞ ¼
XS
s¼1
ðhs hðx;PsÞÞ2
XS
s¼1
ðhsÞ2
ð4Þ
where L is the total number of P-h curves (in this paper,
L¼4, for two types of indenter for two loading speeds) and
FðxÞ is the squared deviation for the-thP-h curve. The following notations are used for other variables:
P
s: ð¼1;. . .;L;s¼1;. . .;SÞ: the discrete data points, corresponding to the discrete values of the load in the-th
P-hcurve,
hs: the value of the indentation penetration depth corre-sponding to the value of the experimental history param-eter (loadPs),
hðx;PsÞ: the value of the indentation penetration depth obtained from the FE simulation,
: the weight coefficient that determines the relative contribution of information yielded by the-thP-hcurve.
3.3 Multipoint approximation methodology based on
response surface fitting
The response surface method is employed to minimize the objective function. Since nonlinear FE simulation requires a tremendous amount of computation time, a multipoint approximation methodology based on response surface fitting (MARS), which was originally implemented by Toropov,11) is applied to this problem. This optimization technique replaces the original optimization problem with a sequence of approximate optimization problems:
~
F
Fk0ðxÞ !minimize ð5Þ
~
A
Aki xiBB~ki ~
A
Aki A;BB~ki B;ði¼1;. . .;NÞ ð6Þ
where k is the iteration number. In each iteration, the approximate response functions FF~k
0ðxÞ are intended to be
adequate in a current search subdomain. This is achieved by the appropriate planning of numerical experiments and the use of move limits defined by the side constrainsAA~k
i andBB~ki. The approximation is determined using weighted least squares, which leads to
GkðaÞ ¼ XP
p¼1
wkp½F0ðxpÞ FF~0kðxp;a
kÞ2!minimize ð7Þ
Here, minimization is carried out with respect to the tuning parametersak, wherewk
prefers to the weight coefficient and
p;ðp¼1;. . .;PÞis the number of experimental points. In this technique, only the simplified approximation functionFF~k
0ðxÞ
is used, so that the total computation time for the whole optimization process can be reduced. In this paper, an approximate response functionFF~k
0ðxp;akÞ is expressed by a
full quadratic polynomial form in design variable vectorx:
~
F
Fðx;aÞ ¼a0þ XN
i¼1 aixiþ
XN
ij
aijxixj ð8Þ
which contains ðNþ1ÞðNþ2Þ=2 tuning parameters to be found in each iteration by the least–squares surface fitting.
3.4 Optimization based on the interaction of high- and
low-fidelity models
For numerical simulation, FE code of MSC Marc-K7.3 was employed. Since three-dimensional analysis requires tremendous computation time for solving elasto-viscoplastic contact problems, the model of micro-indentation was built with axisymmetric four-node elements as an approximation, where the shape of the Berkovich indenter was approximated to that of the cone indenter, which has the same contact area at a given indentation depth as that of the Berkovich indenter.12)The radius and height of the material are 600mm
and 600mm, respectively. 35 GPa for Young’s modulus and 0.3 for Poisson’s ratio, which are obtained from the uniaxial tension test result, are used.
An iterative numerical optimization procedure for the material parameter identification needs a large number of FE simulation iterations. Additionally, even a single FE simu-lation process of micro-indentation for elasto-viscoplastic materials requires a long computation time. Therefore, a low-fidelity FE simulation (e.g.FE simulation using coarse mesh) in conjunction with approximation functions is introduced to reduce the number of high-fidelity FE simulations and shorten the computation time considerably while maintaining the accuracy of the response corresponding to the high-fidelity FE simulations. The following approximation func-tion ff~ðx;bÞhas been used instead of the original onesF0ðxÞ
for the iterative response analysis in the optimization procedure:
~
ffðx;bÞ ¼fðxÞ þCðx;bÞ ð9Þ
where fðxÞ is the response of objective function using the low-fidelity simulation,Cðx;bÞis the approximation function used to correct the accuracy of the objective function of low-Indentation depth, h
Indentation load,
P
P1
h(x,P1)
h1 h2 hS
h(x,P2) h(x,PS)
P2 PS
FE simulation result Experimental result
[image:3.595.55.284.67.258.2]fidelity simulation fðxÞ, and the vectorbconsists of tuning parameters. In this paper, the approximation using a linear model with a full cubic polynomial was employed.
Cðx;bÞ ¼b0þ XN
i¼1 bixiþ
XN
ij
bijxixjþ XN
jk
bijkxixjxk ð10Þ
Figure 3 shows the high- and low-fidelity FE models used for the parameter identification of lead-free solder. 701 nodes and 621 elements were employed for the high-fidelity model, while 181 nodes and 100 elements were used for the low-fidelity model. The computation time for a single simulation for the high-fidelity model is about 24 hours, while it is 3 hours for the low-fidelity model. The choice of the design of experiments can have a large effect on the accuracy of the correction function. In this work, the approach employed by Audze and Eglais13)and later used by Rikards14)is adopted.
– the number of levels of factors (the same for each factor) is equal to the number of experiments,
– there is only one experiment for each level,
– the points of experiments are distributed as uniformly as possible in the domain of variables.
In this paper, 10 design points were selected to build the approximation function and another 5 points were evaluated
to verify the accuracy of objective function values of the corrected low-fidelity model compared with results of the high-fidelity model.
4. Material Parameter Identification Procedure
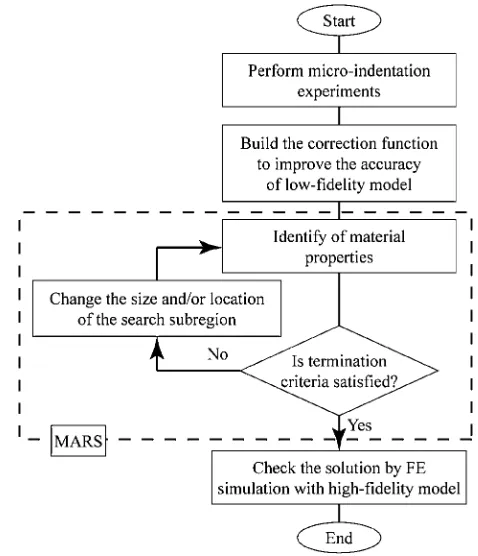
Material parameter identification using micro-indentation, FE simulation and optimization can be carried out by following the subscribed procedure:
(1) Obtain aP-hcurve from a micro-indentation test, (2) Perform numerical experiments for high- and
low-fidelity models and build the approximation function to improve the accuracy of low-fidelity model,
(3) Determine the material parameters by fitting the numerically obtained P-h curves to the corresponding experimental result obtained at step 1 by multi point approximation methodology based on response surface fitting,
(4) Perform the high-fidelity FE simulation incorporating the identified set of material parameters, then check the validity of the obtained parameter values.
Figure 4 shows the flowchart of the proposed parameter identification system.
5. Results and Discussion
5.1 Validity of parameter identification results
As a result of parameter identification using the proposed system, C¼8:241023 and n¼11:3 were obtained.
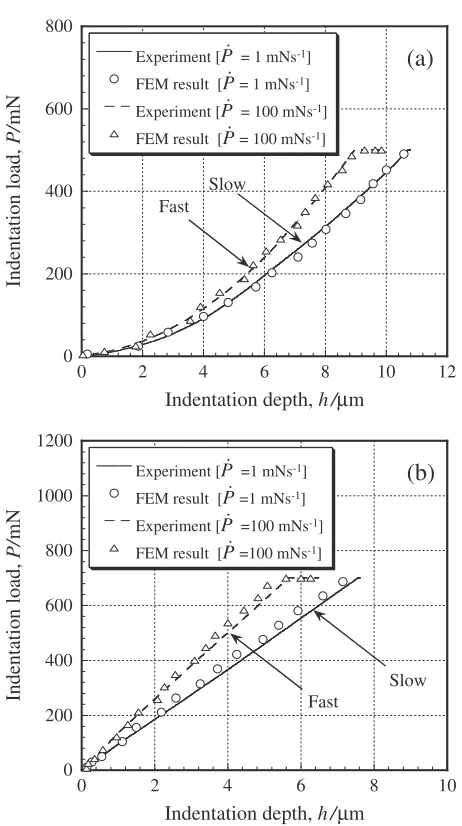
Figures 5(a) and (b) show experimentalP-hcurves and the corresponding FE simulation results incorporating the iden-tified set of material parameters for the Berkovich indentation Fig. 3 FE models of micro-indentation. (a) High-fidelity model using fine
mesh; (b) low-fidelity model using coarser mesh.
[image:4.595.304.543.71.349.2] [image:4.595.75.263.71.458.2]and spherical indentation, respectively. P-hcurves obtained from FE simulations show a good agreement with the corresponding curves of the experiment. In these figures, FE simulations accurately reproduce the rate-dependent P-h
responses at loading and holding parts. To validate thus identified material parameters, a bulk compression experi-ment of the same material (a cylindrical specimen with a diameter of 6 mm and a height of 10 mm) was performed. In Fig. 6, the strain rate vs. stress relation given by eq. (1) incorporating the identified set of material parameters was compared with the bulk compression test result. From this figure, it is confirmed that the material parameters obtained from the micro-indentation experiment/simulation agree well with those determined from the bulk compression experiment.
5.2 Identification of viscoplasticity parameters from
micro-indentation with self-similar indenters Let us assume that the equivalent viscoplastic strain rate is given as a unique function of the equivalent stress.5,7,15)The
deformation under micro-indentation is mostly viscoplastic; hence, for self-similar indentation such as the Berkovich indentation, the equivalent viscoplastic strain rate """"_ at a certain point in a material is proportional to the normalized indentation penetration velocityhh_=h. Namely,
_ " " " "¼k1
_
h h
h !
ð11Þ
where k1 is a constant depending on the position of the
material element. Since the distribution of strain rate depends on the power law exponentnin eq. (1),k1also depends onn.
On the other hand, indentation loadPis proportional to the equivalent stressand the contact area between the indenter and the material, A. If we ignore the pile-up and sink-in during the indentation,Ais almost proportional toh2, so that:
Pk2h2 ð12Þ
where k2 is a constant that depends on the position of the
material element and n. Provided that the equivalent stress
remains almost constant under the constant loading speed _
P
P, the following relation can be obtained.
_
P
P2k2hhh_ ð13Þ
From eqs. (1) and (11), indenter-penetration velocity is given by the following equation:
_
h h¼Ch
k1
0 n
ð14Þ
From eqs. (12)–(14), we finally obtain:
_
P
P0n=nþ1C1=nþ1PP_1=nþ1h2n=nþ1 ð15Þ
where ¼ ðk1k2n=2Þ
1=nþ1 is a nondimensional value. This
equation is useful for determining the viscoplasticity param-eters. If two P-h responses Pð1Þhð1Þ and Pð2Þhð2Þ for
different loading speedsPP_ð1ÞandPP_ð2Þare obtained, the power
law exponent n can be easily calculated. Using indentation loads, Pð1Þ and Pð2Þ, at the same penetration depth
0 200 400 600 800
0
Experiment [P = 1 mNs-1]
FEM result [P = 1 mNs-1]
Indentation load,
P/
mN
Indentation depth, h/µm
(a)
Slow Fast
0 200 400 600 800 1000 1200
0
Indentation load,
P/
mN
Indentation depth, h/µm
(b)
Slow Fast
Experiment [P = 100 mNs-1]
FEM result [P = 100 mNs-1]
Experiment [P =1 mNs-1]
FEM result [P =1 mNs-1]
Experiment [P =100 mNs-1]
FEM result [P =100 mNs-1]
10 8
6 4
2
12 10 8 6 4 2
Fig. 5 ExperimentalP-hcurves for Sn-3.5Ag-0.75Cu lead-free solder and the corresponding results of FE simulation incorporating the identified set of material parameters, for two cases in which (a) Berkovich indenter and (b) spherical indenter are used.
10-3 10-2
10-1
100
101 102 103 104
Compression test result
Creep strain rate,
ε
/s
-1
Stress,
σ
/MPaε
= 8.24
×
10
-23σ
11.3 [image:5.595.54.285.66.479.2] [image:5.595.313.540.74.272.2](hð1Þ ¼hð2Þ), the following relation is obtained from eq. (15).
n¼logð
_
P Pð2Þ=PP_ð1ÞÞ
logðPð2Þ=Pð1ÞÞ
1 ð16Þ
If is known, constant C can be calculated from eq. (15). Thus, the calculatedn value for Sn-3.5Ag-0.75Cu lead-free solder alloy is 15.2, which is a bit larger than the value of
n¼11:3 identified using the inverse approach. Such a discrepancy is attributed to the fact that eq. (15) includes some rough approximations and uncertain assumptions. Despite the rough approximation of determined material parameters, this simplified dimensional analysis might be useful for determining the first estimation of material parameters for the FE-simulation-based inverse approach, since FE simulations of micro-indentation for viscoplastic materials need a large amount of computation time.
6. Conclusions
A material parameter identification system, in which material parameters are determined by fitting theP-hcurve obtained from FE simulation to the corresponding exper-imental result, together with the optimization technique, has been proposed. An algorithm of the interaction of high- and low-fidelity models was adopted to reduce computation time. Viscoplasticity parameters of Sn-3.5Ag-0.75Cu lead-free solder alloy were determined using the proposed system. Since the obtained parameter values showed a good agree-ment with the uniaxial compression test result, the validity of this system was clarified.
Note that the use of the loading part of the P-h curve together with the creep-indentation data for the identification of viscoplasticity properties is our new idea, and this approach works well. Although only Norton’s law was
discussed in the present work, as an example of the simplest viscoplasticity model, the present system for material parameter identification has a great potential to deal with more complicated constitutive models that describe the strain hardening of materials.
REFERENCES
1) Q. Yu, Y. Kaga, M. Shiratori and M. Kifune: Trans. J. Soc. Mech. Eng. A67(2001) 216–224 (in Japanese).
2) K. Ohguchi and K. Sasaki: Trans. J. Soc. Mech. Eng. A68–673(2002) 1328–1335 (in Japanese).
3) X. Ma and F. Yoshida: Sci. Technol. Weld. Joining8-2(2003) 154– 156.
4) K. Ohguchi, K. Sasaki, H. Ishikawa and A. Yanagimoto: Proceedings of the 2000 Annual Meeting of JSME/MMD (Japan Soc. Mech. Eng., 2000) 519–520.
5) P. M. Sargent and M. F. Ashby: Mater. Sci. Technol.8(1992) 594–601. 6) M. Fujiwara, M and Otsuka: Mater. Sci. Eng. A319–321(2001) 929–
933.
7) A. Miyamoto, T. Ogawa and T. Ohsawa: J. Soc. Mater. Sci., Jpn.51
(2002) 445–450.
8) M. Nakamura, S. Maki, T. Nishino, Y. Abuku and N. Nagai: J. Jpn. Soc. Technol.26–295(1985) 862–868.
9) X. Ma, F. Yoshida and K. Shinbata: Mater. Sci. Eng. A344(2003) 296–299.
10) V. V. Toropov:Optimal Design with Advanced Materials, (Elsevier Science Publishers B.V., 1993) pp. 113–130.
11) V. V. Toropov: In:Emerging Methods for Multidisciplinary Optimi-zation, CISM Courses and Lectures, No. 425, International Centre for Mechanical Sciences, (Springer-Verlag, 2001) pp. 205–256. 12) K. Kanazawa, H. Hirokawa and T. Yoshizawa: Trans. J. Soc. Mech.
Eng. A63(1997) 567–576 (in Japanese).
13) P. Audze and V. Eglais: New approach to planning out of experiments, Problems of Dynamics and Strengths35(1977) 104–107 (in Russian). 14) R. Rikards: Proc. IUTAM Symp. (Elsevier, 1993) 149–162. 15) T. Ogawa, A. Miyamoto, K. Ohshimizu and T. Ohsawa: J. Soc. Mat.