Acquisition and Analysis of Continuous Acoustic Emission Waveform
for Classification of Damage Sources in Ceramic Fiber Mat
Kaita Ito
*and Manabu Enoki
Department of Materials Engineering, The University of Tokyo, Tokyo 113-8656, Japan
Waveforms of acoustic emission (AE) events come close and sometimes overlap each other when AE activity is very high. Conventional AE measurement systems which handle discrete AE events are not suitable for this situation because miss-detection of AE event occurs frequently. A new AE measurement system named as Continuous Wave Memory (CWM) was developed to solve this problem by recording the AE waveforms continuously to hard disks for several hours throughout the testing time. This new system enabled multiple analysis of one waveform with different filtering parameters. Short time Fourier transform (STFT) gave the time–frequency–magnitude characteristic of continuous AE waveforms and useful information for evaluation of degradation of materials. In this study, the degradation of ceramic fiber mat during cyclic compression test and the effect of binder-addition were evaluated by this new system. STFT results clearly showed the classification of degradation of the mat; breakage of fibers was the main source in the early compression cycles and sporadic friction between fibers became the main source of AE in the later compression cycles. The effect of organic binder to prevent the degradation of the mat was also estimated. It was observed that the friction signal disappeared and the breakage signal weakened in the binder-added specimens.
[doi:10.2320/matertrans.I-MRA2007850]
(Received September 5, 2006; Accepted February 27, 2007; Published May 25, 2007)
Keywords: acoustic emission, continuous wave memory, continuous waveform recording, ceramic fiber mat, short time Fourier transform
1. Introduction
Waveforms of acoustic emission (AE) events come close and sometimes overlap each other when AE activity is very high. In such environment, conventional AE measurement systems frequently fail to detect AE events because they process AE events sequentially while the next event arrives within the dead-time of the last event. In our previous studies,1,2) AE events of ceramic fiber mat were measured
under cyclic compression tests to estimate the gradual degradation of gripping force of the mat which fixes the catalytic converter of car exhaust gas inside the case. However, conventional AE measurement systems frequently missed the AE events as the increase of compression stress, leading finally to saturation of signal processing.
Continuous recording of AE waveform is an idea to solve this dead-time problem. An AE system based on digital signal processing has been commercially available, making continuous data recording possible. Thompson et al.3) suggested a system to monitor the critical period of fracture propagation of rocks. However, the recording time of their system was very limited to a few minutes because they adopted semiconductor memory as the storage device of continuous AE waveform. Kurz et al.4) showed another
system which can record the transient AE waveforms as long as one AE event length without interval to high-capacity hard disks. However, their system could not handle the continuous AE waveform directly and their 2.5 MHz sampling frequency was not enough for usual AE measurement of materials. Semiconductor memory and hard disk have trade-off rela-tionship between their speeds and capacities, therefore it is important to utilize the advantages of both devices to develop a practical continuous AE waveform recorder.
In this study, a new AE measurement and analysis system was developed to solve the problems about dead-time and
storage device, and evaluated the degradation of the ceramic fiber mat. This new system was named ‘‘Continuous Wave Memory’’ (CWM) and enabled continuous recording of AE waveforms with 10 MHz sampling frequency to hard disks for several hours. Short time Fourier transform (STFT)5)was adopted as a method for direct handling of continuous AE waveforms and gave the time–frequency–magnitude charac-teristic of the continuous AE waveforms as useful informa-tion for classificainforma-tion of degradainforma-tion6) of the ceramic fiber
mat.
2. Continuous Wave Memory 2.1 Hardware
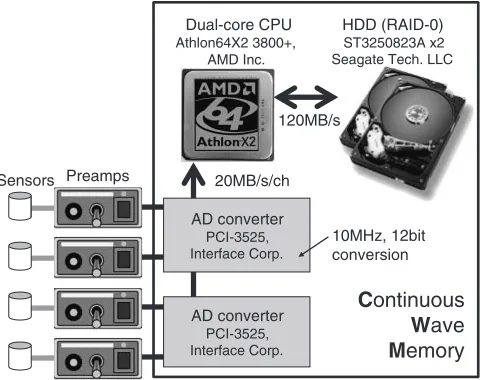
Figure 1 shows block diagram of the hardware of CWM system. CWM is built up by PC and commodity type hardware. CWM can convert 4 ch AE signals into digital
Sensors Preamps
HDD (RAID-0) ST3250823A x2 Seagate Tech. LLC
Continuous
Wave
Memory
Dual-core CPU Athlon64X2 3800+,
AMD Inc.
AD converter PCI-3525, Interface Corp.
AD converter PCI-3525, Interface Corp.
10MHz, 12bit conversion 120MB/s
20MB/s/ch
Fig. 1 Block diagram of the CWM hardware.
*Graduate Student, The University of Tokyo
Special Issue on Advances in Non-Destructive Inspection and Materials Evaluation
[image:1.595.307.547.577.767.2]waveform data continuously with 10 MHz sampling fre-quency and 12bit resolution by high-speed analog-to-digital converter (PCI-3525, Interface Inc.). The digitalized wave-form data are recorded to hard disk array which is parallelized and accelerated by RAID-0 technology.7) The
data recording rate is 20 MB/s/ch, therefore the maximum recording time is 1.7 hours for 4 ch or 6.9 hours for 1 ch in the current hard disk with a capacity of 500 GB.
2.2 Software
Figure 2 shows block diagram of the software of CWM system to handle the continuous AE waveform. In this software, multiple steps of signal processing can be per-formed in parallel on a common ring-buffer to reduce calculation time by effective use of multi-core CPU. In real-time analysis, a measured waveform is directly imported from analog-to-digital converter just like conventional AE measurement systems and AE parameters are calculated immediately. Post analysis with different filtering parameters is also possible using completely recorded AE waveform. Short time Fourier transform (STFT) is one of evaluation methods of continuous waveform, which calculates time– frequency–magnitude characteristic along the procedure as shown in Fig. 3. A continuous AE waveform is split into short sections with 1024 samples, the split waveforms are applied to FFT method one-by-one, and 4096 FFT results are averaged to adjust the time resolution and plotted in the form of 3D graph. The horizontal axis shows density of the mat which is converted from the time data and the vertical axis shows frequency of AE signal and the 3rd axis which is expressed as the contrast change reflecting the magnitude of AE signals at this point.
3. Experimental Procedures
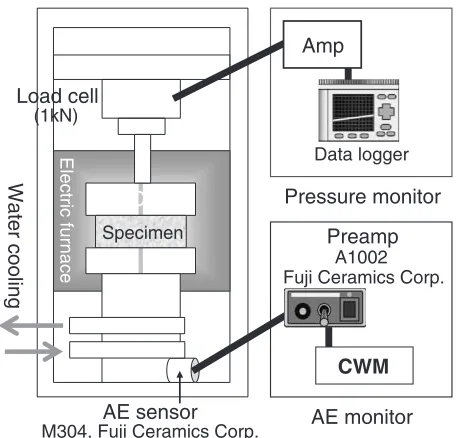
Ceramic fiber mat of catalytic converter unit was com-pressed cyclically with experimental equipments as shown in Fig. 4. The commercial mat with component of 72% alumina and 28% silica was cut into cylindrical shape of 25.4 mm in diameter. The load and AE signal were monitored during the tests. AE signal was captured by piezoelectric lead zirconate titanate (PZT) sensor with built-in head-amp (M304, Fuji Ceramics corp.). The sensor has a flat frequency character-istic from 200 kHz to 600 kHz. The signal was amplified again by preamplifier (A1002, Fuji Ceramics corp.) and then inputted to CWM system. The SiC jig was water cooled around the sensor to keep the constant sensitivity of PZT and ensure performance of the head-amp in the sensor package
from the heat of the electric furnace. The range of compression was controlled by density of specimen which was calculated from the gap of upper and lower parts of jig because the weight and the cross-section area of spongy mat specimen were almost constant during the cyclic compres-sion test.
Degradation of the gripping force occurs during press-fit part of manufacturing process and also in-service period. Although an organic binder is added before the press-fit process to reduce the damage of fibers, it is volatilized by the heat of the first running of engine. Therefore, two conditions of compression were tested as follows. The specimens with variable content of organic binder were compressed from completely unloading state as 0.150 g/cm3to 0.400 g/cm3at room temperature to simulate the press-fit process. On the other hand, only binder-less specimens were compressed cyclically between 0.331 g/cm3 and 0.376 g/cm3 at room temperature to simulate the in-service environment.
[image:2.595.46.291.75.173.2]4. Results and Discussion
Figure 5 shows AE signals with high activity from a mat specimen by CWM and schematic of AE event processing in
AE event RMS voltage Frequency filter STFT …etc. Measured waveform (from ADC) Recorded waveform (from HDD) Filtered waveform (to HDD) AE parameters Real-time Analysis Post Analysis Processing Input Output
Fig. 2 Block diagram of the CWM software.
Measured Waveform (Time and Voltage)
STFT Data (Time, Frequency
and Magnitude) STFT
(1024 samples window)
Time to Mat density
Density, ρ/ g/cm3
Frequency
, f / kHz
Fig. 3 Calculation procedures of short time Fourier transform (STFT).
SiC jig
Specimen
AE sensor
M304, Fuji Ceramics Corp.
Load cell (1kN) Water cooling Electric furnace Preamp A1002 Fuji Ceramics Corp.
CWM
AE monitor
Data logger
Pressure monitor Amp
[image:2.595.297.548.76.207.2] [image:2.595.314.542.251.470.2]conventional AE measurement systems. Conventional sys-tems detect an AE event when the amplitude of AE signal exceeds the pre-set threshold voltage and then process it one-by-one sequentially. Therefore, miss-detection of an event occurs if the next event arrives within the dead-time of the previous event. On the contrary, there is no dead-time on CWM system and all events can be detected successfully even AE signals with high activity.
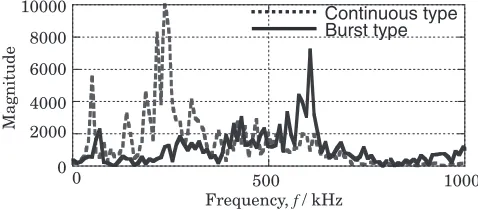
Figures 6 and 7 show waveforms and frequency character-istics of two typical types of AE events which were detected during the cyclic compression test of the ceramic fiber mat. The sources of these waveforms can be considered to be related to the shape of waveforms;6)the burst type waveform
with 600 kHz peak frequency is thought to be due to breakage of fibers and the continuous type waveform with 200 kHz peak frequency is due to friction of fibers, respectively. These frequency characteristics are reasonable because it is well known that the frequency of the AE signal has positive correlation with the formation time of the event.8) The
breakage of fiber should be result from faster event than the friction between fibers, therefore the breakage of fibers has higher peak frequency than the friction between fibers.
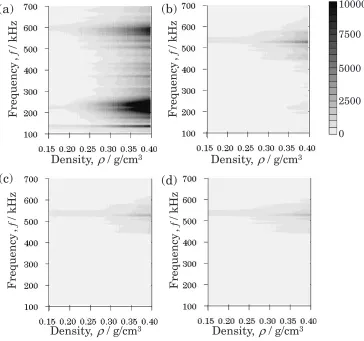
Figure 8 shows STFT results of the 1st compression of specimens with different fraction of organic binder. The magnitude is normalized by the maximum magnitude in each graph. Although similar frequency characteristic with two
peaks as shown in Fig. 7 in binder-less specimen is observed, the breakage signal with 600 kHz peak frequency becomes weaker as addition of the binder and the friction signal with 200 kHz peak frequency almost disappears in binder-added specimens. Figure 9 shows the maximum value of magnitude of these two peak frequencies and the pressure during the 1st compression cycle,i.e.at the highest compressed state. These results show that the organic binder has a positive effect in protecting the ceramic fibers from the damage in compres-sion. It is reasonable that the organic binder prevents the friction between fibers because the observation result (Fig. 10) shows that the organic binder mainly bonds the cross point of fibers.
Figure 11 shows results in the 1st, 10th and 70th compression of the binder-less specimens. Although both the breakage signal and the friction signal become stronger as the progress of compression during the 1st compression, there is only a sporadical friction signal during the 70th compression. The characteristic of AE signal changed gradually during the cyclic compression test, so the result of the 10th compression demonstrates the transition behavior. Figure 12 also shows results of 10% binder-added specimen for the 1st, 10th and 70th compression. The friction signal is not observed and there are only weak breakage signals throughout the test. Figures 13 and 14 show SEM photo-graphs of a binder-less and a binder-added specimen which were taken on the same place of the same specimen before and after 10 and 1000 cycles of compression. In binder-less specimen, the SEM observation shows that the fibers are gradually rearranged to uneven distribution and finally large voids appear. On the contrary, no rearrangement is seen in -0.4
-0.2 0 0.2 0.4
0 2000 4000 6000 8000 10000
V
o
ltage,
V
/ V
Missed event
by conventional systems : Measuring : Dead-time
Time, t / µs
Threshold voltage
Fig. 5 An example of AE signal with high activity.
(a)
-20
0
20
40
60
0.1
0
-0.1
V
o
ltage,
V
/ V
Time,
t
/
µ
s
(b)
-0.1
0
0.1
-20
0
20
40
60
V
o
ltage,
V
/ V
Time,
t
/
µ
s
Fig. 6 Typical AE waveforms of (a) continuous type and (b) burst type.
Continuous type Burst type
0 2000
0 6000 8000 10000
500 1000
4000
Frequency, f / kHz
Magnitude
[image:3.595.55.283.73.245.2] [image:3.595.307.546.75.180.2] [image:3.595.112.483.633.768.2]binder-added specimen. These results show that the friction AE signal reflected this sporadic rearrangement of fibers and the organic binder effectively prevented the rearrangement of fibers.
5. Conclusions
(1) An AE measurement system named ‘‘Continuous Wave Memory’’ (CWM) was developed in order to record AE waveforms continuously to hard disks for several hours with sufficient high sampling frequency.
(2) Continuous AE waveform of ceramic fiber mat was measured and analyzed by CWM system during cyclic
compression test. Time–frequency–magnitude charac-teristic of AE signal was calculated by short time Fourier transform (STFT) method to classify the source of AE. Two peak frequencies were found at 600 kHz and 200 kHz in these tests and the sources of AE were attributed to the breakage of fibers and friction between fibers, respectively.
(3) Effect of organic binder in the ceramic fiber mat was evaluated by CWM and SEM observation. The friction
(b)
Density,
ρ
/ g/cm
3Frequency
,
f
/ kHz
Density,
ρ
/ g/cm
3(a)
Frequency
,
f
/ kHz
(c)
Density,
ρ
/ g/cm
3Frequency
,
f
/ kHz
(d)
Density,
ρ
/ g/cm
3Frequency
,
f
/ kHz
0 5000 10000
7500
2500
Fig. 8 STFT results of (a) 0%, (b) 1%, (c) 5% and (d) 10% binder specimens during the 1st compression.
Binder content (%)
Magnitude
Friction (200kHz) Breakage (600kHz)
0 5000 10000 15000 20000
0 5 10
Fig. 9 Binder contents vs. the magnitude of STFT.
[image:4.595.115.479.76.417.2]50µm
[image:4.595.306.549.456.639.2] [image:4.595.57.282.459.593.2](a)
Density, ρ/ g/cm3
Frequency
,
f
/ kHz
Density, ρ/ g/cm3
Frequency
,
f
/ kHz
(b)
Density, ρ/ g/cm3
Frequency
,
f
/ kHz
[image:5.595.85.513.75.220.2](c)
Fig. 11 STFT results of a binder-less specimen during the (a) 1st, (b) 10th and (c) 70th compression.
1mm
(a)
1mm
(b)
[image:5.595.83.514.267.414.2]1mm
(c)
Fig. 13 SEM observation of binder-less specimen (a) before, (b) after 10 cycles and (c) after 1000 cycles of compression.
(a)
Density, ρ/ g/cm3
Frequency
,
f
/ kHz
Density, ρ/ g/cm3
(b)
Frequency
,
f
/ kHz
(c)
Density, ρ/ g/cm3
Frequency
,
f
[image:5.595.71.526.458.587.2]/ kHz
Fig. 12 STFT results of a 10% binder-added specimen during the (a) 1st, (b) 10th and (c) 70th compression.
1mm
(a)
1mm
(b)
1mm
(c)
[image:5.595.72.528.637.768.2]AE signal due to rearrangement of fibers was not detected in binder-added specimens. These results show that the organic binder has a positive effect in protecting the fibers from the damage under compression. (4) Both the breakage and friction signals were detected
during the early cycles in binder-less specimens, while there was only sporadical friction signal in the later cycles. On the other hand, there was only weak breakage signal throughout the test in binder-added specimens. Degradation process during cyclic compo-sition for both binder-less and binder-added specimens were clearly identified by AE.
Acknowledgement
The present research is supported by Ibiden Co., ltd. and the 21st Century COE Program ‘‘Human-Friendly Materials based on Chemistry’’ from the Ministry of Education, Culture, Sports, Science, and Technology of Japan.
REFERENCES
1) K. Ito, M. Enoki and H. Takahashi: Review of Progress in Quantitative Non-destructive Evaluation24(American Inst. Phys., 2004) pp. 1129– 1136.
2) K. Ito, M. Enoki and H. Takahashi:Progress in Acoustic Emission XII (Japanese Soc. for Non-destructive Inspection, 2004) pp. 77–84. 3) B. D. Thompson, R. P. Young and D. A. Lockner: Pure and Appl.
Geophys.163(2006) 995–1019.
4) J. H. Kurz, V. Wolter, G. Bahr and M. Motz: Otto-Graf-Journal 14 (2003) 115–130.
5) M. K. Klymik, I˙. Gu¨ler, A. Dizibu¨yu¨k and M. Akin: Computers in Bio. Med.35(2005) 603–616.
6) X. Li: Int. J. Machine Tools and Manufacture42(2002) 157–165. 7) D. A. Patterson, G. A. Gibson and R. H. Katz: Proc. SIGMOD 1988,
(ACM SIGMOD, 1988) pp. 109–116.