Effect of Annealing Temperature on Microstructure
and Shape Memory Characteristics of Ti–22Nb–6Zr(at%) Biomedical Alloy
Jae Il Kim
1;2, Hee Young Kim
1, Tomonari Inamura
3, Hideki Hosoda
3and Shuichi Miyazaki
1;* 1Institute of Materials Science, University of Tsukuba, Tsukuba 305-8573, Japan
2Materials Science and Engineering, Dong-A University, Busan 604-714, Korea
3Precision and Intelligence Laboratory, Tokyo Institute of Technology, Yokohama 226-8503, Japan
Effect of annealing temperature on microstructure and shape memory characteristics of Ti–22Nb–6Zr(at%) biomedical alloys was investigated by using tensile tests, XRD measurement, scanning electron microscopy (SEM) and transmission electron microscopy (TEM). After severe cold-rolling, the plate was annealed at temperatures between 773 and 1173 K. The=transus temperature in this alloy was determined to be between 823 and 873 K. The specimen annealed at 823 K for 3.6 ks exhibited a fine subgrain structure. A fully recrystallized structure was observed in the specimens annealed above 873 K. The annealing temperature less affected the transformation temperature and recovery strain. However, the critical stress for slip decreased considerably with increasing annealing temperature, because the grain size increased. All specimens annealed above 823 K exhibited stable superelastic behavior at room temperature.
(Received November 4, 2005; Accepted December 21, 2005; Published March 15, 2006)
Keywords: shape memory effect, superelasticity, biomaterials, titanium based alloy, titanium–niobium–zirconium, Hall–Petch relationship
1. Introduction
Ti-based alloys have been applied as biomedical materials to date due to their high corrosion resistance, high bio-compatibility and low Young’s modulus. Among biomedical alloys, Ti–Ni alloys have been applied as orthodontic arch wires, bone plates and stents, owing to their unique shape memory effect and superelasticity. However, it has been reported that pure Ni is a toxic element and causes
Ni-hypersensitivity.1) Although clear Ni-hypersensitivity to
human body in Ti–Ni alloys has not been reported until now, it is preferable to develop absolutely safe Ni-free Ti-based shape memory alloys for biomedical applications.
Many -type Ti-based alloys have been investigated to
date, e.g., Ti–V based alloys,2) Ti–Mo based alloys3–8)and
Ti–Nb based alloys9–15) since Baker reported the shape
memory effect in a Ti–35 mass%Nb alloy.9) Considering
biomedical applications, the Ti–V based alloys are not
suitable because of cytotoxicity of V.16)The shape memory
effect in the Ti-based alloys may be affected by the following factors; (1) aging treatment, which may cause precipitation
hardening due to phase and ! phase and (2)
thermo-mechanical treatment (cold work followed by annealing), which may improve shape memory characteristics by dense
dislocations and grain refinement. The fine thermal !
precipitates formed by aging treatment improve the shape memory properties, because they increase the critical stress for slip. On the other hand, it is known that grain refinement
viacold working followed by low temperature annealing may
be useful method for improving mechanical properties of alloys. However, no systematic research on the effect of annealing condition on the shape memory characteristics has
been carried out in the-type Ti-based alloys to date.
Recently, the effect of Zr addition to the Ti–Nb alloy on
shape memory characteristics has been reported.15)
Accord-ing to this study, a solution-treated Ti–22Nb–6Zr(at%) alloy exhibits superior superelastic behavior at room temperature
than Ti–Nb binary alloys. In the present study, in order to improve shape memory characteristics of Ti–22Nb–6Zr(at%) alloy, the effect of annealing temperature on shape memory characteristics were investigated by tensile tests at various temperatures, XRD (X-ray diffraction) measurement, scan-ning electron microscopy (SEM) and transmission electron microscopy (TEM).
2. Experimental
A Ti–22Nb–6Zr(at%) ingot was fabricated by an Ar arc melting method. The ingot was cold-rolled to a plate of 0.5 mm in thickness with a final cold working ratio of 95%. Specimens for XRD measurement, tensile tests, SEM observation and TEM observation were cut from the plate by an electro-discharge machine. All the specimens were finally annealed at 773, 823, 873, 973, 1073 K for 3.6 ks and 1173 K for 1.8 ks in an Ar atmosphere, followed by quenching into water. After the annealing treatment, the specimens were etched in order to remove oxidized surface. In order to investigate the shape memory characteristics,
tensile tests were carried out at a strain rate of 1:67
104s1 at various temperatures. The gage length of
speci-mens for tensile tests was 20 mm. XRD measurement was
conducted at room temperature with Cu K radiation to
determine the constituent phases. Specimen for TEM observation were prepared by a conventional twin-jet polish-ing technique uspolish-ing an electrolyte solution of 5 vol% sulfuric acid, 2 vol% hydrofluoric acid and 93 vol% methanol at 230 K. The TEM observation was conducted using a JEOL2010F microscope operated at 200 kV. Grain size was measured using SEM micrographs.
3. Results and Discussion
3.1 Effect of annealing temperature on microstructure
In order to identify the constituent phases of each annealed specimens at room temperature, X-ray diffraction measure-ment was carried out. Figure 1 shows X-ray diffraction
*Corresponding author, E-mail: [email protected]
Special Issue on Shape Memory Alloys and Their Applications
profiles of the specimens annealed at temperatures between
773 and 1173 K. Within the2range shown in this figure, the
phase is identified by two major reflections from (100)and
(110), whereas the phase is identified by three major
reflections. Comparing with the intensities of {211}peak in
the specimens annealed at 773 and 823 K, those of {200} peak are very strong. It is assumed that this is due to a
deformation texture. Kim et al.17) reported that a well
developedf100gh110i texture was obtained in as-rolled and
annealed Ti–22Nb–6Ta alloys after severe cold-rolling. On
the other hand, the intensities of {211} peak are stronger
than those of {200}peak in the specimens annealed at 1073
and 1173 K. This is due to a recrystallization texture. It has
been also reported that a recrystallization texture of112h110i
is developed in Ti–22Nb–6Ta17)and Ti–22Nb–3Al18)alloys
heat treated at 1173 and 1273 K, respectively, after severe
cold-rolling. Based on previous researches17,18)and present
XRD results, it is expected that the deformation and recrystallization texture of Ti–22Nb–6Zr alloy exhibit similar one as those of other Ti–Nb based alloys. It is also
noted that both of the {200} peak and {211} peak are
strong in the specimen annealed at 873 K for 3.6 ks, indicating that the deformation and recrystallization textures coexist.
While the diffraction peaks corresponding to thephase
are observed in the specimens annealed at 773 and 823 K,
there exist only the peaks corresponding to thephase in the
specimens annealed above 873 K. This means that the =
transus temperature of this alloy is between 823 and 873 K.
According to the Ti–Nb binary phase diagram, the =
transus temperature of Ti–22Nb is about 830 K. This
indicates that the addition of Zr does not affect the =
transus temperature significantly. On the other hand, the
peaks corresponding to 00 can not be observed in any
specimen. This indicates that the martensitic transformation
start temperature (Ms) of these specimens is below room
temperature.
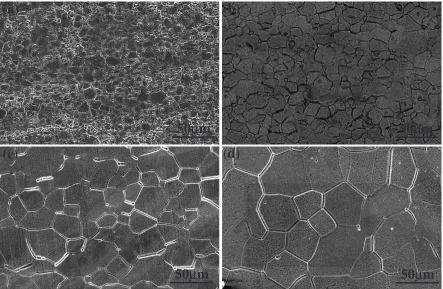
Figure 2 shows the microstructures observed by SEM in the specimens annealed at 873, 973, 1073 and 1173 K. It is
also clear that no martensite phase (00) was observed in all
annealed specimens. As shown in these figures, any secon-dary phase can not be observed. The results of these SEM micrographs are well consistent with those of the XRD
30° 40° 50° 60° 70° 80°
β(211)
Intensity (a.u.)
β(200)
α(100) α(110)
β(110)
773K 823K 873K 973K 1073K 1173K
2θ
Fig. 1 XRD profiles measured at room temperature in the specimens annealed at temperatures between 773 and 1173 K.
50
µ
m
(a)
(b)
(c)
(d)
50
µ
m
50
µ
m
50
µ
m
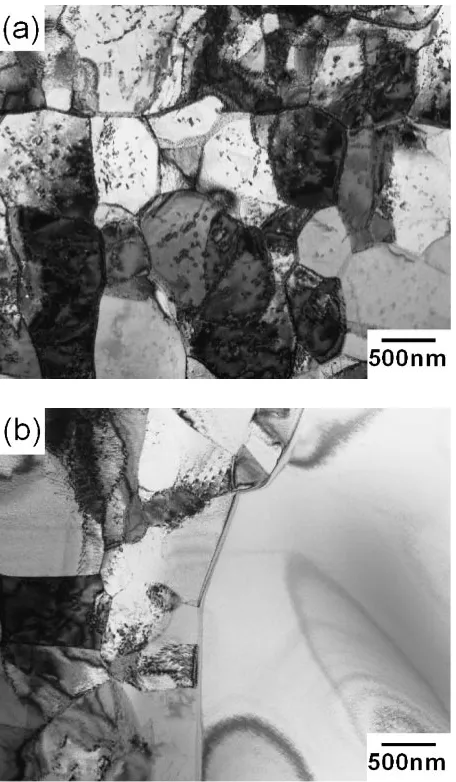
[image:2.595.56.282.70.266.2] [image:2.595.77.520.477.766.2]measurement. Figure 3 shows the bright field TEM micro-graphs of the specimens annealed at (a) 823 K and (b) 873 K. In the specimen annealed at 823 K, the subgrains with size of
about 1.5mm are observed and the secondary phase is also
observed. This secondary phase is identified to bephase as
shown in Fig. 4. On the other hand, a bimodal grain structure consisting of fine subgrains and large recrystallized grains is observed in the specimen annealed at 873 K as shown in Fig. 3(b). No secondary phase is observed in the specimen annealed at 873 K.
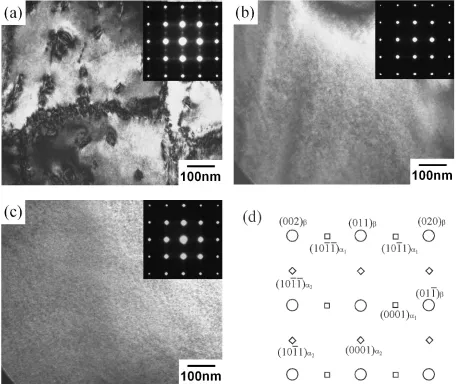
Figure 4 shows bright field images and the corresponding selected area diffraction patterns (SADP) in the specimens annealed at (a) 823 K, (b) 873 K and (c) 973 K. Figure 4(d) shows the key diagram corresponding to Fig. 4(a). The beam
directions are parallel to [100] of phase. As shown in
Fig. 4(a), the secondary phase with size of 30 nm can be seen
in the grains. In the SADP, diffuse spots at 1/2{110} and
1/2{013} can be seen in addition to primary reflections
fromphase. These spots can be identified to bephase in
Fig. 4(a). On the other hand, thephase can not be detected
[image:3.595.56.284.71.462.2]in the specimens annealed at 873 and 973 K as shown in Figs. 4(b) and (c). These results of TEM observation are well consistent with the XRD measurement.
Figure 5 shows dark field TEM micrographs and the corresponding SADP of the specimens annealed at (a) 823 K, (b) 873 K and (c) 973 K. All SADPs were obtained
from [110] zone axis. In all SADPs, diffuse scattering at
1/3{112} positions corresponding to the ! phase can be
seen in addition to the primary reflections frommatrix. The
spot indicated by a circle in each SADP was used to take the corresponding dark field micrograph. Dispersion of very fine
!particles with a dimension of 3 nm was observed in all dark
field micrographs. It is clear that the density and size of the!
phase do not depend on annealing temperature. The!phase
is athermal one formed during quenching, since the thermal!
phase is formed by aging below 698 K in Ti–Nb alloys.19)
The grain size was measured using SEM micrographs and it is plotted against the annealing temperature in Fig. 6. The grain size was measured by a linear intercept method. Based on the TEM observation, the subgrain size of the specimen
annealed at 823 K, about 1.5mm, was also plotted. The grain
size increases with increasing annealing temperature to
40mmat 1173 K.
3.2 Effect of annealing temperature on shape memory properties
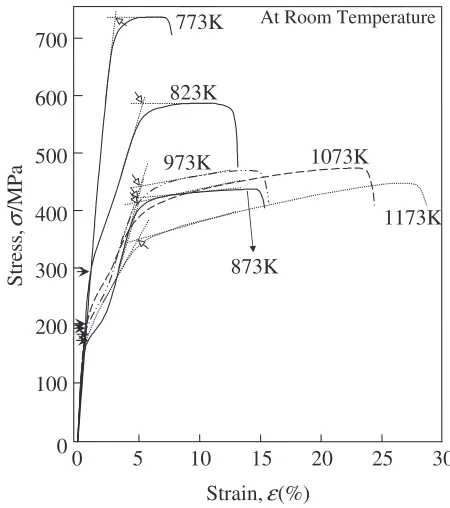
Figure 7 shows stress–strain curves of the specimens annealed at temperatures between 773 and 1173 K. The tensile tests were carried out at room temperature. The specimens annealed at temperatures between 823 and 1173 K exhibit a two-stage yielding. The first stage yielding indicated by a black-headed arrow corresponds to the deformation of the stress-induced martensitic transformation
because the Ms of these specimens is below room
temper-ature as shown in the XRD measurement, SEM and TEM observation. The second stage yielding indicated by a white-headed arrow corresponds to the starting point of plastic deformation. The specimens annealed at 773 K exhibits a single-stage yield. Therefore, this specimen starts plastic deformation prior to the stress induced martensitic trans-formation. The fracture stresses and fracture strains were evaluated using the stress–strain curves of all the specimens, and they are plotted against annealing temperature in Fig. 8. The fracture stress decreases from 720 to 420 MPa with increasing annealing temperature from 773 to 873 K, and then exhibits similar values in the specimens annealed at temperatures between 873 and 1173 K. On the other hand, the fracture strain increases with increasing annealing temper-ature from 7 to 29% due to the recovery and recrystallization. In order to determine the martensitic transformation temperature, tensile tests were carried out at various temper-atures. Figure 9 shows a series of stress–strain curves obtained at various temperatures for the specimens annealed at 873 K. All the specimens were deformed to a strain of 2.5% followed by unloading. All the specimens were heated up to 500 K (above the reverse martensitic transformation finish
temperature;Af) after unloading: lines with an arrow indicate
the shape recovery by heating. The yield point, indicated by a larger arrow, is determined at the intersection of the stress– strain curve and a line parallel to the initial elastic portion of the stress–strain curve but offset by 0.2% from the origin as shown in Fig. 9. The shape memory effect was mainly observed for the specimens deformed at temperatures Fig. 3 TEM bright field micrographs of the specimens annealed at (a)
between 173 and 233 K. The residual strain after unloading was recovered by heating. The superelastic behavior was mainly observed for the specimens deformed at temperatures between 253 and 313 K. However, the superelastic strain upon unloading decreases with increasing test temperature above 298 K. The yield stress for each curve was plotted as a function of test temperature in Fig. 10. The results of other specimens annealed at various temperatures were also plotted in this figure. The yield stress in all specimens decreases with increasing test temperature to the minimum, and increases with further increasing test temperature. In general, the temperature exhibiting the minimum yield stress is taken as
the martensitic transformation start temperature (Ms); e.g.,
Ms of the specimen annealed at 873 K is determined to be
233 K. As shown in this figure, theMsin all specimens were
determined to be between 213 and 233 K irrespective of annealing temperature. According to these experimental
results, it is confirmed that theMstemperature is less affected
by annealing temperature between 873 and 1173 K.
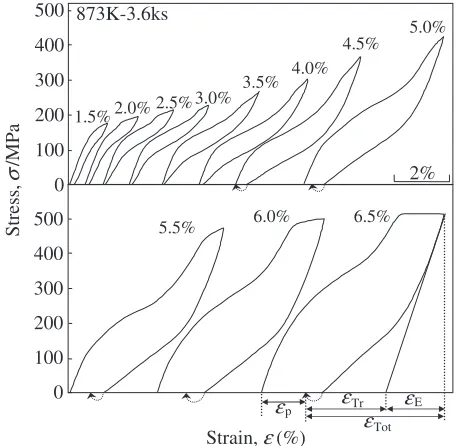
Figure 11 shows stress–strain curves of a specimen annealed at 873 K. Each stress–strain curve and recovery strain was obtained at room temperature by a loading and unloading cycle followed by heating: the strain recovery by
heating being indicated by a broken arrow. The similar measurement was repeated by increasing the maximum strain by 0.5% upon loading in the same specimen. In order to characterize the shape memory behavior of the specimen, four types of strains are defined as follows; (1) the
permanently remained strain"Pafter unloading followed by
subsequent heating, (2) the elastic strain "E recovered
elastically upon unloading, (3) the recovered strain"Tr due
to the reverse transformation,i.e., the summation of the strain
recovered superelastically upon unloading and strain
recov-ered by heating and (4) the total recovrecov-ered strain "Tot
consisting of "Tr and "E. Almost complete superelastic
behavior was observed in the first six curves, while the strain
recovery by heating aboveAf temperature in addition to the
superelastic strain recovery was observed after the 7th cycle. The plastic strain increases with increasing applied strain upon loading. Similar cyclic tensile tests were also carried out for other specimens.
The "E, "Tr and "Tot estimated in Fig. 11 were plotted
against the applied stress in Fig. 12. The"Pstarts to increase
from 422 MPa. The "Tr and "Tot increase to the maximum
with increasing stress and saturate with further increasing stress. Generally speaking, the shape memory behavior can Fig. 4 TEM bright field micrographs and the corresponding diffraction patterns in the specimens annealed at (a) 823 K, (b) 873 K and
[image:4.595.70.527.73.457.2]Fig. 5 TEM dark field images and the corresponding diffraction patterns in the specimens annealed at (a) 823 K, (b) 873 K and (c) 973 K, (d) being a key diagram of the diffraction pattern.
0 10 20 30 40
800 900 1000 1100 1200
Grain size,
d
/
µ
m
Annealing temperature, Th/K ( )
Fig. 6 Annealing temperature dependence of grain size in the specimens annealed at temperatures between 823 and 1173 K.
0
5
10
15
20
25
30
0
100
200
300
400
500
600
700
Strain,
ε
(%)
Stress,
σ
/MPa
773K
823K
873K
973K
1073K
1173K
At Room Temperature [image:5.595.87.509.73.430.2] [image:5.595.313.538.504.758.2] [image:5.595.56.281.534.757.2]be characterized by the critical stress (s) for slip, the
maximum total recovery strain ("max
Tot) and the maximum
recovery transformation strain ("max
Tr ). Thesindicated by a
white-headed arrow is defined in this study as the stress
where 0.5% plastic strain is induced, while the"max
Tot indicated
by a dashed arrow is the maximum total recovery strain and the"max
Tr indicated by a black-headed arrow is the maximum
recovery transformation strain as shown in Fig. 12. Thesis
estimated to be about 460 MPa, while the"max
Tot and"maxTr to be
4.9 and 2.8%, respectively. Thes,"maxTot and"
max
Tr of the specimens are plotted against
annealing temperature in Fig. 13. As shown in this figure, the "maxTot and "maxTr are almost constant irrespective of the annealing temperature. This indicates that the annealing temperature less affect the transformation strain. However,
thesdecreases with increasing annealing temperature from
560 MPa at 823 K to 315 MPa at 1173 K.
In order to apply Ti-based alloys to medical uses, the stability of superelasticity near body temperature is impor-tant. Cyclic tensile tests were carried out at room temper-ature. The specimens were elongated up to 2.5% strain followed by unloading at each cycle. The results for the specimens annealed at (a) 823 K, (b) 873 K and (c) 973 K are shown in Fig. 14. All the specimens show an excellent superelasticity. In particular the specimen annealed at 823 K exhibits superior superelastic behavior with a narrow stress hysteresis as shown in Fig. 14(a). Although the first curve exhibits incomplete superelastic recovery with a plastic strain
0 10 20 30 300 400 500 600 700 800
700 800 900 1000 1100 1200
Fracture strain, εf (%) Fracture stress, σf /MPa
Heat treatment temperature, Th/K
Strain Stress
Fig. 8 Effect of annealing temperature on fracture stress and fracture strain in the specimens annealed at temperatures between 773 and 1173 K.
0 100 200 300 0 100 200 300 0 100 200 300 233K
298K 313K 333K
273K 253K 213K 193K 173K 1% Stress, σ /MPa
Strain, ε(%)
Fig. 9 Stress–strain curves obtained at various temperatures in the speci-men annealed at 873 K.
0 100 200 300 400
150 200 250 300 350 400
Stress,
σ
/MPa
Temperature, T/K 873K
973K 1073K 1173K
[image:6.595.59.281.73.273.2]Ms
Fig. 10 Test temperature dependence of critical yield stress in the specimens annealed at temperatures between 773 and 1173 K.
εp
εTot εTr εE
2% 873K-3.6ks
1.5%
6.0%
2.0% 2.5%3.0%
3.5% 4.0% 4.5% 5.0% 5.5% 6.5% 200 500 300 0 400 100 200 500 300 0 400 100 Stress, σ /MPa
Strain, ε(%)
[image:6.595.313.540.74.288.2] [image:6.595.58.285.338.553.2] [image:6.595.313.541.349.572.2]of 0.2%, the curves after the 2nd cycle exhibit almost complete superelastic recovery. The yield stress indicated by an arrow decreases from 295 MPa at the first cycle to 270 MPa at the third cycle, then it becomes almost constant irrespective of increasing cyclic number. It is clear that this yield stress is higher than those of the specimens annealed at 873 and 973 K. This is caused by the increase in the stress for
inducing martensites due to the presence ofphase and fine
subgrain structure for the specimen annealed at 823 K as shown in Figs. 3 and 4.
3.3 Relation between microstructure and shape memo-ry properties
The change of microstructure with increasing annealing temperature for the Ti–22Nb–6Zr alloy is summarized as follows. (1) The specimens annealed above 873 K exhibited the fully recrystallized structure while the specimen annealed at 823 K exhibited the fine subgrain structure. The grain size increased with increasing annealing temperature. (2) The
texture changed from thef100gh110ideformation texture to
the f112gh110i recrystallization texture with increasing
annealing temperature. It is noted that the rolling direction
is parallel toh110icrystal directions in both textures. Thus, it
is supposed that the effect of the texture change on mechanical properties is small in this study because the tensile direction is parallel to the rolling direction in all
specimens. (3) The precipitates were observed in the
specimens annealed at 773 and 823 K while they were dissolved in the specimens annealed above 823 K. As shown
in Fig. 5, the fine athermal!phase formed by quenching was
observed in all specimens, indicating that the athermal !
phase is not related to the change of shape memory properties.
As mentioned above, the critical stress for slip (s)
decreased with increasing annealing temperature. The
speci-men annealed at 823 K exhibited very high s of 560 MPa,
due to the precipitates and fine subgrain structure. The
drastic decrease inswith increasing annealing temperature
from 823 to 873 K is due to the recrystallization and
dissolution of precipitates. On the other hand, it is
supposed that the decrease insbetween 873 K and 1173 is
0 1 2 3 4 5 6
100 200 300 400 500 600
Stress,
σ
/MPaStrain,
ε
(%)
ε
pε
Trε
Totε
Totmaxε
Trmaxσ
s [image:7.595.316.540.71.363.2]873K-3.6ks
Fig. 12 Plastic strain ("P), total recovery strain ("Tot) and transformation
recovery strain ("Tr) plotted against tensile stress in the specimen annealed
at 873 K.
2 3 4 5 6
300 350 400 450 500 550 600
700 800 900 1000 1100 1200
Stress,
σ
/MPa
Strain,
ε
(%)
Heat treatment temperature, Th/K
ε
Tot maxε
Trmaxσ
SFig. 13 Annealing temperature dependence of critical stress for slip (S),
maximum total recovery strain ("max
Tot) and maximum recovery
trans-formation strain ("max
Tr ) in the specimens annealed at temperatures between
823 and 1173 K.
Strain,
ε
(%)
Stress,
σ
/MPa
0
100
200
0
100
200
1%
(a) 823K
0
100
200
300
400
(b) 873K
(c) 973K
1%
1%
1st
2nd 3rd 5th 7th 10th
1st 2nd 3rd 5th 7th 10th
[image:7.595.58.285.73.301.2]1st 2nd 3rd 5th 7th 10th
[image:7.595.58.280.376.591.2]originated from the increase in grain size. Generally
speak-ing, the Hall–Petch relationship,20,21) has been applied to
polycrystalline aggregates to explain the relationship
be-tween yield stressyand grain sized.
y¼0þkyd1=2 ð1Þ
where0 is a lattice friction stress andkyis the slope of the
Hall–Petch relationship. The Hall–Petch slopekydepends on
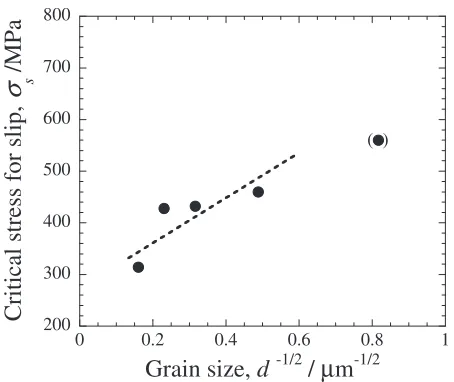
the resistance of grain boundaries to dislocation motion across the boundaries. It is expected that this relationship can be also applied to the relationship between the critical stress for slip and grain size in shape memory alloys. The critical
stress for slip (s) is plotted against grain size (d1=2) in
Fig. 15. The grain size of the closed circle in parentheses is an average diameter of subgrains estimated in TEM micro-graphs. It is seen that the Hall–Petch relationship qualita-tively holds between the critical stress for slip and grain size. The Hall–Petch slop in this study is estimated at about
0.4 MN/m3=2. Further research is required to determine the
0andkyprecisely. It has been reported in literature that the
value ofkyis 0.25 MN/m3=2in a-Ti22)and 0.37 MN/m3=2in
a Ti–15.2 at%Mo alloy,23)respectively, suggesting that the
value of 0.4 MN/m3=2 in the Ti–22Nb–Zr alloy is
consid-erably reasonable. Up to date, the quantitative researches on the effect of grain size on shape memory properties have hardly been reported. This present study revealed that grain refinement is a very effective method in order to improve the
shape memory and mechanical properties in-type Ti-based
alloys.
4. Summary
The specimen annealed at 823 K for 3.6 ks exhibited a fine subgrain structure. A bimodal grain structure with a fine subgrain and recrystallized grain was observed in the specimen annealed at 873 K for 3.6 ks, while a fully
recrystallized structure was observed in the specimens annealed above 873 K. The grain size increased with increasing annealing temperature. The annealing temperature slightly affected the transformation temperature and recovery strain. However, the critical stress for slip decreased consid-erably with increasing annealing temperature, because the grain size increased with increasing annealing temperature. The specimen annealed at 823 K exhibited excellent
super-elasticity due to fine subgrains andprecipitates. The Hall–
Pecth relationship holds between the critical stress for slip and grain size in the Ti–22Nb–6Zr(at%).
Acknowledgments
This work was partially supported by the ILC Project from University of Tsukuba the 21 Century Center of Excellence Program and the Grants-in-Aid for Fundamental Scientific Research Kiban A (1999–2001), Kiban A (2002–2004) from the Ministry of Education, Culture, Sports, Science and Technology, Japan.
REFERENCES
1) S. Shabalovskaya: Proc. First Inter. Conf. Shape Memory and Superelastic Technologies, 1994, 209.
2) T. W. Duerig, J. Albrecht, D. Richter and P. Fischer: Acta. Metall.30 (1982) 2161–2172.
3) W. F. Ho, C. P. Ju and J. H. Chern Lin: Biomaterials20(1999) 2115– 2122.
4) T. Grosdidier and M. J. Philippe: Mater. Sci. Eng. A291(2000) 218– 223.
5) H. Hosoda, N. Hosoda and S. Miyazaki: Trans. MRS-J26(2001) 243– 246.
6) H. Y. Kim, Y. Ohmatsu, J. I. Kim, H. Hosoda and S. Miyazaki: Mater. Trans.45(2004) 1090–1095.
7) T. Maeshima and M. Nishida: Mater. Trans.45(2004) 1096–1100. 8) T. Maeshima and M. Nishida: Mater. Trans.45(2004) 1101–1105. 9) C. Baker: Mater Sci. J.5(1971) 92–100.
10) H. Y. Kim, S. Hashimoto, J. I. Kim, H. Hosoda and S. Miyazaki: Mater. Trans.45(2004) 2443–2448.
11) K. Nitta, S. Watanabe, N. Masahashi, H. Hosoda and S. Hanada: Structural Biomaterials for the 21st Century, (TMS, 2001) 25–34. 12) H. Hosoda, Y. Fukui, T. Inamura, K. Wakashima, S. Miyazaki and
K. Inoue: Mater. Sci. Furum425–432(2003) 3121–3124.
13) T. Inamura, Y. Fukui, H. Hosoda, K. Wakashima and S. Miyazaki: Mater. Sci. Eng. C25(2005) 426–432.
14) J. I. Kim, H. Y. Kim, H. Hosoda and S. Miyazaki: Mater. Trans.46 (2005) 852–857.
15) J. I. Kim, H. Y. Kim, T. Inamura, H. Hosoda and S. Miyazaki: Mater. Sci. Eng. A.403(2005) 334–339.
16) S. G. Steinemann:Evalution of Biomaterials, Ed. By G. D. Winter, J. L. Leray and K. de Goot, (John Wiley & Sons, Ltd., 1980) 1–34. 17) H. Y. Kim, T. Sasaki, K. Okutsu, J. I. Kim, T. Inamura, H. Hosoda and
S. Miyazaki: Acta Mater.54(2006) 423–433.
18) T. Inamura, Y. Fukui, H. Hosoda, K. Wakashima and S. Miyazaki: Mater. Trans.45(2004) 1083–1089.
19) D. L. Moffat and D. C. Larbalestier: Metall. Trans. A19A(1988) 1687–1694.
20) E. O. Hall: Pro. Phys. Soc. Lond.B64(1951) 747–753. 21) N. J. Petch: J. Iron Steel Inst.174(1953) 25.
22) H. Conrad: Prog. Mater. Sci.26(1981) 123–403.
23) K. H. Chia, K. Jung and H. Conrad: Mater. Sci. Eng.409(2005) 32–38. 200
300 400 500 600 700 800
0 0.2 0.4 0.6 0.8 1
Critical stress for slip,
σ
s/MPa
Grain size,
d
-1/2/
µ
m
-1/2 [image:8.595.57.284.71.262.2]( )
Fig. 15 Critical stress for slip (S) as a function of grain size (d1=2) in the