©IJRASET: All Rights are Reserved
15
Soil Structure Interaction Effects on Seismic
Performance of Multi-Story RC Buildings with and
without Shear Wall
Mistry Hemal A.1, Patel Nirav S.2
1
P.G. Student, 2Asst. Professor, Sardar Patel College of Engineering, Anand
Abstract: Through the structures are supported on soil, most of the designers do not consider the soil structure interaction and its subsequent effect on structure during an earthquake. Recent studies show that the effects of Soil Structure Interaction (SSI) may be detrimental to the seismic response of structure and neglecting SSI in analysis may lead to un-conservative design. Despite this, the conventional design procedure usually involves assumption of fixity at the base of foundation neglecting the flexibility of the foundation, the compressibility of soil mass and consequently the effect of foundation settlement on further redistribution of bending moment and shear force demands. The effects of SSI are analyzed for typical multi-story building resting on raft foundation. Two methods of analysis are used for seismic demands evaluation of the special moment resistant frame buildings: equivalent static load (ESL) and response spectrum (RS) methods using ETABS ultimate 2016 software as per IS 1893:2002 “Criteria for Earthquake Resistant Design of Structures”. Numerical results obtained using soil structure interaction model conditions are compared to those corresponding to fixed-base support conditions. The peak responses of natural time period, roof displacement, story drift and base shear are analyzed.
Keywords: Base shear, Fixed base, Flexible base, Soil stiffness, Story drift
I. INTRODUCTION
The rapid development of urban population and the pressure on limited space significantly influence the residential development of the city. The price of the land is high, the desire to avoid uneven and uncontrolled developing of urban area and bear on the land for needs of important agricultural production activity have all led to route residential building upwards. The local topographical restrictions in the urban area only possible solutions for construction of multi-story buildings to full fill the residential needs. The multi-story buildings all initially a reaction to the demand by activity of business close to each other and in city center, the less availability of land in the area. The multi-story buildings are frequently developed in the center of the city is prestige symbols for commercial organizations.
1) Raft Foundation: A mat or raft foundation is a large slab supporting a number of columns and walls under the entire structure or a large part of the structure. A mat is required when the allowable soil pressure is low or where the columns and walls are so close that individual footings would overlap or nearly touch each other. Mat foundations are useful in reducing the differential settlements on non-homogeneous soils or where there is a large variation in the loads on individual columns.
2) Soil-Structure Interaction: As waves from an earthquake reach a structure, they produce motions in the structure. These motions depend on the structure’s vibrational characteristics and the layout of structure. For the structure to react to the motion, it needs to overcome its own inertia force, which results in an interaction between the structure and the soil. The extent to which the structural response changes the characteristics of earthquake motions observed at the foundation level depends on the relative mass and stiffness properties of the soil and the structure. Thus the physical property of the foundation medium is an important factor in the earthquake response of structures supported on it.
The process in which the response of the soil influences the motion of the structure and the motion of the structure influences the response of the soil is termed as soil-structure interaction.
©IJRASET: All Rights are Reserved
16
II. REVIEW OF LITERATURE
1) Chinmayi H.K. and Jayeleks B.R. (2013)[1] on Soil-Structure interaction effects on seismic response of a 16 storey RC framed building with shear wall. In this paper, the study makes an effort to assess the effect of soil-structure interaction on lateral natural period and lateral deflection of a 16 story shear wall building with raft foundation. They concluded that the fundamental periods of buildings with SSI effect are more than the corresponding values of the same building with fixed-base and also although conventional design procedure omitting SSI is conservative it is required to ensure the structural safety of buildings resting over soft soil due to lateral deflection.
2) Mengke Li, Xiao Lu, Xinzheng Lu, Lieping Ye (2014)[2]on Influence of soil structure interaction on seismic collapse resistance of super-tall buildings. In this paper, taking the Shanghai Tower with a total height of 632 m as the research object, the substructure approach is used to evaluate the influence of the SSI on the seismic collapse resistance of the Shanghai Tower. The refined FE model of the superstructure of the Shanghai Tower and the simplified analytical model of the foundation and adjacent soil are established. They concluded that the SSI effect improves the collapse resistance capacity of the Shanghai Tower and also the SSI effect has some impact on the failure sequences of the Shanghai Tower subjected to extremely strong earthquakes but a negligible impact on the final failure modes.
3) H. Matinmahesh and M. Saleh Asheghabadi (2011)[3] on Seismic Analysis on Soil-Structure Interaction of Buildings over sandy Soil. In this paper, an idealized two dimensional plane strain finite element seismic soil-structure interaction analysis using Abaqus V.6.8 program. These analyses, influence of different sub soils (dense and loose sand), buildings height, in addition to the frequency content of the earthquake have been investigated on amplification. They concluded that, all soil types amplify bedrock motions in the soil-structure interface but with different degrees. Soil-structure models including dense sand has shorter period in comparison with loose sand and high rise buildings have longer period in comparison with low-rise buildings. The combination of these two can assess the amount of amplification of each earthquake.
4) A. Massumi and H.R. Tabatabaiefar (2008)[4] on A Criterion for considering soil-structure interaction effects in seismic design of ductile RC-MRFs according to Iranian codes. In this paper, the analysis carried out for four types of structures consisting of 3, 5, 7 and 10 story buildings, which represent the typical buildings in a high risk earthquake prone zone, have been selected in conjunction with three types of soil. The following conclusions may be drawn from the analytical investigation: It is not necessary to consider the effect of soil-structure interaction for seismic design of RC-MRF buildings founded on soil type II. It is essential to consider the effect of soil-structure interactions for seismic design of RC-MRF buildings higher than 7 stories founded on soil type III.
5) B.R. Jayalekshmi and H.K. Chinmayi (2016)[5]on Effects of soil stiffness on seismic response of reinforced concrete buildings with shear walls. In this paper the multi-storey buildings up to 16 storey are considered to determine the effect of soil–structure interaction. The integrated structure-foundation-soil system was analyzed by finite element software LS DYNA based on direct method of SSI assuming linear elastic behaviour of soil and structure. They concluded that Fundamental natural period of buildings incorporating the SSI effect is more than that of the same building with fixed-base and at least 23.6% increase occurs if the underlying soil is soft.
III. OBJECTIVE & SCOPE OF WORK
To analyze multi-story RC building with and without shear wall with consideration of soil raft foundation and soil structure interaction under the effect of seismic loading. Various parameters for research are listed below: Base Shear, Roof Displacement, Time Period & Story Drift.
Scope of work
1) To prepare Flexible base condition raft foundation model as thick slab and SSI incorporate by using soil springs taking into consideration.
2) To prepare models of multi-storey RC building (G+19) with fixed base and flexible base conditions and carry out seismic analysis. For seismic analysis two method are use:
a) Linear Equivalent Static load method
b) Linear Response Spectrum method
3) To study the various parameters of multi-storey RC building with and without shear wall having raft foundation for seismic loading.
©IJRASET: All Rights are Reserved
17
IV. PROBLEM STATEMENT
For the present study, twenty storied reinforced concrete 2BHK building is modelled. The base story height is 3.5 m and after that all stories having constant height 3 m in the model. To study the impact of soil flexibility, continuum model is utilized.
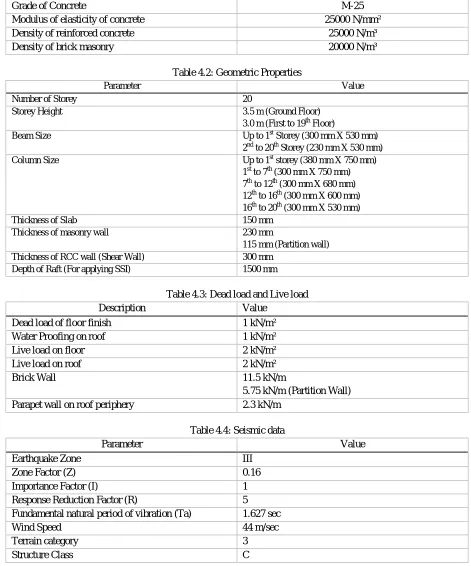
Table 4.1: Material Properties
Property Value
Grade of Concrete M-25
Modulus of elasticity of concrete 25000 N/mm²
Density of reinforced concrete 25000 N/m³
[image:3.612.69.540.156.722.2]Density of brick masonry 20000 N/m³
Table 4.2: Geometric Properties
Parameter Value
Number of Storey 20
Storey Height 3.5 m (Ground Floor) 3.0 m (First to 19th Floor)
Beam Size Up to 1st Storey (300 mm X 530 mm) 2nd to 20th Storey (230 mm X 530 mm) Column Size Up to 1st storey (380 mm X 750 mm)
1st to 7th (300 mm X 750 mm) 7th to 12th (300 mm X 680 mm) 12th to 16th (300 mm X 600 mm) 16th to 20th (300 mm X 530 mm)
Thickness of Slab 150 mm
Thickness of masonry wall 230 mm
115 mm (Partition wall) Thickness of RCC wall (Shear Wall) 300 mm
Depth of Raft (For applying SSI) 1500 mm
Table 4.3: Dead load and Live load
Description Value
Dead load of floor finish 1 kN/m²
Water Proofing on roof 1 kN/m²
Live load on floor 2 kN/m²
Live load on roof 2 kN/m²
Brick Wall 11.5 kN/m
5.75 kN/m (Partition Wall)
Parapet wall on roof periphery 2.3 kN/m
Table 4.4: Seismic data
Parameter Value
Earthquake Zone III
Zone Factor (Z) 0.16
Importance Factor (I) 1
Response Reduction Factor (R) 5
Fundamental natural period of vibration (Ta) 1.627 sec
Wind Speed 44 m/sec
Terrain category 3
©IJRASET: All Rights are Reserved
18
A. Stiffness Of Soil Area Spring
Stiffness of soil (modulus of subgrade reaction),
=safe settlement pressure (q)
settlement of raft (s)
Find out safe settlement pressure for 25mm settlement use Bowel’s equation [13],
= 12.2 . / ……….. B > 1.2 m
Where,
B = Smaller dimensions of raft (m) D = depth of raft foundation
Rw2 = 1 (Water table located at a depth equal to or greater than the width of footing below the base of the footing)
= 1 +0.33 ≤1.33
[image:4.612.52.529.333.722.2]N = Standard Penetration Test value (Taken from IS: 2950 (Part I) – 1981) [11]
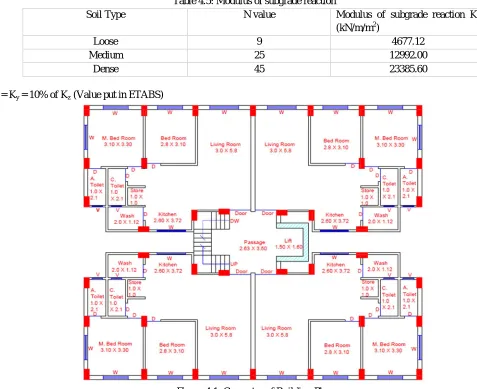
Table 4.5: Modulus of subgrade reaction
Soil Type N value Modulus of subgrade reaction Kz
(kN/m/m2)
Loose 9 4677.12
Medium 25 12992.00
Dense 45 23385.60
Kx = Ky = 10% of Kz (Value put in ETABS)
©IJRASET: All Rights are Reserved
19
V. MODELLING OF BUILDING IN ETABS
A. Models of Building
1) Model 1. RCC Bare Frame Structure.
a) Fixed Base Rigid Foundation (NSSI) – I
b) Fixed Base Rigid Foundation (NSSI) – II
c) Fixed Base Rigid Foundation (NSSI) – III
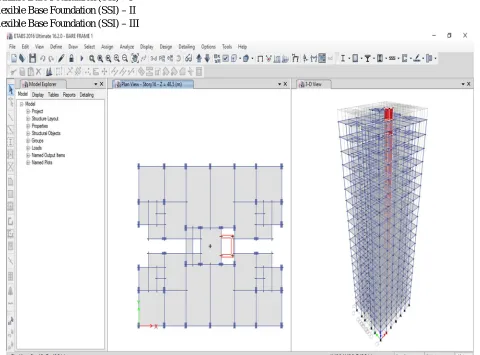
d) Flexible Base Foundation (SSI) – I
e) Flexible Base Foundation (SSI) – II
f) Flexible Base Foundation (SSI) – III
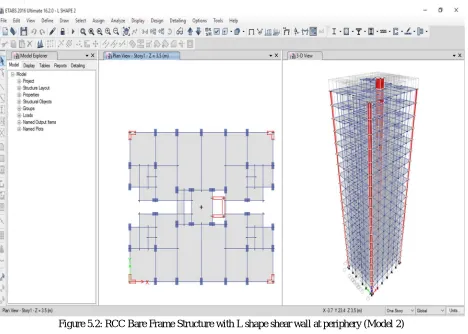
2) Model 2. RCC Bare Frame Structure with L shape shear wall at periphery.
a) Fixed Base Rigid Foundation (NSSI) – I
b) Fixed Base Rigid Foundation (NSSI) – II
c) Fixed Base Rigid Foundation (NSSI) – III
d) Flexible Base Foundation (SSI) – I
e) Flexible Base Foundation (SSI) – II
f) Flexible Base Foundation (SSI) – III
3) Model 3. RCC Bare Frame Structure C shape shear wall at core.
a) Fixed Base Rigid Foundation (NSSI) – I
b) Fixed Base Rigid Foundation (NSSI) – II
c) Fixed Base Rigid Foundation (NSSI) – III
d) Flexible Base Foundation (SSI) – I
e) Flexible Base Foundation (SSI) – II
[image:5.612.66.546.349.704.2]f) Flexible Base Foundation (SSI) – III
©IJRASET: All Rights are Reserved
20
Figure 5.2: RCC Bare Frame Structure with L shape shear wall at periphery (Model 2) [image:6.612.75.543.70.404.2]©IJRASET: All Rights are Reserved
21
VI. RESULT AND DISCUSSION
After completing modelling and analysis (Model 1, 2 & 3) work, now it is a time to discuss about the result. Here, results are obtained for two different analysis procedures i.e. Linear Static Seismic Co-Efficient Analysis and Linear Dynamic Response Spectrum Analysis. This is a comparative study, so parameters like displacement, base shear, story drift & time period are compared for Bare Frame Structure with fixed base and flexible base with L shape shear wall & C shape shear wall for zone III as per Indian Standard Code for Linear Static Seismic Co-Efficient Analysis and Linear Dynamic Response Spectrum Analysis.
[image:7.612.89.527.410.696.2]A. Natural Time Period
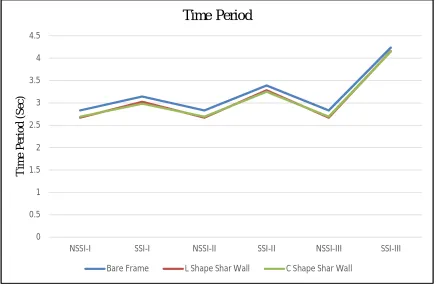
Table 6.1 shows the time period of Bare Frame (Model 1), L Shape Shear wall (Model 2) at periphery of the building and C Shape Shear wall (Model 3) at core of the building.
Table 6.1: Time Period Time Period (sec)
Model 1 Model 2 Model 3
NSSI-I 2.83 2.672 2.694
SSI – I 3.143 3.022 2.981
NSSI – II 2.83 2.672 2.694
SSI – II 3.389 3.28 3.248
NSSI – III 2.83 2.672 2.694
SSI - III 4.239 4.155 4.149
1) The value of Time Period for model 2 is 5.58% less compared to model 1 for fixed base condition and 3.84% less for SSI – I, 3.21% less for SSI – II & 1.98% less for SSI – III for flexible base condition.
2) The value of Time Period for model 3 is 4.80% less compared to model 1 for fixed base condition and 5.15% less for SSI – I, 4.16% less for SSI – II & 2.12% less for SSI – III for flexible base condition.
Figure 6.1: Comparison of Time Period for Model 1, 2 & 3
3) The value of natural time period in dynamic analysis is same as the value of time period obtained in static analysis. 0
0.5 1 1.5 2 2.5 3 3.5 4 4.5
NSSI-I SSI-I NSSI-II SSI-II NSSI-III SSI-III
T
im
e
P
er
io
d
(
S
ec
)
Time Period
©IJRASET: All Rights are Reserved
22
B. Base Shear
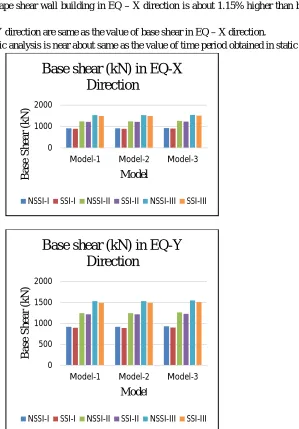
[image:8.612.194.493.290.719.2]Base shear developed in model 1, model 2 & model 3 for earthquake load applied in X and Y direction is shown in table 6.2.
Table 6.2: Base Shear Base Shear (kN)
EQ – X Direction EQ – Y Direction
Model 1 Model 2 Model 3 Model 1 Model 2 Model 3
NSSI-I 918.45 917.46 929.03 918.45 917.46 929.03
SSI – I 895.05 894.05 905.63 895.05 894.05 905.63
NSSI – II 1249.09 1247.74 1263.48 1249.09 1247.74 1263.48
SSI – II 1217.26 1215.91 1231.65 1217.26 1215.91 1231.65
NSSI – III 1533.81 1532.16 1551.48 1533.81 1532.16 1551.48
SSI - III 1494.73 1493.07 1512.40 1494.73 1493.07 1512.40
1) The value of base shear for bare frame structure and L shape shear wall building in EQ – X direction are near about same because it is depending on the self-weight or lumped mass of structure.
a) The value of base shear for C shape shear wall building in EQ – X direction is about 1.15% higher than bare frame structure and L shape shear wall building.
b) The value of base shear in EQ – Y direction are same as the value of base shear in EQ – X direction.
c) The value of base shear in dynamic analysis is near about same as the value of time period obtained in static analysis.
Figure 6.2: Comparison of Base Shear in EQ – X & EQ - Y Direction for Model 1, 2 & 3
0 1000 2000
Model-1 Model-2 Model-3
B
a
se
S
h
ea
r
(k
N
)
Model
Base shear (kN) in EQ-X
Direction
NSSI-I SSI-I NSSI-II SSI-II NSSI-III SSI-III
0 500 1000 1500 2000
Model-1 Model-2 Model-3
B
a
se
S
h
ea
r
(k
N
)
Model
Base shear (kN) in EQ-Y
Direction
©IJRASET: All Rights are Reserved
23
C. Roof Displacement
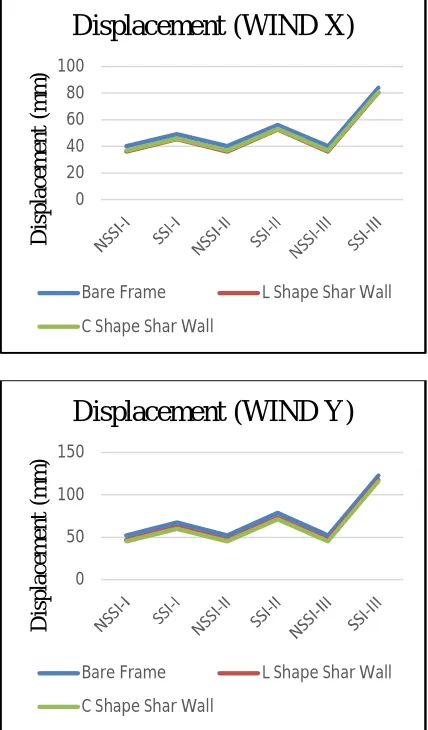
[image:9.612.199.413.347.712.2]The value of roof displacement developed in model 1, model 2 and model 3 for wind load applied in X & Y direction is shown in table 6.3.
Table 6.3: Roof Displacement Roof Displacement (mm)
Wind – X Direction Wind – Y Direction
Model 1 Model 2 Model 3 Model 1 Model 2 Model 3
NSSI-I 40.004 36.279 36.829 51.916 46.669 45.239
SSI – I 49.125 45.643 46.007 67.205 62.002 60.066
NSSI – II 40.004 36.279 36.829 51.916 46.669 45.239
SSI – II 56.122 52.648 53.014 78.472 73.162 71.191
NSSI – III 40.004 36.279 36.829 51.916 46.669 45.239
SSI - III 84.069 80.6 80.97 123.054 117.753 115.741
1) The value of roof displacement for model 2 is 9.31% less compared to model 1 for fixed base condition and 7.1% less for SSI – I, 6.2% less for SSI – II & 4.1% less for SSI – III for flexible base condition in wind – X direction.
a) The value of roof displacement for model 3 is 7.94% less compared to model 1 for fixed base condition and 6.35% less for SSI – I, 5.54% less for SSI – II & 3.69% less for SSI – III for flexible base condition in wind – X direction.
b) The value of roof displacement for model 2 is 10.10% less compared to model 1 for fixed base condition and 7.74% less for SSI – I, 6.67% less for SSI – II & 4.30% less for SSI – III for flexible base condition in wind – Y direction.
Figure 6.3: Comparison of Roof Displacement in Wind – X & Wind - Y for Model 1, 2 & 3 0
20 40 60 80 100
D
is
pl
a
ce
m
en
t
(m
m
)
Displacement (WIND X)
Bare Frame L Shape Shar Wall
C Shape Shar Wall
0 50 100 150
D
is
pl
a
ce
m
en
t
(m
m
)
Displacement (WIND Y)
Bare Frame L Shape Shar Wall
©IJRASET: All Rights are Reserved
24
c) The value of roof displacement for model 3 is 12.86% less compared to model 1 for fixed base condition and 10.62% less for SSI – I, 9.28% less for SSI – II & 5.94% less for SSI – III for flexible base condition in wind – Y direction.
d) The value of roof displacement in dynamic analysis is near about same as the value of time period obtained in static analysis.
D. Story drift
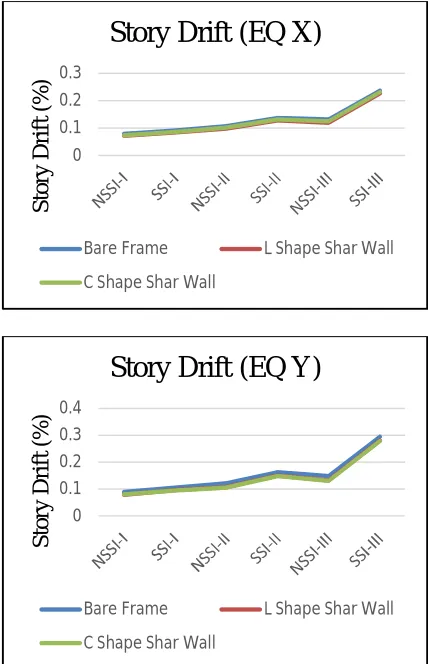
[image:10.612.198.412.382.714.2]The value of maximum story drift developed in model 1, model 2 and model 3 for earthquake load applied in X & Y direction is shown in table 6.4 & 6.5 for static & dynamic analysis respectively.
Table 6.4: Story Drift (Static Analysis) Story Drift (%)
EQ – X Direction EQ – Y Direction
Model 1 Model 2 Model 3 Model 1 Model 2 Model 3
NSSI-I 0.0793 0.0719 0.0745 0.0892 0.0794 0.0779
SSI – I 0.0907 0.0838 0.0863 0.1058 0.0967 0.095
NSSI – II 0.1079 0.0978 0.1013 0.1214 0.108 0.106
SSI – II 0.1373 0.128 0.1317 0.1632 0.1508 0.1488
NSSI – III 0.1325 0.1201 0.1244 0.149 0.1326 0.1301
SSI - III 0.2374 0.2259 0.2318 0.295 0.2797 0.279
1) The value of maximum story drift for model 2 is 9.36% less compared to model 1 for fixed base condition and 7.61% less for SSI – I, 6.77% less for SSI – II & 4.84% less for SSI – III for flexible base condition in EQ – X direction.
2) The value of maximum story drift for model 3 is 6.09% less compared to model 1 for fixed base condition and 4.85% less for SSI – I, 4.08% less for SSI – II & 2.35% less for SSI – III for flexible base condition in EQ – X direction.
Figure 6.4: Comparison of Story Drift in EQ – X & EQ - Y for Model 1, 2 & 3 0
0.1 0.2 0.3
S
to
ry
D
ri
ft
(
%
)
Story Drift (EQ X)
Bare Frame L Shape Shar Wall
C Shape Shar Wall
0 0.1 0.2 0.3 0.4
S
to
ry
D
ri
ft
(
%
)
Story Drift (EQ Y)
Bare Frame L Shape Shar Wall
©IJRASET: All Rights are Reserved
25
3) The value of maximum story drift for model 2 is 11.0% less compared to model 1 for fixed base condition and 8.6% less for SSI – I, 7.6% less for SSI – II & 5.2% less for SSI – III for flexible base condition in EQ – Y direction.
[image:11.612.198.413.357.670.2]4) The value of maximum story drift for model 3 is 12.68% less compared to model 1 for fixed base condition and 10.20% less for SSI – I, 8.82% less for SSI – II & 5.42% less for SSI – III for flexible base condition in EQ – Y direction.
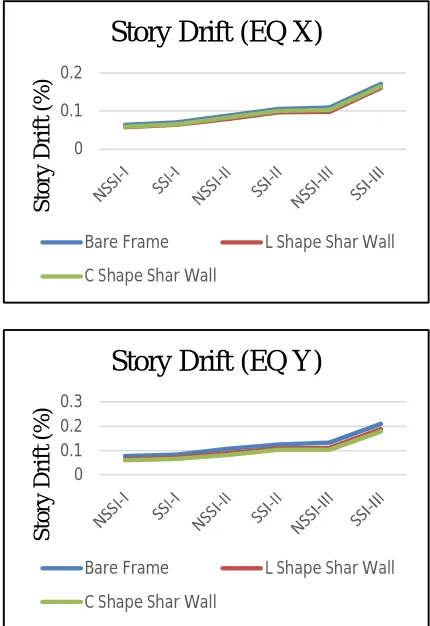
Table 6.5: Story Drift (Dynamic Analysis)
Story Drift (%)
EQ – X Direction EQ – Y Direction
Model 1 Model 2 Model 3 Model 1 Model 2 Model 3 NSSI-I 0.0638 0.0574 0.0593 0.0769 0.0641 0.0589 SSI – I 0.0698 0.0638 0.0657 0.0831 0.0716 0.0659 NSSI – II 0.0877 0.0789 0.0822 0.1067 0.0891 0.0823 SSI – II 0.1052 0.097 0.1001 0.1254 0.1099 0.1022 NSSI – III 0.109 0.0979 0.1023 0.1323 0.1106 0.1031
SSI - III 0.171 0.1603 0.1649 0.21 0.1876 0.1788
5) The value of maximum story drift for model 2 is 10.03% less compared to model 1 for fixed base condition and 8.6% less for SSI – I, 7.79% less for SSI – II & 6.26% less for SSI – III for flexible base condition in EQ – X direction.
6) The value of maximum story drift for model 3 is 6.27% less compared to model 1 for fixed base condition and 5.87% less for SSI – I, 4.85% less for SSI – II & 3.57% less for SSI – III for flexible base condition in EQ – X direction.
7) The value of maximum story drift for model 2 is 16.54% less compared to model 1 for fixed base condition and 13.84% less for SSI – I, 12.36% less for SSI – II & 10.67% less for SSI – III for flexible base condition in EQ – Y direction.
Figure 6.5: Comparison of Story Drift in EQ – X & EQ – Y for Model 1, 2 & 3
8) The value of maximum story drift for model 3 is 23.1% less compared to model 1 for fixed base condition and 20.7% less for SSI – I, 18.5% less for SSI – II & 14.85% less for SSI – III for flexible base condition in EQ – Y direction.
0 0.1 0.2
S
to
ry
D
ri
ft
(
%
)
Story Drift (EQ X)
Bare Frame L Shape Shar Wall
C Shape Shar Wall
0 0.1 0.2 0.3
S
to
ry
D
ri
ft
(
%
)
Story Drift (EQ Y)
Bare Frame L Shape Shar Wall
©IJRASET: All Rights are Reserved
26
VII. CONCLUSION
Present study makes an effort to assess the effect of soil structure interaction on natural time period, base shear, roof displacement & story drift of a 20 story building with and without shear wall under consideration of raft foundation.
A. The natural periods of buildings with SSI effect are more than the corresponding values of the same building with fixed-base.
B. The natural time period in case of building with fixed base on loose soil in first mode is 2.83 sec and increases to 4.239 sec in case of flexible base on loose soil which is an increase of 33.24%. But when shear wall is use, the time period decreases up to 4.155 sec for model 2 and 4.149 sec for model 3 in case of flexible base on loose soil.
C. The value of base shear which reflects the seismic lateral vulnerability of structure is lower with consideration of soil flexibility than the conventional method.
D. For both types of analysis, the value of base shear near about same because it is depending on the self-weight or lumped mass of structure.
1) For both types of analysis, it is observed that the percentage of displacement in wind X and wind Y direction are increased with increased in soil flexibility. Also percentage of story drift in EQ X and EQ Y direction are increased with increased in soil flexibility.
2) The displacement of buildings with flexible base condition have shown a considerable increase that ranged from 18.57% to about 52.42% compared to the fixed base condition for buildings found between soil type I and soil type III.
3) The buildings with C shape shear wall placed at core show the highest percentage reduction in natural time period, roof displacement & story drift compare to bare frame and L shape shear wall at periphery of the building.
It is concluded that providing shear walls at core gives a better seismic performance if the structures are founded on soft soil in moderate seismic intensity regions.
VIII. SCOPE FOR FUTURE WORK
A. The analysis can be carried out with Three Dimensional modelling of soil.
B. Study may further be extended for different seismic zones.
REFERENCES
[1] Chinmayi H.K. and Jayalekshmi B.R. (2013) “Soil-Structure interaction effects on seismic response of a 16 storey RC framed building with shear wall” American Journal of Engineering Research, Vol. 2, pp. 53-58.
[2] Mengke Li, Xiao Lu, Xinzheng Lu, Lieping Ye (2014) “Influence of soil-structure interaction on seismic collapse resistance of super-tall buildings” Journal of Rock Mechanics and Geotechnical Engineering, pp. 477-485.
[3] H. Matinmahesh and M. Saleh Asheghabadi (2011) “Seismic Analysis on Soil-Structure Interaction of Buildings over sandy Soil” ELSEVIER, pp. 1737-1743. [4] A. Massumi and H.R. Tabatabaiefar (2008) “A Criterion for considering soil-structure interaction effects in seismic design of ductile RC-MRFs according to
Iranian codes” The 14th World Conference on Earthquake Engineering, October 12-17, Beijing, China.
[5] B. R. Jayalekshmi and H. K. Chinmayi (2016) “Effects of soil stiffness on seismic response of reinforced concrete buildings with shear walls” Springer [6] Mahadev Prasad N, Manogna H N, Dharmesh N and Madhu Sudhana Y B, (2015) “Seismic Response of RC Bare Frame and Shear Wall Frames With and
Without Considering Soil Structure Interaction in Buildings” International Journal for Research in Applied Science & Engineering Technology, Vol. 3, Special Issue 11, pp. 72-88.
[7] IS: 456-2000 - Code of Practice for Plain and Reinforced Concrete, Bureau of Indian Standards, New Delhi [8] IS: 1893 (Part 1) – 2002 - Criteria for Earthquake Resistant Design of Structures.
[9] IS: 875 (Part 3) – 1987 - Code of Practice for Design Loads (other than earthquake) for Buildings an [10] IS: 2950 (Part 1) – 1981 – Code of Practice for Design and Construction of Raft Foundation. [11] Soil Mechanics and Foundation Engineering (Geotechnical Engineering Series) by V.N.S. Murthy. [12] Soil Mechanics and Foundation Engineering by Dr. K. R. Arora.
[13] Foundation Analysis and Design, The McGraw-Hill Companies, Inc. by Joseph E. Bowles.