Abstract—The 2008 Research Assessment Exercise (RAE) in the UK involved the peer review of over 12,500 research outputs in Business and Management, of which 92% were journal articles. Each paper was awarded a quality grade and these were accumulated for each submitting department to provide an overall quality profile in terms of the proportions of its outputs in each category. Given the papers submitted and the resulting grade profile for each department, we have used linear programming to produce the best estimate of the grades awarded to papers from each journal that had more than three entries. This provides both a grade profile for each journal and a single quality estimate. The results are shown to have good validity in comparison with other journal rankings.
Index Terms—journal rankings, LP, research assessment exercise (RAE)
I. INTRODUCTION
There is an increasing drive towards measuring the research quality of academics whether it is for the purposes of promotions, jobs, or assessing the performance of departments and centres or even whole universities. Quality can only be judged through the activities and publications produced, especially journal papers as that, in Business and Management, is the primary currency. However, assessing the quality of individual papers by peer review is itself time consuming, requires expert(s) in the area, and there could be disagreement. Partly for these reasons, the quality of the journal that the paper is published in is often taken as a proxy for the quality of the paper itself. This then displaces the problem to judging the quality of journals (and assuming that all papers within are of equal quality) – hence the proliferation of journal rankings.
There are two main ways of generating rankings – stated preference (peer review), where some group of experts determines a ranking, and revealed preference where actual publishing behaviour is measured usually in terms of the citation impact factor (IF) or the h-index. A third approach is to statistically combine a set of already existing lists [1]. There are many ranking lists available on the Harzing website (http://www.harzing.com/) but for Business and Management the list produced by the Association of
Manuscript received Sept. 15, 2010; revised Oct. 15 2010.
J. Mingers is at Kent Business School, University of Kent, UK (+44 1227 824008; e-mail: j.mingers:kent.ac.uk).
K. Watson was a graduate student at Kent Business School (e-mail: [email protected]).
M. P. Scaparra is also at Kent Business School (e-mail: [email protected]).
Business Schools (ABS) ( http://www.the-abs.org.uk/?id=257) has become extremely important in the UK.
However, the use of journal rankings as a proxy for quality is extremely contentious. For example, Paul [2, 3], who was a member of the 2008 RAE Panel, states that “One major conclusion appears to be that journal rankings are not a good indicator of the quality of any paper published in that journal, nor necessarily the combined quality of all the papers” [3, p. 324]. Macdonald and Kam [4], in a bitter critique, suggest that the whole world of academic publishing in management is one of gamesmanship and game playing with the so called quality journals simply reproducing standard, consensual research within a small elite community. Clarke and Wright [5], then editors of the J. of Management Studies, disagreed and argued that journals do develop and change in response to their communities, and that the reviewing processes of high quality journals do in fact lead to high quality papers. Adler and Harzing [6] provide another strong critique of the dysfunctional effects of academic ranking systems and journal rankings in particular. The main complaint is that they lead to a narrowing of the discipline, concentrating research into the narrow confines of established journals and discouraging innovation and interdisciplinary work.
In the light of these debates, the latest (2008) Research Assessment Exercise (RAE) provides a major opportunity to investigate the extent to which journal rankings are concordant with direct judgements of the quality of individual papers. The 2008 RAE differed in major ways from previous ones. Rather than assigning departments a single grade for their research quality as before (1, 2, 3B, 3A, 4, 5, 5* in 2001), a quality profile was generated in terms of the proportion of the department’s research that was judged to be on a 4-point scale plus unclassified. Full details of the RAE can be found in various reports issued by HEFCE [7-9] prior to it, and the results were announced in 2008 [10]. Also available online are the subject overview report for the Business and Management Panel [11]; the complete submissions [12]; and the quality profiles [13]. Quality itself was defined in terms of three characteristics – originality, significance and rigour – and the levels were:
4*: Quality that is world-leading, that has become, or is likely to become, a primary point of reference in the field or sub-field.
3*; Quality that is internationally excellent, that has become, or is likely to become, a major point of reference in the field or sub-field.
2*: Quality that is recognised internationally, that has made, or will make, a contribution to knowledge, theory, policy or practice.
Estimating Business and Management Journal Quality
from the 2008 UK Research Assessment Exercise
1*: Quality that is recognised nationally, that has made or will make a limited contribution.
Unclassified (0*): Quality that falls below the standard of nationally recognised work or which does not meet the definition of research.
The requirement of the Panel was to assess a department’s quality in terms of their submitted research outputs, the research environment and the esteem of the staff members. A profile was generated for each and these were combined (70%, 20%, 10%) to produce the overall quality profile. As we are only concerned with the outputs the environment and esteem profiles will not be considered.
The Panel was therefore required to produce a quality grading for every single piece of work submitted, in this case 12,575 in the RAE database. This was clearly a huge task and initially the B&M Panel stated that it would look at 25% in detail. The results that were made public consisted of the grade profile for each of the 90 institutions that submitted together with details of all the publications. However, the grades for individual outputs are not available.
Prior to the exercise, the Panel Chair made it clear on several occasions that the Panel did not intend to use journal ranking lists in making their judgements. He also stated that they expected to find a range of qualities within a single journal. What was not clear was how they would in fact grade outputs if they were only actually going to read a proportion of them. In the event, the Panel claimed that “most outputs were read in considerable detail” [11, p. 5]. This is clearly different to the 2001 RAE where the Panel “typically read 15%-30% of outputs in their sub-areas, with some reading as much as 75%” [14, p. 53]. It would seem to be a formidable task: 12,600 outputs to be read by 18 academics (700 each) over a just a few weeks, but nevertheless it does represent a major exercise in directly assessing the quality of research outputs. However, little is said in the review about precisely how the quality judgements were made, how the grade boundaries were determined, or the extent of consensus or dissensus.
The purpose of this paper is to try to use the peer review quality judgements made by the Panel to evaluate journal quality and journal ranking lists such as the Association of Business School’s one. The approach relates the outputs submitted and the quality profile awarded to them for each of the 90 departments. This is done using linear programming (LP). In brief, we create a set of decision variables for each journal that represent the 5 possible quality levels (including unclassified as zero). We then use LP to find the values of those variables that minimise the difference between the estimated quality profile (calculated from the variables) and the actual quality profile awarded to each department. The approach is analogous to least squares regression but with several thousand variables to be determined. The result is an estimate of the proportion of papers from a journal that were awarded the various levels of quality. In undertaking this analysis we are not suggesting that the Panel came to its decisions by using journal rankings. We are exploring the extent to which the Panel’s actual results, given only in aggregate form, can be replicated by an analytical method. We are not trying to replicate the process used in arriving at the results.
II.MODELLING THE AGGREGATE RAE QUALITY EVALUATIONS A.The LP Model
In our situation we know the quality profiles for each institution and we also know how many entries for each journal the institution submitted. We can then create two sets of variables – the grade profile for each journal and the estimated grade profile for each institution. The grade profile for a journal consists of five variables each of which represents the proportion of the journal’s entries judged to be in a particular category (0* – 4*). The sum of the 5 variables for a journal must sum to 1.
The estimated grade profiles for institutions are formed from the journal grades, weighted by the number of articles an institution submitted from each journal. The estimated profile is, for each institution at each grade, the sum of each journal grade at grade (0*- 4*) multiplied by the number of articles from the institution submitted from that journal divided by the total number of articles in that department’s submission. The objective (function) is then to minimise the difference between the estimated profile and the actual profile for each institution by finding the best values for the journal grades.
Initial model (QP1) Let:
j index the journals (j = 1 .. no. of journals) g index the grades 0* - 4* (g = 0 .. 4)
i index the universities (i = 1 .. no. of institutions) eig be the estimated proportion of research at grade g for university i
pjg be the estimated proportion of the outputs of journal j graded at grade g
uig be the actual proportion of research at grade g for university i
nij be the number of entries of journal j submitted by university i
2
.
ig igi g
Min
u
e
(1)1
ig ij jg
j ij j
e
n p
n
for each (i) and (g) (2)1
jg g
p
for each (j) (3)0
jg
p
,e
ig0
objective minimising the absolute difference rather than the squared difference.
A third model was also developed with the idea of determining a single integer quality grade for each journal rather than a grade profile. This was easy to achieve in the formulation by simply restricting the journal grade variables (pjg) to being 0-1 integers. The constraint that they must sum
to 1 for each journal ensures that only one of the five possibilities will actually be 1 and so each journal will have only one grade level. This model (MIP1) proved very difficult to solve computationally.
Extensive data cleaning was necessary before running the model. A particular issue was what to do with the outputs that were not journal papers, in the main books and book chapters. We could not include each item individually as if it were a journal because the model only works to the extent that the same journal occurs in a number of submissions. We could simply leave them out which would increase the residual variation in the results but lose information. So, what we did was to include each type (authored book, book chapter etc) as if it were a journal. Thus all 285 authored books were included as if they were a single journal. This increased the accuracy of the model and also allowed us to see how these output types were treated by the RAE Panel. Were books rated highly or lowly? These categories (Book, Book Chapter, Edited Book, External Report and Other) represented 950 outputs (7.6% of the whole dataset). We also had to decide what to do with all the journals that had only a small number of entries. The problem is that if the journal only occurs a small number of times it becomes essentially unconstrained and the model can use it simply to fill in unexplained variation. After some experimentation we decided to only include in the model those journals that had at least three entries. This meant excluding around 57% of the journal titles. We recognize that this may introduce some bias into the model but it was not apparent what this might be other than they were generally of a low quality.
B.Solving the Model
The LP was coded using the OPL Studio 3.7 modelling language and solved by the CPLEX 8.0 optimizer. Several runs of different versions and sizes of the model were conducted. The final version of the QP1 included 701 journals and 89 institutions. It included roughly 4,400 variables and 2,050 constraints. It solved in a few minutes and gave an objective function value of 23.6, i.e., the sum of all the 445 errors. With a model like this where the variables are relatively under-constrained, there may be many solutions which differ marginally and give broadly similar results. The sensitivity was explored and although there were many reduced costs with low values there were none with zero. In terms of the validity of the solution this is best evaluated in terms of concordance with other evidence, a task that is carried out in section 4.1
The integer version proved to be computationally very expensive. After running continuously for 35 days it had still not reached an optimal, fully integer solution. This is not unusual with models that have a large number of integer variables (3500 in our case). It had in fact converged to a near optimal which did not change significantly over 21 days but could not be shown to be the actual optimal.
This model gave a grade profile for each journal but for the purpose of constructing a journal ranking and comparing it
with existing ones it is more appropriate for each journal to have a single grade. There are several ways of achieving this: take the modal grade, i.e., the one with the largest proportion; calculate the mean grade (i.e., the GPA) and then round this to the nearest integer; or get the LP to calculate the best value with the integer version of the model (MIP1).
After inspecting and comparing the results for the three different methods – mode, rounded mean, and MIP it was decided that the mode gave the fairest and most consistent results and so this has been used in the ranking comparisons, but the final table of results (available from the authors) includes the grade profile for each journal and the MIP results.
III. RESULTS A.Assessing the validity of the reconstruction
Before presenting the results in detail, it is important to evaluate their degree of validity. The philosophy of the model is that given the aggregate results from the Panel, and knowing the papers that were submitted, it should be possible to reconstruct, to some extent, the grades that were awarded at the journal level. Clearly, if the results we obtain are wholly at odds with our preconceptions of journal quality we might conclude that they were not capturing anything meaningful. But, we would not expect them to be identical with the existing rankings, partly because of noise in the data resulting from the non-journal outputs being removed, and partly because the Panel were clear that their results did not mirror the existing lists [11, p. 1]. So validity it is a matter of degrees of concordance.
[image:3.595.301.542.497.587.2]We first consider the extent of concordance with existing journal rankings.
TABLE 1
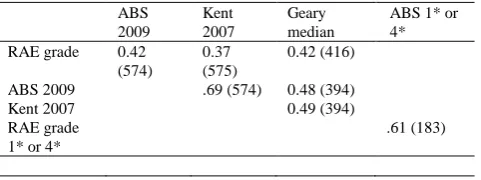
CORRELATIONS BETWEEN RECONSTRUCTED RAE GRADE AND JOURNAL RANKINGS (NO. OF OBSERVATIONS)
ABS 2009
Kent 2007
Geary median
ABS 1* or 4* RAE grade 0.42
(574)
0.37 (575)
0.42 (416)
ABS 2009 .69 (574) 0.48 (394)
Kent 2007 0.49 (394)
RAE grade 1* or 4*
.61 (183)
Table 1 shows the correlations between the reconstructed RAE grades and the ABS, Kent [1] and the Geary et al [15] rankings. Given the large numbers of observations (shown in parenthesis) all the correlations are highly significant. It is noticeable, however, that they are not as high as the correlations between the rankings themselves tend to be, as shown in the ABS documentation. We can see for example that the correlation between the Kent ranking and the ABS one is significantly higher. Nevertheless, it is clear that the RAE model is broadly in line with these rankings. We also looked specifically at the extremes – the 1* and 4* journals. These had a higher correlation (0.609) perhaps showing that there is greater agreement about the best and worst journal and less about the boundary between 2* and 3*.
than totally ignore outputs such as books, book chapters and reports we included them as if they were a single journal. This generated a score for each of these categories so that we could see how the category was treated in comparison with the journals. The results are shown in Table 2.
TABLE 2
RECONSTRUCTED GRADES FOR NON-JOURNAL OUTPUTS
Type Modal
grade
Mean grade
No of outputs
No. of institutions Authored
book
2 2.437 285 68
Book chapter
2 2.21 333 65
Edited book
2 2.10 61 28
Other 1 1.41 169 47
External report
1 1.13 102 35
In the third column we can see the mean grade awarded to each output type. From a validation perspective the order of these types is what we would have expected, i.e., authored books were graded most highly, going down through book chapters to edited books. Other types (e.g., software) and external reports were least valued. This again gives us a degree of confidence in the overall method. In terms of the actual numbers, there was a concern before the RAE that books would be downgraded because they were not refereed. This does seem to have happened in that one might expect that a quality book would be regarded more highly than a single paper and so books should have achieved a high grading – at least 3* or more. We can also see that external reports scored poorly which does not bode well for the REF trying to encourage the submission of work that has external impact.
Finally we look at the journals that come out top from our reconstruction in Table 3. In terms of our estimation, the best journals are those that have the highest proportion of 4*. In the Table, we have selected all journals that have at least 50% 4* and we have restricted it to those with at least 12 submissions. This results in 30 journals which are ordered in terms of the % 4* (although for reasons of space only the top-20 are shown). Firstly, all 32 journals are in ABS and only two were less that 3* or 4*. They were also generally ranked highly in other lists including Geary’s analysis of the 2001 RAE and the citation impact (CI) factor. Interestingly, 14 of them are also included in the FT top-40 list of journals which is used to rank business schools worldwide. Of the rest of the FT-40 list, all but four were graded 3*, those being Human Resource Management (USA), International J. of HRM, J. of Business Ethics, and J. International Business Studies which were only graded 2*. Table 3 also includes a sprinkling of the very top American journals such as AMR, Management Science, Organization Science, HBR and the American Economic Review. Given that these results have been generated purely by the model it does give us confidence that the results do reflect judgements about journal quality.
B.Comparing the RAE grades with the ABS ranking
As the ABS list has become the de facto standard for Business and Management in the UK, and is used extensively, for better or worse, in making decisions about appointments, promotions and submissions, it is important to see how it compares with the reconstructed RAE grades.
TABLE 3
TOP-20 JOURNALS BASED ON % 4* RECONSTRUCTED FROM RAE OUTPUTS
Journal Title % 4.0 % 3.0 RAE Entries
ABS 2009 1* to 4*
FT Top 40 y/n?
Management International Review
100.0 0.0 27 3 y
Journal of the Academy of Marketing Science
100.0 0.0 18 4
Accounting, Organisations and Society
100.0 0.0 82 4 y
Harvard Business Review
100.0 0.0 19 3 y
Journal of Applied Psychology
100.0 0.0 33 4 y
Abacus 100.0 0.0 25 2
Journal of Marketing Research
100.0 0.0 17 4 y
Journal of Financial Economics
100.0 0.0 39 4 y
Academy of Management Review
100.0 0.0 30 4 y
Fiscal Studies 100.0 0.0 13 2
Review of Financial Studies
100.0 0.0 27 4 y
International Journal of Industrial Organization
100.0 0.0 14 4
American Economic Review
100.0 0.0 17 4 y
Information Systems Journal
100.0 0.0 18 3
Organization Science
100.0 0.0 28 4 y
MIT Sloan Management Review
100.0 0.0 23 3 y
Marketing Science
98.2 0.0 12 4 y
Communications of the ACM
91.8 5.2 13 3
Financial Accountability and Management
87.5 4.3 30 3
European Journal of Information Systems
85.7 13.6 49 3
Table 4 shows the proportions of journals awarded different grades from the ABS ranking and our RAE reconstruction. The first column shows the proportions in the total ABS list, whether or not they were submitted in the RAE, with a GPA of 2.17. Column 4 shows the proportions for all those journals in our RAE list (remembering that it excludes journals with less than 3 entries) with a GPA of 2.34. This is significantly higher (Χ2
[image:4.595.42.276.141.249.2]proportion of 4* and 3* is higher, and 2* and 1* lower. A fairer comparison is to consider only those journals that are in common between ABS and our RAE list – columns 3 and 6. The two are in fact very similar with GPAs of 2.43 and 2.42 although there are significant differences (Χ2
3=15.6). within grades with the RAE giving more 4* and 1*, and less 2*, in other words, the RAE gave more of the extreme grades.
C.Selectivity of journal submission
We now move to the issue of selectivity of journal submission. On the one hand there were an increased number of journals entered into RAE 2008 and a significant number of these are not even in the ABS list. This suggests a wide range of material. However, at the same time there is continual pressure on institutions to submit only the best work and this pressure will grow. There is currently concern that increasingly the top business schools will limit their academics to publishing only in the top A-rated journals. The degree of selectivity can be seen from column 2 of Table 4 which shows the grade proportions in those ABS
journals that were not submitted in the RAE. These are significantly different to the profile of ABS journals that were submitted (Χ2
=60.1). We can see that 45% of those not submitted were 1* while only 4% were 4*. This clearly shows the extent to which attention was focused on those ABS journals that are at least 2*.
We can get some more evidence directly from columns 5 and 6 of Table 4. This shows the distribution of reconstructed RAE grades for ABS and non-ABS journals. Did the RAE Panel actually grade ABS journals higher than non-ABS ones? They are significantly different (Χ24=39.9) but although there are fewer 4* and 3* than would be expected in the non-ABS journals, the biggest difference is that 13% of the non-ABS journals were allocated 0* as opposed to only 2% of the ABS ones. In other words, according to our estimates a significant proportion of the non-ABS papers were considered to be of no research merit. This could be a legitimate response of the Panel to submissions that were not relevant to business and management. But it could also reflect a conscious or TABLE 4
PROPORTIONS OF JOURNALS IN PARTICUALR RANKS COMPARING ABS WITH RAE
Grades given in ABS RAE Estimated Grades
All journals Journals not in RAE
Journals in RAE and our list
All our list Journals not in ABS
Journals in ABS and our list
4* 10% 4% 15% 18% 13% 19%
3* 24% 12% 31% 28% 19% 30%
2* 37% 39% 37% 28% 25% 28%
1* 28% 45% 17% 22% 29% 21%
0* 3% 13% 2%
GPA 2.17 1.74 2.43 2.34 1.9 2.42
Note: we show the proportions in terms of % for ease of comparison but all Chi-Square tests were performed on the underlying frequencies
unconscious bias towards recognized journals regardless of paper quality. Overall, we feel that there is evidence both of extensive selectivity in submissions and possible bias in judgements.
D.Differences between subject areas
It is of interest to look at the relative grading between subject areas. Reports from both the 2001 RAE [14] and the 2008 RAE [11] make it clear that the subjects were seen to have different levels of quality. So, to what extent is that borne out by the ratings?
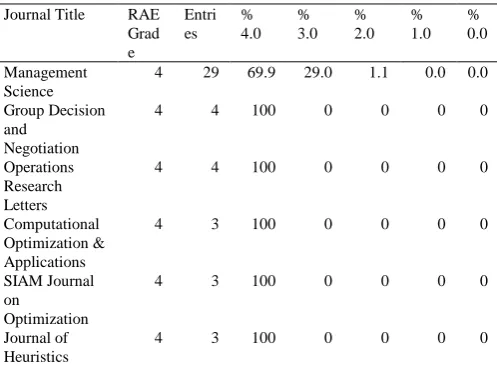
The data show a significant difference from the highest sector, Psychology, with a weighted average score of 2.8 down to Tourism and Hospitality with a score of 1.3. The non-ABS journals have an average of 2.0. The ABS sectors are somewhat different to the subject groups that the RAE Panel report discusses. Many of the long-established disciplines (e.g., Psychology) and management areas (e.g., Accounting and Finance, Operational Research and Organisational Studies) scored highly while newer and perhaps more applied areas (e.g., Ethics, Management Development, Innovation and Tourism) did less well. We want to look in more detail at specific subject areas and have chosen Operational Research as that is where we have expertise. Note that some more mathematical OR groups were submitted the Statistics and OR Panel so their contributions are not included here. Table 5 shows all OR journals ranked in terms of the reconstructed RAE grade and then the number of entries. Those with a “#N/A“ in the ABS
Grade column were not classified in the ABS list but we have added them in as they all would be considered as OR journals. There are seven 4* journals although all but Management Science have small numbers and three do not appear in ABS. Some of these are likely to be due to the small sample, but Decision Sciences, J. of Heuristics and the SIAM journal are generally considered to be strong. In the 3* journals comes EJOR, with the second largest entry, and a wide range of other journals, many with small entries. It is interestion that Operations Research, the other top US journal, has virtually all its entries graded as 3* rather than
TABLE 5
TOP JOURNALS IN OR RANKED BY IMPUTED RAE GRADE
Journal Title RAE Grad e
Entri es
% 4.0
% 3.0
% 2.0
% 1.0
% 0.0
Management Science
4 29 69.9 29.0 1.1 0.0 0.0
Group Decision and
Negotiation
4 4 100 0 0 0 0
Operations Research Letters
4 4 100 0 0 0 0
Computational Optimization & Applications
4 3 100 0 0 0 0
SIAM Journal on
Optimization
4 3 100 0 0 0 0
Journal of Heuristics
[image:5.595.303.552.598.781.2]Decision Sciences
4 3 100 0 0 0 0
European Journal of Operational Research
3 137 0.0 98.2 1.8 0.0 0.0
Computers and Operations Research
3 20 0.0 67.9 32.1 0.0 0.0
Operations Research
3 20 0.0 98.9 1.1 0.0 0.0
Journal Royal Statistical Society A
3 9 26.2
4
44.8 28.8 0 0
Theory and Decision
3 9 0 80.0 19.9 0 0
IEEE Trans. on Systems, Man, & Cybernetics
3 7 0 84.4 15.5 0 0
Mathematical Programming
3 7 0 98.3 1.6 0 0
Advances in Applied Probability
3 5 0 81.0 18.9 0 0
Annals of Operations Research
3 5 0 96.2 3.7 0 0
Journal of Combinatorial Optimization
3 4 0 96.5 3.4 0 0
Computational Statistics & Data Analysis
3 3 0 82.0 17.9 0 0
IV. CONCLUSIONS
The 2008 RAE has been a huge exercise in peer review and the judgements that were made would have been extremely valuable in addressing some of the issues that surround the whole idea of journal rankings. Unfortunately, the gradings of individual outputs have been kept secret which was, in our view, both unnecessary and undesirable. What we have attempted to do in this paper is to reconstruct the judgements made by the RAE Panel at least at the level of individual journals although not at the level of papers. We have done this by developing a mathematical programming model that determines the best grade profiles to match the overall institutional profiles for all journals submitted that had at least three entries.
We have shown, both in terms of internal reliability and in terms of correspondence with existing ranking lists such as the ABS list, that the results we have generated have a high degree of plausibility. It is extremely unlikely that they do not represent to a reasonable degree the actual judgements made by the Panel although clearly we can never actually assess the extent of the residual error.
With these results, we have been able to comment on several issues that have arisen concerning the conduct and effects of the RAE, as well as produce an RAE-based ranking for around 700 journals in Business and Management and related areas. Many of these journals are not included in the ABS list. Care should be taken in interpreting the results, especially for journals that had few entries.
Comparing the grades given by the RAE with those in ABS, on those journals that are in common the overall results are very similar in terms of the average grade awarded. However, there are differences in the proportions of each grade with the RAE giving more 4* and 1*, and there are differences for particular journals with some being two or even three grades apart.
In terms of the RAE leading to selectivity, there is evidence in both directions. There were a very wide range of journals submitted, many of them not in ABS but many of these non-management journals were given a low rank. It is clear that there was selectivity in the submissions with relatively few ABS 1* journals being submitted. There is also a clear association between the GPA awarded to an institution and the proportion of its submission that was in ABS journals although the direction and nature of the causality is unclear. The RAE Panel was clear that it was not grading papers on the basis of the journal they were published in. There is evidence that supports that since many journals, even top ones, had a degree of dispersion in their gradings. However, our results also produced 62% of journals with 100% in a single grade suggestion a considerable degree of uniformity in judgement.
As expected, there were significant differences in the gradings given to different sectors with Psychology, Accounting and Finance, Management, and OR doing well and Management Development, Innovation, and Tourism faring worst.
For non-journal outputs, our results show that books (GPA 2.4) and book chapters (GPA 2.2) gained grades that were commensurate with journals, but reports (GPA 1.4) and other forms of output (GPA 1.3) were seen as poor. This does not bode well for the REF and its focus on external research impact
REFERENCES
[1] Mingers, J. and A.-W. Harzing, Ranking journals in business and management: a statistical analysis of the Harzing dataset. European Journal of Information Systems, 2007. 16(4): p. 303-316.
[2] Paul, R., Challenges to information systems: time to change. European J. Information Systems, 2007. 16: p. 193-195. [3] Paul, R., Measuring research quality: The united Kingdom
Government's Research Assessment Exercise.European J. Information Systems, 2008. 17: p. 324-329.
[4] Macdonald, S. and J. Kam, Ring a ring o'roses: quality journals and gamesmanship in Management Studies.Journal of Management Studies, 2007. 44(4): p. 640-655. [5] Clark, T. and M. Wright, Reviewing journal rankings and
revisiting peer reviews: Editorial perspectives.Journal of Management Studies, 2007. 44(4): p. 612-621. [6] Adler, N. and A.-W. Harzing, When knowledge wins:
Transcending the sense and nonsense of academic rankings. Academy of Management Learning and Education, 2009. 8(1): p. 72-95.
[7] RAE, RAE 2008 : Initial decisions by the UK funding bodies. 2004, HEFCE.
[8] RAE, Guidance on submissions. 2005, HEFCE.
[9] RAE, RAE 2008 Panel criteria and working methods. 2006, HEFCE.
[10] RAE, RAE 2008: the outcome. 2008, HEFCE.
[11] RAE, RAE2008 subject overview reports: I 36 Business and Management studies. 2009, HEFCE.
[12] RAE, RAE 2008 submissions: UOA 36 Business and Management Studies. 2009, HEFCE.
[13] RAE, UoA 36 Business and Management Studies: Quality Profiles. 2009, HEFCE.
[14] Bessant, J., et al., The state of the field in UK management research: Reflections of the Research Assessment (RAE) Panel. British J. of Management, 2003. 14: p. 51-68.