Optimized Student Skill Prediction using
Educational Data Mining
Banumathi J1, Nagalekshmi N K2, Sakthi Sivani S3, Shiana Rex R S4
1
Assistant Professor, IT Department, University College of Engineering, Nagercoil 2, 3Students of IT Department, University College of Engineering, Nagercoil
Abstract: Education helps people develop as individuals and to build social, problem solving and decision making skills. The need of predicting the performance and the future of the students in this Big Data world had led to the mining of large datasets. Educational Data Mining (EDM) is an emerging discipline, concerned with developing methods for exploring the unique type of educational data.
Exploring through big datasets and using various DM methods, one gets to identify unique patterns which helps improving students’ academic performance. Necessity of predicting skills has being rising in present day. The selected dataset comprises of the skills related to the students.
The reading, writing, listening and logical skills of those students are tested and are being recorded. Collected data are being mined using algorithms like Clustering, Decision Tree and Neural Network. The Clustering helps in grouping similar students. The Decision Tree helps distinguish the skills among the students. The Neural Network helps finding patterns in data. The results from various algorithms are compared for accuracy in the result and one of the best system is resulted.
Keywords: Educational Data Mining, Clustering, Decision Tree, Neural Network.
I. INTRODUCTION
Living in the Data Age, terabytes (1012 bytes) or petabytes (1015 bytes) data flood into various departments. It has become an important need and difficult to analyze this large amount of data. One should accept that this explosive growth of data had led to the computerization of the society.
The database and data management industry has evolved with several critical functionalities : data collection and database creation, data management (includes data storage and retrieval and database transaction processing), and advanced data analysis (includes data warehousing and data mining).
Moreover data mining is treated as a synonym for knowledge discovery from data (KDD)[11], sometimes data mining is viewed as merely an essential step in the process of knowledge discovery. The processing of knowledge discovery is an iterative sequence of the following steps[11]:
1) Data Cleaning: to Remove noise and inconsistent data.
2) Data Integration: Where multiple data sources may be combined.
3) Data Selection: Where data relevant to the analysis task are retrieved from the database.
4) Data Transformation: Where data are transformed and consolidated into forms appropriate for mining by performing summary or aggregation Operations.
5) Data Mining: An essential process where intelligent methods are applied to extract data patterns.
6) Pattern Evaluation: To identify the truly interesting patterns representing knowledge based on interestingness measures.
7) Knowledge Presentation: where visualization and knowledge representation techniques are used to present mined knowledge to users.
Data mining defines the process of discovering knowledge from large amount of data and interesting patterns. The common sources of data are databases, data warehouses, the Web, other information repositories, or data that are streamed into the system dynamically.
Figure 1.1: Architecture of Data Mining[13]
II. EDUCATIONAL DATA MINING
Educational Data Mining (EDM) is a learning science focuses on analyzing and studying data from academic databases. Being an interdisciplinary field of study, EDM applies machine-learning, statistics, Data Mining (DM), information retrieval, and many other recommended methods and techniques to various educational data sets so as to resolve educational issues. It concentrates mainly on the development, research, and application of computerized methods to detect patterns in educational data else it would be impossible to handle such a tremendous educational data.
EDM has become an emerging research area in latest time aimed at analyzing the peculiar data that arise in educational settings to resolve education related issues. In order to get required information and to find the hidden relationship from large educational database, different data mining techniques are developed & used but the fact is that they are similar to Data Mining techniques. There are varieties of popular data mining techniques within the educational data mining like classification, clustering, outlier detection, association rule, prediction etc..
[image:2.612.135.514.568.716.2]III. LITERATURE SURVEY
There are several researchers who have focused on educational data mining, among them Allan Tucker, Leila Yousefi and Mashael Al luhaybi have used clustering and classification techniques to analyze academic performance and showed the accuracy range between C4.5 and Naïve Bayes.[1] A.S. Arul Lawrence and T. Deepa used emotional intelligence and academic performance for analysis and techniques like Mean, standard deviation, t-test, Anova and Pearson’s coefficient correlation, but data mining techniques were not used.[2] Ashish Dutt, Maizatul Akmar Ismail and Tutut Herawan suggested clustering algorithm but there is no demonstration of implementation.[3] Bo guo, Rui zhang, Guang xu, Chuangming shi and Li yang used deep learning architecture and techniques like students’ performance prediction network(SPPN), but it requires massive computational power and layer by layer execution, which is little bit sensitive.[4] Cristobal Romero and Sebastian Ventura uses pre-processing, DM algorithm and non-negative matrix factorization, it covers wide range of EDM research but it requires large work in EDM field.[5] Leena Khanna, Dr. Shailendra Narayan Singh and Dr. Mansaf Alam made use of linear regression, clustering, classification and association rule mining. But there is lack of privacy and security.[6] Qasem A, Al-radaideh, Ahmad Al Ananbeh and Emad M. Al- Shawakfa proposed the use of 10 fold cross validation method and C4.5 algorithm (which is J48 in Weka). Here decision tree helps better interpretation and 87.9% accuracy of model is rated well but it is only a preliminary model.[7] V.Shakila and Dr.S.Prasanna presented the uses of Emotional intelligence inventory. They gave enthusiastic brainpower and academic achievement as input but no implementation of DM techniques.[8] G. Shiyamala Gowri, Ramasamy Thulasiram and Mahindra Amit Baburao used K-Means cluster analysis, Apriori algorithm and various computational ways. They consider various parameters and some detailed information. But many inappropriate methods are being used for the particular field.[9] Finally Sunita B Aher and Mr. LOBO L.M.R.J. used both clustering and classification techniques, also lime lighted the applications of DM. Here DM methods are explained clearly but no display of steps and analysis are seen[10].
IV. PROPOSED SYSTEM
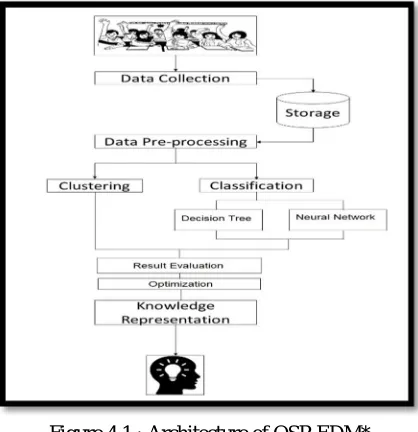
[image:3.612.219.428.502.718.2]The present education system has been reported of being slowly degraded of the quality of education as the quantity keeps on increasing. The downward phase of education has led to numerous disasters, increased number of dropouts, low knowledge gain, lacking basic skill, etc. As per a survey even High School Students were neither able to read fluently nor write a passage properly. It is necessary to take effective measures for this sort of serious issue. As an initiative step, we propose to apply Educational Data Mining techniques on a student dataset. To create such a dataset, we have gathered data from students. The skills are being tested among these students and are being recorded. The basic skills like Listening Skill, Logical Skill, Reading skill and Writing Skill are being tested. The students are given metrics as ‘Low’, ‘Medium’, and ‘High’. In addition, their Family Background is also being collected. Over this Dataset we apply the EDM/DM techniques like Clustering, Classification algorithms/techniques. Thus, the students get grouped and/or classified into classes as ‘Need Improvement’, ‘Average’ and ‘Excellent’ based on the metrics and algorithms applied on the dataset.
Figure 4.1 : Architecture of OSP-EDM*
V. ALGORITHMS A. Clustering
Clustering is an algorithm that helps in grouping the similar objects in a dataset into a group called cluster and the other dissimilar objects are grouped into other clusters.
The basic principle behind clustering is that partitioning and clumping the objects based on the data similarity. Clustering favours in adapting to changes and also in isolating feature that distinguish the groups.
K-Means clustering is a Partitioning clustering algorithm. It is also called Centroid-based clustering algorithm. K-means clustering is a type of unsupervised learning.
The Objective of this algorithm is to find groups or similarity in the data.
The algorithm is done in sequence of iterative steps. It partitions ‘n’ objects into ‘k’ no. of clusters. The input given will be the dataset and the no. of clusters that should be resulted. The centroids are initialized as per the required no. of clusters. If those centroids are the most suitable one, then the clustering is done based on them. Else the centroids will keep on updating until the result is obtained.
Each and every time we update the centroid list, the objects cluster themselves into cluster with nearest mean (i.e.) the centroid. It aims at minimizing total intra-cluster variance / the squared error function[11]. In WEKA, it is used as SimpleKMeans.
D =∑ ∑ | ( )− | (5.1)
Equation 5.1, gives the intra-cluster variance, where k denotes no. of clusters, n for no. of data objects, xi for case i and cj for
centroid of cluster j.
B. Decision Tree
A Data Mining function that assigns the data elements or cases of a dataset to target categories or classes, such a technique is called Classification. The main aim of classification is to predict the resultant class for each case in the data with high accuracy. The Decision Tree algorithm is similar to Naive Bayes, as it is also based on conditional probabilities. The only difference is that decision trees generate rules.
A rule is a conditional statement that are easily understood and used within a database to identify a set of records.Decision tree is a structure with the components like top node, internal node, branch and leaf node, they denote the root node, test on the attribute,
outcome of the testand class label respectively. Entropy is an important feature that that gives an average amount of information for
the identification of class label for a tuple in D.
This Selection measure is used to reduces the information needed to classify the tuples. The attribute with the highest Entropy is set as the root node and assumed as the best split based on which further steps are done. Attributes with rather higher Entropy are set as internal nodes. The steps are recursed until stopping criterion is reached (i.e.) target class is reached. We had chosen C4.5, a decision tree and an extension of ID3, which in WEKA is known as J48 tree. The below formula denotes the Entropy for dataset D also known as Info(D)[11].
H(D) =− ∑ ( ) ( ) (5.2)
In equation 5.2, p(i) stands for the probability that a current tuple belongs to class Ci and is calculated as |Ci,D| / |D|. m is the distinct
values defining classes. Ci denotes the class labels.
C. Neural Network
For Optimization purpose we use another classification technique called the Neural Network. A neural network is defined as the set of connected input or output units where the connections are associated with weights. In the learning phase, it learns by adjusting the weights for the correct prediction of class label.
Neural Network learning is also called Connectionist learning. The Neural Network is a symbolization of the biological neural network. Multi-layer feed forward neural network is one of the Artificial Neural Network.Multi-layer feed forward neural network consists of an input layer, hidden layer (one or more), output layer. Layers are made up of units. Simultaneously the input units are fed to form the input layer.
VI. IMPLEMENTATION
The Data to be mined is collected from 150 students. The tests were conducted for each of the required skills. Then, the answers were evaluated and were given metrics ‘Low, High, Medium’ based on particular criteria. Later, it is stored in either csv(comma separated value) or arff (attribute-relation file format) format. The data is checked for redundancy and errors, then cleared off errors. This is the data preprocessing step. The tool chosen for the mining is WEKA Explorer. In the Preprocess tab again pre-processing is done, if necessary. In the Cluster tab, we select the Simple KMeans for obtaining the Clusters as output. In the Classify we select the J48 tree to obtain the decision tree From which the IF-THEN rules are being generated. Once again in Classify tab, the Multilayer Perceptron that results with the neural network. With the results from three algorithm, we are ought to optimize the final result. The result is represented as patterns (graph of clusters, trees, neural network), IF-THEN rules and also as formal output (which includes run information, error rate, accuracy and some other instances).
VII. RESULT
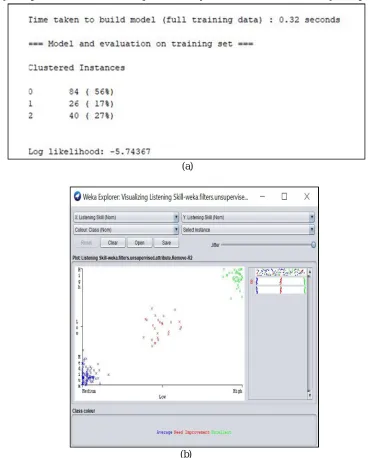
The results are being displayed below for the listening skill. The three algorithms have been executed over the input data and the result is being displayed as patterns and also formal output. Then analysed with each other for accuracy and optimization.
(a)
[image:5.612.120.490.261.719.2]
(b)
The formal output is shown in fig. 6.1(a) and three clusters distinguished with colours (blue, red and green) are shown in fig.6.1(b).
Figure 6.2 : Classification (Decision Tree) Results for Listening Skill. The formal output depicts the full summary of Classification (Decision Tree) and the decision tree is generated, shown in Fig.6.2
(a)
(b)
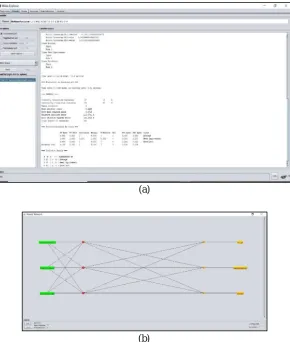
[image:6.612.162.452.372.714.2]The summary of Neural Network is explained in Fig.6.3(a) and The generated neural network is seen in Fig.6.3(b).
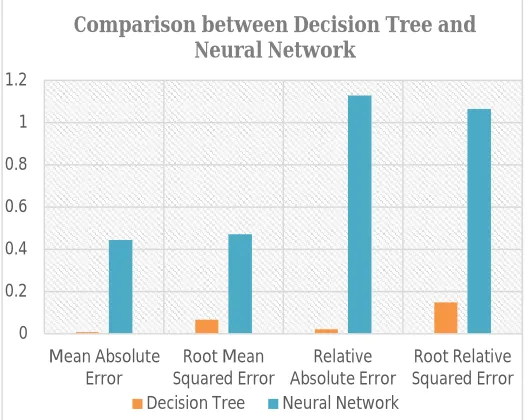
[image:7.612.175.439.324.534.2]By comparing the error rate with each other, gives out the Optimized result. For this let us take the Decision tree and the Neural Network.
Table 1: Comparison between Decision tree and the Neural Network
Figure 6.4 : This graph illustrates the difference in error between Decision tree and Neural Network
From above results (for Listening Skill) we could see that Decision tree has resulted with minimum errors. Hence, IF-THEN rules can be extracted from the decision tree. Each one of the rule is created from each path (from the root to the leaf node) of the tree. The IF part denotes the rule antecedent or precondition and the THEN part denotes the rule consequent.
The IF-THEN rules for the listening skill is given as follows: 0
0.2 0.4 0.6 0.8 1 1.2
Mean Absolute Error
Root Mean Squared Error
Relative Absolute Error
Root Relative Squared Error Comparison between Decision Tree and
Neural Network
Decision Tree Neural Network
Decision Tree
Neural Network
Mean Absolute Error 0.0088 0.4446
Root Mean Squared
Error 0.0663 0.4715
Relative Absolute
Error 2.2262% 112.6781%
Root Relative
Squared Error 14.9389% 106.2955%
IF Listening Skill = Low THEN Class = Need Improvement
IF Listening Skill = Medium THEN Class = Average
The rules state that if a student’s listening skill is ‘Low’, then he/she is placed in the class ‘Need Improvement’. Similarly if the Listening Skill is ‘Medium’ and ‘High’, then will be placed in the class ‘Average’ and ‘Excellent’ respectively.
The seed for OSP-EDM is the first of its kind. The analysis gives a way for enhancing the students’ knowledge gaining ability. Rather, it helps identify where the students lag and lead a path for their better enhancement. No existing systems have the same baseline.
VIII. CONCLUSION
Educational Data Mining has been rigorously growing due to the need of increasing the standard of the education. This project also aims the same. Education means gaining knowledge, but now-a-days students lack the so called knowledge over chasing behind marks. They are left behind without any sort of skill development. This project has clearly classified and clustered a mass of students into three classes, which may help in their future development. The future works may include consideration of other features like personal interest, hobby, etc. We have used WEKA Explorer as the tool for analysis. There are many other open source tools like ANOVA, Clementine, KEEL, KNIME, Neuro Shell Classifier, R, RapidMiner, ROSETTA that are some of the commercially available tools. Various other data mining techniques can also be implemented. Using the results from such projects, the development of education is expected to be triggered up and help in excessive growth of the economy and welfare of the country.
REFERENCES
[1] Allan Tucker, Leila Yousefi and Mashael Al luhaybi, Computer Science Department, Brunel University, London, UK, “The Prediction of Student failure using Classification Methods: A Case Study”, 2018
[2] A.S.Arul Lawrence, T.Deepa, “Emotional Intelligence and Academic Achievement of High School Students in Kanyakumari District”, International Journal of Physical and Social Sciences, 2013.
[3] Ashish Dutt, Maizatul Akmar Ismail, and Tutut Herawan, “A Systematic Review on Educational Data Mining”, IEEE, 2017.
[4] Bo Guo, Rui Zhang, Guang Xu, Chuangming Shi and Li Yang, School of Computer Hubei University of Education, Wuhan, Hubei, China, “Predicting Students performance in Educational Data Mining”, IEEE, 2015.
[5] Cristobal Romero and Sebastian Ventura, “Data Mining in Education”, John Wiley &Sons, Inc., 2012
[6] Leena Khanna, Dr. Shailendra Narayan Singh, Dr. Mansaf Alam, “Educational Data Mining And Its Role In Determining Factor Affecting Students Academic Performance: A Systematic Review”, IEEE, 2016.
[7] Qasem A. Al-Radaideh, Ahmad Al Ananbeh, and Emad M. Al-Shawakfa “A Classification Model for Predicting the suitable study track for school students”, IJRRAS 8 (2) August 2011.
[8] V.Shakila and Dr. S.Prasanna, “A Survey of School Education using Data Mining Technique”, International Journal of Pure and Applied Mathematics, 2018. [9] G.Shiyamala Gowri, Ramasamy Thulasiram and Mahindra Amit Baburao, “Educational Data Mining Application for estimating students performance in Weka
Environment”, 14th ICSET-2017.
[10] Sunita B Aher, Mr. LOBO L.M.R.J., “Data Mining in Educational System using Weka”, International Conference on Emerging Technology Trends (ICETT) 2011.
[11] Jiawei Han, University of Illinois at Urbana–Champaign, Micheline Kamber, Jian Pei, Simon Fraser University, “Data Mining Concepts and Techniques”, Morgan Kaufmann Publishers, an imprint of Elsevier, 2012.
[12] Laura Calvet Liñán, Ángel Alejandro Juan PérezOpen University of Catalonia (UOC), Spain, “Educational Data Mining and Learning Analytics: differences, similarities, and time evolution”, RUSC, 2015.
![Figure 1.1: Architecture of Data Mining[13]](https://thumb-us.123doks.com/thumbv2/123dok_us/1247548.651297/2.612.135.514.568.716/figure-architecture-of-data-mining.webp)