2392
©IJRASET: All Rights are ReservedOptimum Crop Prediction using Data Mining and
Machine Learning techniques
Prof. Amol Pande1, Sarvan Purohit2, Shruti Jadhav3, Krisha Shah4
1Head of Department, Computer Engineering, Datta Meghe College of Engineering, Navi Mumbai. 2,3,4Datta Meghe college of Engineering, Navi Mumbai
Abstract—In this paper, we develop a web based application system that will assist farmers in selecting the crop that is most suitable for his land. This system is better than other systems as it considers various parameters like soil color, soil moisture, soil ph value, season, rainfall, temperature all at once unlike other systems which consider only two or three parameters but not all at once. Based on all these parameters the system will predict the best crop for the farmer using machine learning approach, decision tree (ID3 algorithm).
Keywords—parameters, machine learning, decision tree, ID3 algorithm
I. INTRODUCTION
The primary occupation of India is agriculture. Agriculture is the broadest economic sector and is the main source of income for many people in India.. Agriculture is dependent on many climate and economy factors. These factors include soil, climate, cultivation, irrigation, fertilizers, temperature, rainfall. But the problem in today’s farming culture is lack of knowledge about the climatic trends and patterns, scientific knowledge about the soil that will benefit the crop yield. Optimum crop prediction system aims at taking all these factors into consideration and provide a central platform for farmers to analyse a optimum solution for their crop yield. This system will focus on the analysis of the agriculture data and finding optimal parameters to maximize the crop production using ID3 algorithm.
II. EXISTING SYSTEM
All the existing systems consider only a single parameter or at the most two to three parameters and based on these two three parameters they give the prediction of crop yield. Also many of the existing systems just provide the information about crops and not the prediction about crop yield. Hence a system that provides not only information about crops to the farmers but also provide the prediction of the best suitable crop for a particular land needs to be developed.
III. PROPOSED METHODOLOGY
A. Data Collection and Data Filtering:
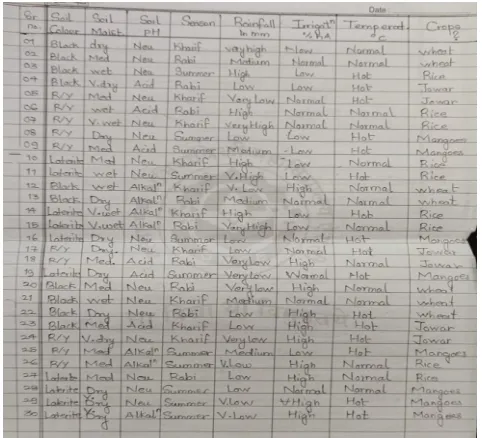
Data used in this system is collected on ground reference basis and the dataset was filled manually considering all the combinations of the parameters. Then data filtering was done based on the conditions required by the crops for cultivation. The rows with the condition that were not required by any of the crop were removed. The Table 1 shows the parameters on which crop prediction will be done and the Figure 2 gives the instance of the database used in the system.
Following are the parameters of the table : Soil_color Soil_moisture Soil_ph Season Rainfall Irrigation
Crops( Target Attribute )
2393
©IJRASET: All Rights are Reserved [image:2.595.171.412.95.314.2]
Figure 2: Instance of database used
B. Entropy Calculation:
Entropy in ID3 gives the gives the amount of uncertainty in the dataset. Entropy is calculated using the formula:
where,
S is the current dataset i is set of classes in S
p is proportion of the number of elements in class to the number of elements in set S Using this formula entropy is calculated for every attribute of the above mentioned table.
C. Calculation of Gain:
Information gain indicates how much uncertainty in dataset S was reduced after splitting the dataset S on the attribute A. Information gain is calculated using the formula:
where,
H(S) is the entropy of set S
T is subsets created from splitting set by attribute
2394
©IJRASET: All Rights are ReservedFigure 3: Gain calculation
D. Decision Tree formation
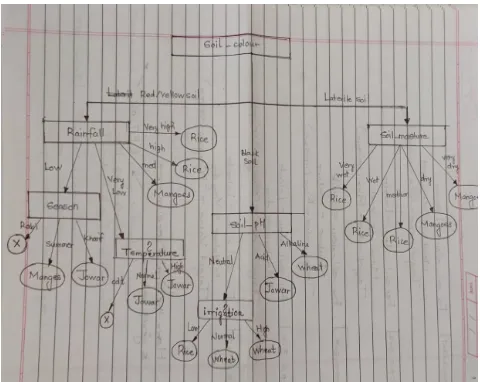
Decision tree is one way to display the algorithm that has conditional statements. Root node of the decision tree is selected as the attribute having maximum gain. Considering the above example, gain of soil colour is maximum. Hence soil colour is selected as the root node for the above dataset.
Similarly all the child nodes are determined and we get the decision tree as shown in Figure 4:
Figure 4: Decision tree
E. Error Percentage:
Training error is the error that you get when the training model is run on the dataset which was used to train the model that is the training dataset. Testing error arises when the training model is run on the datasets to which it is not exposed previously. This helps to measure the accuracy of the system. If the training error is low and testing error is high, you are likely overfitting your training data.
IV. IMPLEMENTATION
[image:3.595.191.431.426.617.2]2395
©IJRASET: All Rights are Reserveddataset and remaining tuples are used as testing dataset. After applying ID3 algorithm to this dataset, we get a rule base. This rule base would be provided as output rules at the backend. The user has to enter the “district” where his land is located as input. This input will follow the rule base and based on this rule base and input from user the crop will be predicted. These rules are used to classify the crops to a particular district of Maharashtra.
Figure 5 shows the rule base for fruits:
Figure 5: Rule base for fruits
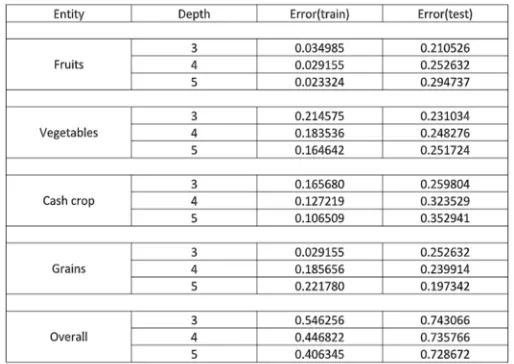
[image:4.595.148.405.446.628.2]Similarly all the the other rule base are obtained an applied to backend. The Figure 6 shows the training and testing error analysis of every entity along with the depth of the decision tree.
Figure 6: Error analysis
Based on this table, the following can be concluded:
● As the depth increases the Error(train) decreases thereby stating that the training is improved due increase in depth of the decision tree and vice-versa.
● As the depth increases the Error(test) increases because of the repetition of the attribute in the tree leading some false counts in test cases and vice-versa. (only exception is overall entity )
● Error rate of individual entity is less as compared to the overall entity, which states that due to increase in the number of target attribute the accuracy of the decision making tree is degraded.
● Error rate at depth=4 acts as the Average error rate for depth=3 and depth=5,Hence we can say that depth=4 acts as the average case in decision making and prediction.
2396
©IJRASET: All Rights are ReservedV. CONCLUSION
Use of technology in agriculture can change the situation of decision making and farmers can yield in better way. Optimum crop prediction system with the help of ID3 algorithm and data mining will help the farmer to make the best choice for crop to be cultivated. Also this system will provide the farmer with prediction of many crops and not just one crop. With this prediction, he can not only grow the crop of his choice but also utilise the space between the plants to grow other plants which he can afford to grow in the space between the plants. This will prove more profitable for the him. When the hard work of the farmer is supported by the analytical knowledge of machine learning technology, it will be beneficial for him to achieve economic balance in the society.
REFERENCES
[1] Impact of Climate Change on Yields of Major Food Crops in India: Implications for Food Security Pratap S. Birthal , Md. Tajuddin Khan, Digvijay S.
Negi and Shaily Agarwal Agricultural Economics Research Review Vol. 27 (No.2) July-December 2014
http://ageconsearch.umn.edu/bitstream/196659/2/1-PS-Birthal.pdf
[2] Predictive ability of machine learning methods for massive crop yield prediction Alberto Gonzalez-Sanchez, Juan Frausto-Solis, Waldo Ojeda-Bustamante
Vol 12, No 2 (2014). http://dx.doi.org/10.5424/sjar/2014122-4439
[3] A Survey on Data Mining Techniques in Agriculture M.C.S.Geetha Assistant Professor, Dept. of Computer Applications, Kumaraguru College of Technology, Coimbatore, India.Vol. 3, Issue 2, February 2015 http://ijid.informaticspublishing.com/index.php/ijid/article/download/110845/77859 [4] Enhanced Crop Yield Prediction and Soil Data Analysis Using Data Mining Ms.P. Kanjana Devi Research Scholar in PG Dept. of Comp. Science
Kamalam College of Arts and Science,Anthiyur, Udumalpet.Volume 4, Issue 6, December, 2016.http://www.ijmcs.info/current_issue/IJMCS161204. pdf [5] Analysis of agriculture data using data mining techniques: application of big data. Majumdar et al. J Big Data (2017).
https://journalofbigdata.springeropen.com/articles/10.1186/s40537-017-0077-4
[6] Prediction of Crop Yield using Machine LearningRushika Ghadge, Juilee Kulkarni , Pooja More, Sachee Nene , Priya R LProfessor, Dept. of Computer Engineering, VESIT college, Maharashtra, India.Volume: 05 Issue: 02 | Feb-2018. https://www.irjet.net/archives/V5/i2/IRJET-V5I2479.pdf
[7] Prediction of crop yield using regression analysis V. Sellam and E. Poovammal Department of Computer Science and Engineering, SRM University,
Kattankulathur – 603203, Tamil Nadu, India. Indian Journal of Science and Technology, Vol 9(38), 10.17485/ijst/2016/v9i38/91714, October 2016https://www.google.co.in/url?sa=t&source=web&rct=j&url=http://www.indjst.org/index.php/indjst/article/viewFile/91714/73940&ved=2ahUKEwj3 0MTf_ajeAhWCE4gKHZIqAvQQFjAJegQIBRAB&usg=AOvVaw2ycbzhok-7wzNS9jta93te&cshid=1540724532864
[8] Agriculture Analysis for Next Generation High Tech Farming in Data Mining P. Vinciya, Dr. A. Valarmathi IJARCSSE,vol. 6, Issue 5, 2016.
https://drive.google.com/file/d/1SpjYcns9fYhNnXlYJytLaJ60FycmpxD8/view?usp=drivesdk
[9] Agricultural production output prediction using Machine Learning Classification techniques Md. Tahmid Shakoor, Karishma Rahman, Sumaiya Nasrin
Rayta, Amitabha Chakrabarty Department of Computer Science and Engineering BRAC University,Dhaka, Bangladesh(IEEE - 2017). https://ieeexplore.ieee.org/document/8016196