Abstract— One of the major issues in the Aviation Supply Chain is to minimize the delays. There has been a variety of research focused on the solution for the airline company. This study aims to take the aviation supply chain as a whole, and model scenarios to form a basis for both the service providers and the disabled passengers to win. Both the delay causing factors defined by international aviation organizations and the complaints of disabled passengers are analyzed. Bayesian network is used to determine the interactions on which scenarios can be constructed.
Index Terms— Bayesian Network, Scenario Planning, Aviation Supply Chain, Disabled Flyers.
I. INTRODUCTION
ervice supply chains are constructed to improve the quality of life; the fundamental concern is the end user satisfaction. The civil aviation is such a network where a win-win approach would contribute in sustainability. This study is initiated to reduce the lead times in aviation services while the customer complaints are reduced. Literature survey showed that disabled passengers have considerable complaints and cause delays; the interactions caused the focus on special part of the customers.
The difference in perception of delay by actors are analysed by using cognitive map approach. Then the Bayes networking implementation on the most important interactions, to create scenarios that will support the strategic decisions of the supply chain members.
The paper is organized as follows. First, relevant literature is reviewed to identify and define the key constructs of the research model. Second, the research model and its key propositions are developed from the literature. The study’s methodology is then discussed, including measurement issues. Finally, the results are presented and further studies are explored.
II. THE AVIATION SUPPLY CHAIN
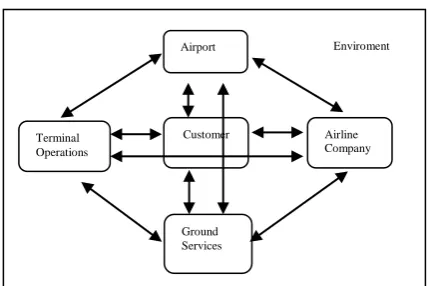
Many actors are integrated in their activities within the aviation service process. Figure 1 shows the role players. This complexity is to be observed by each party so that a flexible organization can adapt to changing competitive conditions.
M. Yorukoglu is with the Air Force Academy, Industrial Engineering, Yesilkoy, Istanbul, Turkey. (corresponding author with mobile: +905068638908 e-mail: [email protected]).
[image:1.595.327.542.201.344.2]G. Kayakutlu is with ITU Industrial Engineering, Macka, Istanbul, Turkey. (corresponding author with mobile: +905322127734 and e-mail:[email protected]).
Figure 1. Role Players and Interactions in Aviation Supply Chain
The ground services are updated and regulated by international authorities, and the regulations are designed by relevant industrial institutions. Services are classified by Civil Aviation General Directorate in association with Ministry of Transport and in accordance with international organizations. The fourteen activities are Representation, Cargo Control and Communication, Unit Loading Equipments Control, Passenger Traffic, Cargo and Mail, Ramping, Aircraft Cleaning, Fuel and Oil, Aircraft Line Maintenance, Flight Operation, Transportation, Catering Services, Supervision and Management, Aircraft Private Security Service and Supervision.
As in all supply chains, the final objective is to satisfy the customer in the aviation supply chain, namely the passenger whose basic expectancy is to fly from one place to another. The expectancies and evaluations of the passenger have considerable influences on the services. The customer is only satisfied by the quality as perceived by the customer. Gourdin [18] showed the price, security, time schedule, baggage carriage, food beverage quality, comfort of the seating and the in-flight service as the quality elements in terms of customer perception. It was also put forth that the permanent preference in the selection of the airlines by the passengers was related to the prestige and service given [34; 45;46]. Parasuraman et Al. [35] method of service gap analysis allowed the assessment of seating comfort (tangibility), security (reliability), sensibility and the courtesy of the attendants (readiness to respond) as the required attributes in the aviation services. Fick and Ritchie [17] emphasized that the reliability expectance from the airlines is increasingly important for the other services in tourism. Truit and Haynes [45] have seen even the type of aircraft as a quality attribute. Carlzon [7], the President of SAS
M. Yorukoglu and G. Kayakutlu
Bayesian Network Scenarios to improve
The Aviation Supply Chain
S
Customer
Enviroment
Ground Services Airport
Terminal Operations
(Scandinavian Air System) has defined each customer contact as the “moment of decision" and emphasized that a successful airline business is dependent on the performance of the personnel at first contact with the customer.
The 2001 Airline Quality Rating (AQR) report indicated that the air travel service declined and that the airline companies could not provide the service promised [6]. Thus, it is stated that the airline companies must have a positive image in the minds of their customers in critical service elements. Bowen and Headley [6] have developed multiple performance criteria on the combination of AQR based timely arrival, aborting boarding involuntarily, wrong baggage and 12 customer complaint categories. This study assisted the airline marketing people to visualize the competition based conditions in a perceptive map of service performance criteria used for AQR [20]. Research on aviation services is expanded by analyzing the interactions among the role players. Zhang et. Al. [51] analyses the revenue sharing contracts among the airlines and the airport. Yuan et. Al.[50] study the airport-air cargo co operations to support government subvention policies. Schmidberger et. Al. [41] evaluates the performance of groundwork processes in relation to the airport and customers.
III. AVIATION SERVICES AND THE DISABLED PASSENGERS
A. Aviation Services:
In a study made for the service quality at Spring Airlines in China, the ground services, cabin facilities, food/beverage service, baggage actions, response to the complaint, timely flight and flight safety issues were specified as quality [43]. Chaharsoughi [8] expands the experienced problems by overviewing the service deficiencies. At Incheon International Airport, Korea, a study is made to measure the service quality of the airport passenger terminal [36] and the factors are detected as reliability, fast solution generation, assurance, empathy, carriage, facilities, migration and environment.
The customer complaints between 2001 and 2009 prepared by The Air Transport Users Council (AUC) in UK are as follows [4]: Cancellation, delay, baggage, reservation, postponed boarding, ticketing/return, baggage charges, flights directed to another location, erroneous transits, timing changes, in-flight services, faulty departure, seating, fees and taxes, special requirements, documentation, ground services, check-in problems, security, ticketing fee, charge of excess baggage, safety, problematic passengers, airline company defaults, hand baggage, excess reservation, damages during flight, medical issues, insurance, flight sharing between companies and others.
The delay is a common phenomenon in aviation services, and emerges as a result of one or more factors. The traffic management incapacity, adverse weather conditions and the problems at the airport or in the airline operations are observed as causes. Millions of airline passengers are affected by the flight delay every year and it was put forth in the statistics by AUC, that the delay complaint was considered as the most common problem of 25% of the passengers in 2005 [23].
The key performance criteria used in the measurement of the airports service quality by Airport Council International (ACI) are declared waiting period on check-in, waiting period during security checks, number of proper baggage trolleys and waiting period in passport procedures [1].
The criteria required by Air Traffic Services Performance Focus Group for the evaluation of performance objectives and proper service quality measurement given under complex operation environment are specified as follows [3]:
1.Delay – measures the completion period of an operation beyond optimum.
2.Predictability – measures the expected variations in the aviation services system by the user.
3.Flexibility – measures the system capacity to cover varying requirements of the user.
4.Efficiency – measures the flight path curve containing the route and altitude.
5.Access – measures the insertion to the aviation services system and the coverage of requests.
6.Cost of Service – Aviation services assign and Airline Company spends. It uses standard cost concepts.
Each criterion has a meaning in time during the service process, according to the importance and received notices. As observed in literature the delay seems to be the most important problem for aviation services.
Majority of the components during the flight and supplementary processes can lead to flight delay due to chain interaction. The overlapping complex networks and the existence of interconnected flights render highly sensitive processes [3]. In order to prevent flight related delays, the measures are taken either by the airlines or by international aviation authorities and the updated reference point related to the subject is the regulation referred as "Regulation Nr. 261/2004" dated February 17, 2005 by European Commission [38]. According to these regulations any lateness exceeding 15 minutes is qualified as a “delay”.
The reason of delays is generally based upon two main sources; the scarcity of airline resources and the lack of airport capacity. Meteorological conditions and air traffic congestion are beyond the control of the relevant institution and companies. The countries and authorities have made the delay classifications, being aware of the damages to be caused by the delays.
Table 1. Ratio of Delay Reasons [16] Delay reasons 2006 2007 2008 Airline operations % 55 % 55 % 54
Airport % 16 % 16 % 17
Weather conditions % 10 % 10 % 10 Road and route % 10 % 12 % 13
Security % 5 % 4 % 3
Other reasons % 4 % 3 % 3
It is observed that airline operations have the highest ratio it is under control of the airline companies.
The customer needs during delay are defined in the plan prepared by US Ministry of Transportation [15]. These needs are summarized as information, communication, food and beverage, shopping places, clean environment, accommodation and resting places, land transportation and special services. Passengers are required to take cautions for the special medical needs, child care products, communication tools and devices, nutrition, time assessment tools, clothes, pet care [2]. Holloway [21] determined main costs of airline companies and airport operations in flight delays, as fuel consumption, wages, maintenance costs, ground services agency costs, airport expenses and unexpected services and accommodation for the passengers. It is a serious issue in the aviation chain. Jovanović, [23] even suggests to outsource processing the delays.
B. Disabled Passengers
Researches and studies run on issues of aviation services as received by customers are limited to complaints [6;10;11;12;13; 27; 28; 33]. Majority of the complaints are attributed to the disabled customer group. This fact is the main motivation of our study.
In aviation services a disabled person is defined to be the person who has permanent or temporary physical or mental insufficient movement abilities originated from the declining age or other reasons. According to the reports of Leonard Cheschire Disability organization that combines 255 institutions for disabled people from 52 countries 2 million disabled people travel per year only in England [27]. In Turkey on the other hand, currently only 1% of airline passengers are disabled people [20] .
Although several regulations and sanctions are defbetween ined by international aviation authorities, the disabled passengers are yet far from satisfaction [37; 48].
A wide range of research has been made by U.S. Ministry of Transportation Statistics Bureau for the disabled passengers. They have classified thirteen disabled groups who complained about twelve major problems in flight services. Studies are run since 2004 and are published monthly to share important statistics [10;11;12;13]. Disabled passanger problems are collected in thirteen items.
Within the problems faced, the most important problems are shown as inconvenience of the seats, defects in providing support, problems in the auxiliary instruments and devices (articles i, j, k) .
It was reported in the research made by LCD organization in 2007 that, 61% of disabled people faced problems
during the boarding process, 11% cancelled flights due to the problems in catching the flight, 25% had issues to solve during the reservation and ticket procedures, 37% was subject to inappropriate behaviour by the flight and 67% had problems with the seats [28]. It was also reported by a professional air service organization that 55% of the disabled people had positive evaluations about the air trips they have taken in the last 2 years, 19% were aware of the new regulations in air travel, 58% believed that air travel progressed day after day, 85% recommended the air-line which was convenient for the disabled people and 94% flew again with the same air-line .
IV. BAYESIAN NETWORKS
Bayesian maps are used in supplying the missing information and details as well as bringing the priorities and importance of the effective factors [42]. In comparison to other casual maps, Bayesian Maps use Bayes Theory to find the certainty factors on the interaction of decision variables [9]. Bayesian network is applicable when historical data is available and shows the major advantage on analyzing complex unstable systems [31].
Bayesian networks are directed acyclic graph which means there are no cycles. If there is a link between A and B we say that B is a child of A and A is a parent of B. In Bayesian networks, a link from node A to node B implies a direct influence of A over B and the probability of B is conditioned on the value of A [29]. Graph theory gives qualitative reasoning in Bayes networks. Conditional Probabilistic Table constitutes the probabilities of nodes. Bayesian theory is based on the chain rule which is about the joint probability distribution of each variable. According to the chain rule, the marginal and conditional probabilities can be computed for each node of the network.
Suppose that we have variablesX1, . . . ,Xd, the joint probability of Xi is then:
When the occurrence of an incident I is received from external sources about possible states of a variable or a set of variables, the conditional probabilities of the variables can be computed by marginalizing over the joint. The probability of incident of related events is calculated as following:
where S is the set of variables X1, . . . ,Xd [9].
Bayes networks integrate the semantics and the probabilities, in a way combining the human knowledge and statistical data with the aim of modeling uncertainty. This facility has several advantages for making inferences. First, it is an effective method for data with missing values. Second, it enables us to look at the problem in a wide frame by presenting causal relations. Third, it combines the probabilistic and causal semantics so has an ) 1 ( ))
( parents (
) ,..., (
1
1
d
i
i i
d P X X
X X P
) 2 ( )
( ) , ( ) | (
I P
advantage to integrate the human knowledge and data. Bayesian network is a useful tool for modeling the uncertainty [49].
This advantage features the Bayesian Network to be a computational intelligence tool which can be easily used in qualitative analysis unless it gets too complex with numerous networks.
Currently Bayes Networks are used in data mining functions like classification [5], clustering [9], forecasting [47], as well as decision making [25]. Trucco et al. [44] developed a model for risk analysis in maritime transportation.
Knowledge management has also been a current field of application for Bayes networks where, the maps are used hybridized with neural networks [32] or fuzzy logic [30]. Results achieved using Bayesian networks are visual, illustrative and easy to interpret for decision makers.
V. APPLICATION
Afore mentioned 99 criteria defined by IATA [22] are reevaluated by Delphi technique. Experts from airlines and airports are interviewed with the consideration of interacting roles in aviation supply chain. The following factors are identified as major delay causes:
Reservation procedures and oversales Ticket sales
Security procedures Internal terminal activities Check-in procedures
Passangers’ baggage procedures Boarding procedures
Migration, customs and health procedures
Besides, the thirteen complaints of the disabled passangers determined by U.S. Ministry of Transportation are combined into 10 items after discussions with organization of the disabled:
Insufficient, missing information
Security problems related to the disability Airport not being convenient and useful
Anouncements, notifications not being clearly understood
Not being accepted to plane
Not being accepted to plane without a companion Airport not being convenient and useful
Sitting places being inconvenient Defects in providing support Defects in auxiliary devices
Face to face interviews are run with three groups: the experts from the aviation sector - 10 experts, academicians in the aviation field - 5 professors disabled passangers - flight passangers from three different organisations.
It was aimed to compare the perception of different groups to handle the problem and solution from various dimensions. Since the interaction among the complaints is found irrational it is left out of the evaluation table. Responders have evaluated the cause and effects by using
“0” for no effect, “1” for positive effect and “-1” for negative effect.
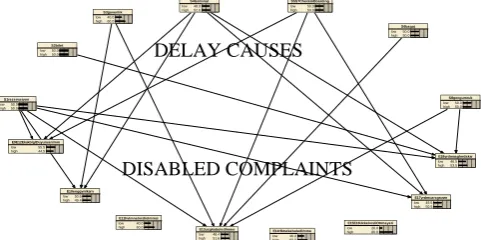
Figure 2. Effects of Delay Causes on Complaints of the Disabled Passengers.
There were four cognitive maps constructed as a result of the surveys, one for each group and one for all. When interractions in the cognitive maps are observed focus is given to two Bayes Networks: Effects of causes on complaints (Figure 2) and Influences of Complaints on Delay factors (Figure 3).
[image:4.595.316.557.78.198.2]Each factor (either cause of delay or complaint item) is defined to have low and high values according to IATA and DOT statistics. The probabilities are distributed to three values according to the median. These data are defined in NETICA software to calculate the Bayesian probabilities. As an example of defining the data we can show the defects in auxiliary devices. The statistics of five years is X=[0.012727349, 0.018630208, 0.018983095, 0.020300766, 0.020125264]. This ends up in 60% High and 40 % Low.
Figure 3. Influences of the Disabled Complaints on Delay Factors
As the last step, running NETICA software concludes on probabilities of effects. We could also compare the before influence and after influence probabilities to measure the effect.
The following effects are detected as the focus points: If check in boarding time increases then the highest increase is caused in defects in auxiliary devices and not being accepted to the plane.
When delays in internal terminal activities are high then the biggest increase is caused in complaints about security.
Increase in reservation delays is most effective in defects in providing support!
Decrease in delays of reservation, security, internal terminal activities and check-in cause high complaints in
E14rfktszkabuledlmme low high 40.0 60.0 S2bilet low high 50.0 50.0 S3guvenlik low high 40.0 60.0 S4terminal low high 48.0 52.0 S5S7CheckinBoarding low high 50.0 50.0 S6bagaj low high 50.0 50.0 S1rezervasyon low high 50.0 50.0 E9E12EkskblglDuyuruanlmm low high 55.5 44.5 E10enggvnlksrn low high 50.6 49.4 E13ucgkabuledlmme low high 48.4 51.6 E15E16UckelvrsliOtrmayeri low high 20.0 80.0 E17yrdmcarcgrcsrn low high 49.5 50.5 E18yrdmsaglmdaksr low high 46.5 53.5 S8gocgumruk low high 50.0 50.0 E11hvlmnelvrsliolmmsi low high 40.0 60.0 DELAY CAUSES DISABLED COMPLAINTS E14rfktszkabuledlmme low high 40.060.0
S2bilet
low high50.050.0
S3guvenlik
low high55.045.0
S4terminal low high 49.3 50.7 S5S7CheckinBoarding low high 43.6 56.4 S6bagaj low high47.752.3
S1rezervasyon
low high50.050.0
E9E12EkskblglDuyuruanlmm
low high 60.040.0
E10enggvnlksrn
low high60.040.0
E13ucgkabuledlmme
low high 40.060.0
E15E16UckelvrsliOtrmayeri
low high 20.080.0
E17yrdmcarcgrcsrn
low high60.040.0
E18yrdmsaglmdaksr low high 40.0 60.0 S8gocgumruk low high49.750.3
E11hvlmnelvrsliolmmsi
low high 40.060.0
DELAY CAUSES
[image:4.595.313.556.421.548.2]insufficient, missing information and security complaints only.
Increase in complaints of insufficient, missing information, security and inconvenience of the airport converts security delays from low to high!
Almost all complaints of disabled passengers increase the delays in check-in.
These brief results show that aviation services have to take new cautions in order to satisfy the disabled flyers.
VI. CONCLUSION
The necessity of sustainable development allows the business world to invest more in socially active projects. This paper studies the possibilities of reducing complaints received from the disabled flyers without any negative effect on delays.
The Bayes Network technique is used to measure the effects of IATA defined delay causes on the complaints of the disabled passengers and vice versa. Complaint statistics are detected from DOT, USA.
Results achieved after interviewing aviation experts, academicians and disabled passengers show that unexpected evidences can increase the complaints. It is also observed that complaints increase delays mainly in check-in process.
This study will be continued to develop Expert systems to give alarms for authorities in condition of critical increases. In order to globalize the results more surveys are suggested to be run in various countries and the statistics are to be collected from the same countries.
Further studies are recommended based on the scenarios generated in this study. As an example, the check-in process is to be redesigned as a supply chain process.
This survey will no doubt bring a new vision for all parties in the aviation supply chain.
REFERENCES
[1]ASQ (Airport Service Quality), (2009, October 09). “Measuring and
benchmarking delivered service levels,”
http://www.airportservicequality.aero/content/performance.html
[2]ATA (Air Transport Association of America). (2009, October 31).
Dealing with delays,
http://www.airlines.org/customerservice/passengers/Passenger+Tips +for+Preparing+for+Lengthy+Onboard+Delays.htm
[3]ATSPFG (Air Traffic Services Performance Focus Group). (2009,
October 21). “Airline metric concepts for evaluating air traffic
service performance,” Available:
http://www.boeing.com/commercial/caft/cwg/ats_perf/ATSP_Feb1_ Final.pdf
[4]AUC (UK,The Air Transport Users Council). (2009, October 04).
Annual reports, United Kingdom, Available:http://www.auc.org.uk/
default.aspx?catid=306&pagetype=90&pageid=10178
[5]Baumgartner K., Ferrari S., Palermo G., 2008, “Constructing
Bayesian networks for criminal profiling from limited data,”
Knowledge Based Systems 21, 563–572.
[6] Bowen B.D., Headley D.E. 2001. “The airline quality rating 2001”,
Accessed: 2010, April 04,
http://www.unomaha.edu/unoai/aqr/aqr01/AQR2001.pdf
[7]Carlzon J.,” 1987, Moments of truth,. Haper & Tow. New York.
[8] Chaharsoughi M. T., (2008, September 19), “Prioritizing of airline
service recovery solutions by service problems deployment technique with a case study ın Iran Air,”,Master Thesis, Luleå University of Technology, Department of Busimess Administration and Social Sciences, Division of Industrial Marketing and E-Commerce, 193p, Sweden. Available:
http://epubl.luth.se/1653-0187/2008/074/LTU-PB-EX-08074-SE.pdf
[9] Cheon S.O., Kim S., Lee S.Y., Lee C.B., 2009, “Bayesian
networks based rare event prediction with sensor data, “Knowledge Based Systems 22, 336–343.
[10] DOT (Department Of Transportation) Office of Aviation
Enforcement and Proceeding, Aviation Concumer Protection Division, (2009, September 17). 2009 Report on Complaints Received By Airlines in 2008, 5p., USA. Available:
http://airconsumer.ost.dot.gov/publications/Gateway1-2008.htm
[11] DOT (Department Of Transportation) Office of Aviation
Enforcement and Proceeding, Aviation Concumer Protection Division, (2009, September 17). 2008 Report on Complaints Received By Airlines in 2007, 5 p., USA. Available:
http://airconsumer.ost.dot.gov/publications/Gateway1-2007.htm
[12] DOT (Department Of Transportation) Office of Aviation
Enforcement and Proceeding, Aviation Concumer Protection Division, (2009, September 17). 2007 Report on Complaints Received By Airlines in 2006, 5 p., USA. Available:
http://airconsumer.ost.dot.gov/publications/Gateway1-2006.htm
[13] DOT (Department Of Transportation) Office of Aviation
Enforcement and Proceeding, Aviation Concumer Protection Division, (2009, September 17). 2006 Report on Complaints Received By Airlines in 2005, 5 p., USA. Available:
http://airconsumer.ost.dot.gov/publications/Gateway1-2005.htm
[14] DOT (Department Of Transportation) Office of Aviation
Enforcement and Proceeding, Aviation Concumer Protection Division, (2009, September 17). 2005 Report on Complaints Received By Airlines in 2004, 5 p., USA. Available:
http://airconsumer.ost.dot.gov/publications/Gateway1-2004.htm
[15] DOT2 (Department Of Transportation) Office of Aviation
Enforcement and Proceeding, Aviation Concumer Protection Division, 2008. (2009, October 05). “Development of contingency plans for lengthy airline on-board ground delays,” 58 p., USA. Available:
http://airconsumer.dot.gov/publications/TarmacTFModelContinge ncyPlanningDocument.pdf
[16] EUROCONTROL CODA, (2009, December, 02). Digest –
Annual 2008 Delays to Air Transport in Europe.
Available:https://extranet.eurocontrol.int/http://prismeweb.hq.corp.
eurocontrol.int/ecoda/coda/public/standard_page/public_applicatio n.html (31.10.2009).
[17] Fick, G. R., Ritchie, J. R. B., 1991. “Measuring service quality in
the travel and tourism industry,” Journal of Travel Research, 30(2), 2–9.
[18] Gourdin K., 1988, “Bringing quality back to commercial travel,”
Transportation Journal, 27(3), 23–29.
[19] Gupta S., Kim H.W., 2008 “Linking structural equation modeling
to Bayesian networks: decision support for customer retention in virtual communities,” European Journal of Operational Research 190, 818–833.
[20] Gursoy D., Chen M.H., Kim H.J., 2005, “The US Airlines
relative positioning based on attributes of service quality,” Tourism Management Journal, 26, 57–67.
[21] Holloway, S. 2005. Straight and Level: Practical Airline
Economics, Journal of Transport Geography, 13(1) 102-103.
[22] IATA. (2009, September 07). IATA Delay Codes.
http://www.b737mrg.net/downloads/b737mrg_delaycodes.pdf
[23] Jovanović R., 2008, “The cost of passenger delays to airlines: An
[24] Kao H.Y., Huang C.H., Li H.L., 2005, “Supply Chain Diagnostics With Dynamic Bayesian Networks”, Computers & Industrial Engineering, Volume 49, Issue 2, Pages 339-347
[25] Kisioglu P., Topcu Y.I., 2011, “Applying Bayesian Belief
Network approach to customer churn analysis: A case study on the telecom industry of Turkey,” Expert Systems with Applications, Volume 38, Issue 6, Pages 7151-7157
[26] Lauria E.J.M., Duchessi P.J., 2006, “A Bayesian belief network
for IT implementation decision support,” Decision Support Systems 42, 1573–1588.
[27] LCD1 (Leonard Cheshire Disability), (2009, December 02)..
Leonard Cheshire Disability’s Response to The UK Civil Aviation Authority Questions For The Review of Operation of The EU
Regulation On Air Passenger Rights, 11 p., UK.
http://www.caa.co.uk/docs/5/ergdocs/PRMLCD.pdf
[28] LCD2 (Leonard Cheshire Disability) (2009. December 02).
Disabled People’s Experiences of Air Travel, 16 p., United
Kingdom. Available: www.lcdisability.org/download.php?id=847
[29] Lee C.H., 2007, “Improving classification performance using
unlabeled data: Naive Bayesian case,” Knowledge Based Systems 20 (3) ,220–224.
[30] Lin S-C., 2006, “A fuzzy Bayesian model based semi-automated
task analysis,” ETD Collection for Purdue University.
[31] Nadkarni S., Shenoy P.P.,2004, “A causal mapping approach to
constructing Bayesian networks,” Decision Support Systems 38, 259–281.
[32] Nguyen, S-T. (2006) Advanced Bayesian Neural Network
Classifiers of Head-movement Directions for Severely Disabled People, Dissertation, University of Technology, Sydney.
[33] OAEP (Office of Aviation Enforcement and Proceedings). (2009,
September 20). Air Travel Consumer Reports for 2009, 2008,
2007, 2006, 2005, 2004, 2003, Available:
http://airconsumer.ost.dot.gov/reports
[34] Ostrowski P., O’brien T.V., Gordon G.L., 1993, “Service quality
and customer loyalty in the commercial airline industry,” Journal of Travel Research, 32(2), 16–24.
[35] Parasuraman A., Zeithaml V. & Berry L. 1985, A conceptual
model of service quality and its implications for future research, Journal of Marketing, 49, 41-50.
[36] Park, J-W. 2007. “Passenger perceptions of service quality: Korean
and Australian case studies”, Journal of Air Transport Management, 13 (4) 238-242.
[37] REG, 2006. Regulatıon (ec) no 1107/2006 of the European
Parliament and of The Council of 5 July 2006 concerning the rights of disabled persons and persons with reduced mobility when travelling by air, 9p., Strasbourg.
[38] REGULATION (EC). 2004. The European Parliament And Of The
Council, Official Journal of the European Union, 7 p., Strasbourg
http://eurlex.europa.eu/LexUriServ/LexUriServ.do?uri=OJ:L:2004 :046:0001:0007: EN:PDF (2009, October 15).
[39] Schmidberger, S. Bals, L. Hartmann, E. Christopher E.J., 2009,
“Ground handling services at European hub airports: Development of a performance measurement system for benchmarking”, International Journal of Production Economics 117, 104–116.
[40] Ulengin F, Sahin S.O. Ulengin B., 2006, “Using neural networks
and cognitive mapping in scenario analysis: the case of Turkey’s inflation dynamics,” European Journal of Operational Research 158, 124–145.
[41] Schmidberger, S. Bals, L., Hartman E. Jahns, C. 2009. “Ground
handling services at European hubairports: Development of a performance measurement system for benchmarking” International Journal of Production Economics 117, 104–116.
[42] Siau K., Tan X., 2005, “Improving the quality of conceptual
modelling using cognitive mapping techniques,” Data and Knowledge Engineering 55, 343–365.
[43] Shon J.Z., Chen Y., Chiou Y., 2008, “ Examining low cost carrier
service quality in china market,” Air Transport Research Society World Conference, Atina.
[44] Trucco P., Cagno E., Ruggeri F., Grande O., 2008, “A Bayesian
belief network modelling of organisational factors in risk analysis: a case study in maritime transportation,” Reliability Engineering and System Safety 93, 823–834.
[45] Truitt L., Haynes R., 1994, “Evaluating service quality and
productivity in the regional airline industry,” Transportation Journal, 33(4), 21–32.
[46] Tsaur S., Chang T., Yen C., 2002, “The evaluation of airline
service quality by fuzzy MCDM,” Tourism Management, 23(2), 107–115.
[47] Ulengin F., Onsel S., Topcu Y.I., Aktas E., Kabak O., 2007, “An
integrated transportation decision support system for transportation policy decisions: the case of Turkey,” Transportation Research Part A 41, 80–97.
[48] UN1. 2008 Convention on the Rights of Persons with Disabilities,
United Nations, New York.
http://www.un.org/disabilities/convention/conventionfull.shtml (2010, April 09).
[49] Xiao, J. He,C. Jiang,X. 2009. “ Structure identification of
Bayesian classifiers based on GMDH”, Knowledge Based Systems 22 (6) , 461.
[50] Yuan X-M , Lowb J.M.W., Tang L.C., 2010, “Roles Of The
Airport And Logistics Services On The Conomic Outcomes Of An Air Cargo Supply Chain”, Int. J. Production Economics 127, 215– 225.
[51] Zhang A. , Fu X., Yang H., 2010, “Revenue Sharing With
![Table 1. Ratio of Delay Reasons [16]](https://thumb-us.123doks.com/thumbv2/123dok_us/1289698.658037/3.595.46.247.66.155/table-ratio-delay-reasons.webp)