Abstract— Novice programmers are having a difficult time writing their first programs and instructors handling a programming class with a large population are also having difficulties in monitoring every student’s activity. One way to address this is to develop a tool that can help instructors monitor students’ negative affects such that these instructors can easily determine students who need attention and guidance. This study established a model that is used in the development of an affective intelligent agent that can determine two negative affect states of students while making a program in C++, namely, confused and boredom. The model was established through the gathered key log data from novice C++ programmers. Processing these data through a data mining tool called WEKA, some patterns in detecting the affect states of these programmers were discovered. On the other hand, the affective intelligent agent can be used to improve monitoring student’s attitude towards programming by alerting the teacher whenever the agent detects sign of boredom or confusion from the students.
Index Terms— affective computing, affect state, intelligent agent, key logs, model, novice programmers
I. INTRODUCTION
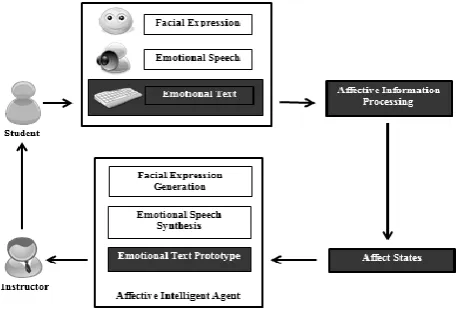
earning is very essential in the growth and development of an individual. In the process of learning, affect plays a significant role in motivating students to logically think and effectively respond to assessment. Affect is also critical on how students interact and relate within a classroom or laboratory setting where it can greatly influence student’s learning process. Through students’ speech, facial expression and keys pressed (Fig. 1) can convey crucial information in determining student’s affect state. Once the
Manuscript received December 8, 2011; revised January 25, 2012. This manuscript will also be submitted for presentation in the forthcoming 12th Philippine Computing Science Congress (PCSC 2012), organized by the Computing Society of the Philippines, on March 1-3, 2012 at the De La Salle – Canlubang, Biñan, Laguna, Philippines.
D. A. M. Felipe is a senior Bachelor of Science in Computer Science student of Mapua Institute of Technology, Makati City, Philippines (e-mail: [email protected]).
K. I. N. Gutierrez just graduated in Bachelor of Science in Computer Science at Mapua Institute of Technology, Makati City, Philippines (e-mail: [email protected]).
E. C. M. Quiros just graduated in Bachelor of Science in Computer Science at Mapua Institute of Technology, Makati City, Philippines (e-mail: [email protected]).
L. A. Vea is a faculty and currently the Course Coordinator in Computer Science of the School of Information Technology, Mapua Institute of Technology, Makati City, Philippines. (e-mail: [email protected]).
[image:1.595.313.544.257.414.2]affect state, specifically a negative affect is detected from a student, teachers may improve learning by giving attention to that student.
Fig. 1. Affective Monitoring Model
Our study aims to define variables and collect data in detecting affect states of confusion and boredom. Specifically, to establish a model that can process these two negative affect states and to develop a prototype that can validate the process model and demonstrate affective analysis through key logs.
Though our study is limited only to the determination of affect states through emotional text (Fig. 1), we believe that this study could help in the long research of developing an affective intelligent agent that can detect affect states not only through emotional text but also by means of facial expressions and emotional speech [3] ( Fig.1). Through the agent, there can be improvement in instructor-students interaction by detecting the negative affect of each student and alerting the instructor. In this way, the instructor will be informed who among the students are not focused in the programming activity or may be out of track.
II. REVIEW OF RELATED LITERATURE
A. Affect States
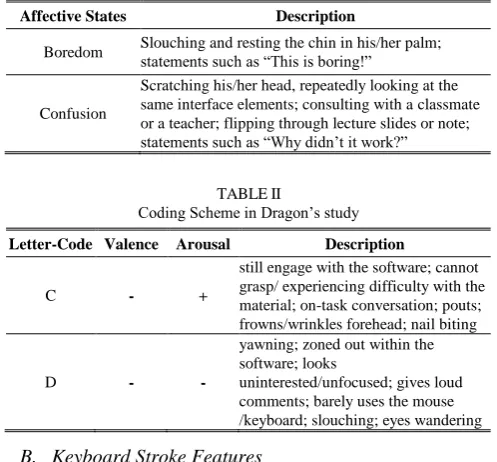
Affect usually refers to emotions. A number of studies looked at the affective domain in learning programming. In the study of [4], [5] and [16] discovered affect states, coding scheme and how to detect these in students while programming. Table I shows two negative affect states [4]
Towards the Development of Intelligent Agent
for Novice C/C++ Programmers through
Affective Analysis of Event Logs
Daniel Andrew M. Felipe, Kim Ivan N. Gutierrez, Eilynn Charm M. Quiros, and Larry A. Vea
whereas Table II shows the coding scheme created by [5]. These were the schemes used to identify students’ affect state during their programming session.
TABLEI
The Two Negative Affect States in Rodrigo’s study
Affective States Description
Boredom Slouching and resting the chin in his/her palm; statements such as “This is boring!”
Confusion
Scratching his/her head, repeatedly looking at the same interface elements; consulting with a classmate or a teacher; flipping through lecture slides or note; statements such as “Why didn’t it work?”
TABLEII
Coding Scheme in Dragon’s study
Letter-Code Valence Arousal Description
C - +
still engage with the software; cannot grasp/ experiencing difficulty with the material; on-task conversation; pouts; frowns/wrinkles forehead; nail biting
D - -
yawning; zoned out within the software; looks
uninterested/unfocused; gives loud comments; barely uses the mouse /keyboard; slouching; eyes wandering
B. Keyboard Stroke Features
To facilitate in creating the criteria for keyboard strokes in detecting affect states, a study of [6] presented seven features that dictates affect in keystrokes such as typing speed, typing mean, typing variance, typing standard deviation, idle time, total time taken for typing and number of backspaces.
C. Error-Quotient (EQ)
The online protocol analysis and error-quotient measure can be used to increase the effectiveness of the affect model in determining negative affect states of confusion and boredom [2]. EQ is a quantification of the student’s compilation behavior through a grounded theoretic process. It characterizes how much or how little a student struggles with syntax errors while programming which ranges from 0 to 1. Students who encountered many syntax errors and unsuccessful in fixing them from one compilation to the next will get a high error quotient. While students who have few syntax errors, or who correct their syntax errors quickly will result to a low error quotient. A score of 0 means that the student did not encounter the same syntax error on two successive compilations of their program, while a score of 1 means that every compilation resulted to the same syntax error. This is done by computing the EQ score [2] in the process stated in Fig 2 and Fig. 3.
[image:2.595.308.547.56.183.2]
Fig. 2. Steps to compute for the EQ score.
Fig. 3. EQ Algorithm Flowchart.
III. THEORETICAL FRAMEWORK
Motivation has to do with students' desire to participate in the learning process [7]. A student may arrive in class with a certain degree of motivation, however, the teacher's behavior and teaching styles have a great influence on the student’s motivation [8]. The affective component of motivation has a strong influence on the willingness of a student to engage in learning their first program [9]. So in order to motivate the learner, a positive affect must be possessed because it can be a guiding force in perception and attention [10]. Many studies support the claim that affect plays a critical role in decision-making and learning performance as it influences the cognitive process [11]. For example, students with negative affect such as confused and bored do not learn and absorb information efficiently or deal with it very well [12].
The field of affective computing is concerned with understanding and recognizing human emotions in computer systems. With the help of this field, educators can now monitor student’s behavior and affect states while doing programming tasks. It helps educators to easily identify students who require immediate attention from the instructor. The identification of the affect states observed on novice programmers can be categorized as positive or negative based on how these states influence the programming of students. Thus, negative affect states, particularly boredom and confusion seriously influence the students’ learning progression by driving them out of track [4]. A coding scheme of affect states, which is simply a list of observed affect states and their manifestations, help in the process of identifying affect via rule-based classification. Through the development of an intelligent agent, these affect states that arise during programming can be identified and sent to the instructor’s terminal to alert the instructor that the student is bored or confused and needs an immediate attention.
In order to implement the intelligent agent, experimental method can be used to gather data composed of key logs (low fidelity data), and videos and real-time observations of upper body expressions (high fidelity data). Compilation logs, comprised of chronologically-placed build events, are the source for data needed to compute the EQ score of an observed programming student. The EQ score identifies these programmers if they are either at-risk or not and the score may show the differences of how affect is exhibited in novice programmers. These two types of data fidelity will be trained and tested for model development. The model can be Given a session of build events e1 through en:
1. Collate: Create consecutive pairs from the build events in the session. For example: (e1, e2), (e2, e3), ..., (en-1, en).
2. Calculate: Score each pair according to the algorithm presented in Fig. 3.
3. Normalize: Divide the score assigned to each pair by 9 (the maximum value possible for each pair).
[image:2.595.44.293.122.353.2]developed using a data mining tool. Data mining can be used to discover meaningful, new and hidden correlations, patterns and trends through a decision tree which is formed with the use of tree-based algorithms such as J48, BF Tree and Random Tree algorithm. Patterns discovered through the decision trees can now be stored in the constructed GSP database to be able to use in the prototype.
IV. METHODOLOGY
We conducted the study in the School of Information Technology of the Mapua Institute of Technology on the Fourth Term of Academic Year 2010-2011. The subjects of this study are the first year and second year students enrolled in CS126 (C++ Programming 1) taking up BS in Computer Science and BS in Information Technology. A total of 6 students agreed to participate, 4 were male and 2 were female. It was conducted in a CS126 laboratory room. All computers were installed with the same MS Windows 7 Operating System, MS Visual Studio 6.0, and are controlled by a Classroom Management System called NetSupport.
A. Preparation
To ensure the assistance of the school authorities and parents of the participants to the implementation of the study, consent letters were made to obtain permission to subject the students in the experiment, to request assistance in the installation of the data gathering tools, and to ask for the parent’s consent to let their dependents join the experiment. In parallel with this, a survey intended to identify the potential participants for the experiment that manifest the following demographic criteria: (1) a Filipino citizen; (2) a first/second year student, regardless of age, and; (3) should have no background in C/C++ since high school.
On the other hand, we developed software tools such as the Key Logger [14] and the File Watcher program. The Key Logger records all the key logs of the students while the File Watcher program collects every build logs of the students in order to compute for their Error-Quotient for competency analysis. In addition, Webcams were also used to capture video logs for the high fidelity data.
B. Data Gathering
At the start of each session, Key Logger and File Watcher programs were turned on and Video capture software was set to recording state. In the experiment sessions, the students used the Microsoft Visual C++ 6.0 IDE to solve basic programming problems concerning conditional statements, loops and functions. The participants were seated on the terminals assigned by the professor to eliminate things that may affect their emotions. Internet access and other software applications are also controlled by NetSupport to ensure prohibitions of unnecessary software.
When students begin their machine exercises, one of us took note of the start time. The duration of the experiment was determined on how long the professor will let the students solve the exercise which ranges 1.5 hour to 3.0 hours. During the entire session, we watched quietly at the back so that the students will not be disturbed.
The low fidelity data was gathered through the Key Logger program which recorded every key stroke that the student had done which included the keys pressed and the time pressed and released. These key logs are saved as Comma Separated Value (CSV) file. In parallel with the data gathering of the low fidelity data, video was also captured via webcam. This is the high fidelity data of the research. The video captured facial expressions and actions of the students throughout the session. In addition, the competency of each student was also analyzed by their build logs recorded using the File Watcher program.
At the end of each session, start time and end time of the collected data files (the key log files, video and build logs) were noted. Collection of data was done in 3 sessions for each of the 2 classes. Altogether, the data collected from the experiment had 18 recordings.
C. Pre-processing
After the data collection from the experiments, eighteen 18 key log files, 18 video files and a number of compilation logs per student were taken to pre-processing.
For the low fidelity data, the key log files gathered from the experiment was processed through a program called, Pre-Processing Tool which is created in Microsoft Visual C# 2008. This tool produced an output file consisting of a collection of unique twenty-second segment mappings of the 8 features based on [6] such as the typing speed, typing mean, typing variance, typing standard deviation, idle time, total time taken for typing, and the number of backspaces pressed, including the additional time frame that will be used as an index. These features were computed in the following formula stated in Table III.
TABLEIII Formulas for Typing Features
Typing Speed
Typing Mean
Typing Variance
Typing Standard Deviation
Idle Time
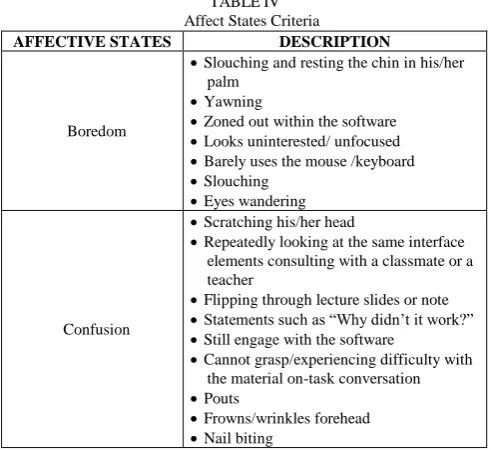
After pre-processing of the low and high fidelity data, data annotation took place. Data annotation is where the high fidelity observation that has the same 20-second time frame with a low fidelity incomplete mapping was appended with each other. This was done by pairing the 20-second time frame in the low fidelity incomplete mapping and it is the same 20-second time frame in the high fidelity (video). After pairing the two data fidelity, the observation found in the video was processed through the modified coding scheme based on [4] and presented in Table 4 to identify the affect that influence the student while programming.
TABLEIV Affect States Criteria
AFFECTIVE STATES DESCRIPTION
Boredom
Slouching and resting the chin in his/her palm
Yawning
Zoned out within the software
Looks uninterested/ unfocused
Barely uses the mouse /keyboard
Slouching
Eyes wandering
Confusion
Scratching his/her head
Repeatedly looking at the same interface elements consulting with a classmate or a teacher
Flipping through lecture slides or note
Statements such as “Why didn’t it work?”
Still engage with the software
Cannot grasp/experiencing difficulty with the material on-task conversation
Pouts
Frowns/wrinkles forehead
Nail biting
The scheme was modified to find the state of confusion (negative valence, positive arousal) or boredom (negative valence, negative arousal) and a special emotion state of “others” which was exclusive to the study. The “others” state was made under the premise that the emotion with respect to the time frame was found to be neither confused nor bored.
Data annotation was done simultaneously with the other researchers to form an affect observation in the videos. Every one of us classifies the emotion for a specific time frame and each observation was compared. If different affect observations were observed, we have to replay and must agree in one emotion.
The affect state identified from the scheme and agreed upon by us was appended to the incomplete mapping of the low fidelity. This resulted to a complete mapping of low fidelity values with its accompanying affective state.
On the other hand, compilation build logs gathered from the previous phase along with their file information were collated into an MS Excel file and every build was considered an instance for said file [2]. These logs were also processed in Fig. 2. To calculate the error quotient of a session, each pair of events is first scored using the algorithm [2] presented in Fig. 3 and these values are then summed and normalized, assuming a maximum score of 9 per pair.
For instance, a student incurred a total of n-builds during his or her programming session. From there, (n-1) pairs of the n builds were created. Applying the EQ algorithm for the
first pair, if both builds reported errors then 2 will be added to the EQ score. Next, if both builds encountered the same error of a missing semicolon then, this constitutes a same error type problem so 3 were added to the EQ score. After that, if the same error was found in the same line for both builds which represents a same error location problem then another 3 was added to the score. However, if the edit were found on same lines then 1 was added to the score. The sum yielded by the first pair was divided by 9 to get its partial score. This was done simultaneously for the next pairs to provide their partial scores. After computing the partial score for every pair, the average then calculated and this identified the error quotient score of this student.
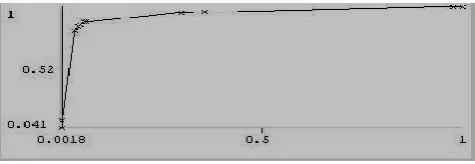
[image:4.595.46.292.200.425.2]The average score of EQ for every session was tested by the Error Quotient (EQ) score criteria created for this study. In the statistical data provided by [2], it showed that scores that ranged from 0 to 0.3 received a good score on their midterm exams. Clustering this using the one-dimensional Euclidean distance between the midpoints of the score ranges in our data shown in Fig. 4, identifies two clusters or competencies that will identify the EQ score criteria. In this particular criterion, scores that range from 0.1 – 0.2 and lower were considered competent while higher scores were considered incompetent. In this experiment, 2 out of 6 students were considered competent while the remaining 4 were incompetent.
Fig. 4. Distribution of Average EQ Scores
After determining the competency of each student, the dataset were divided into 2 CSV files based on the competencies associated with them. Most classifiers are sensitive to the sequence the data arrived in. If for example, the first part of the dataset primarily consists of one particular class label, then the other parts of the dataset may be misrepresented if they go by another class label. This is particularly fatal if the classifier is undergoing a percentage split [14]. Therefore, the students’ instances were alternately added to their corresponding dataset to prevent the biases in the model development. For the dataset of the competent students, the total number of instances was 1502 while for the dataset of the incompetent students, the total number of instances was one 1501. Then, the 2 datasets were combined in a single CSV file to produce a total of 3003 mappings disregarding the competency attribute.
D. Model Development
[image:4.595.303.516.387.504.2]dataset. To ensure that the best-fitted classification algorithm is used, algorithms such as J48, Random Tree, and BF Tree were tried by the following criteria: highest (1) Kappa Statistic, (2) recognition rate, and (3) correctly classified instances. The dataset with the records of the competent students were used as a sample data to determine the best-fitted classification algorithm that will be used in creating all the models.
After developing the 2 models identifying competency of students, the third dataset which is the combined datasets of the previous 2 were also developed to become a model. This is done for the development of the prototype and for the general statements of the new patterns discovered.
E. GSP Database Construction and Prototyping
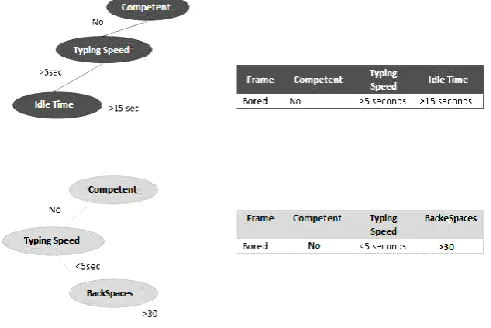
[image:5.595.308.549.360.438.2]After the model was tested to be accurate with the use of statistical analysis mentioned earlier, the decision trees were used to create the GSP (Goals, Standards, and Preferences) database of the model. The GSP database was used in creating the prototype and in deciding which affective state does the student exhibit. GSP Database Construction was done by extracting the unique paths from the decision trees found in the unified model and putting it into a self-containing frame called a construal frame (Fig. 5).
Fig. 5. GSP Database Construction
After constructing the GSP database, we developed a prototype using Microsoft Visual C# 2008. It has four modules operating in succession such as the key logger, the pre-processing tool, the GSP database, and the affect result. The key logger module records the actual keystrokes and their time of pressing while; the pre-processing module translates these keystrokes into an incomplete mapping then; the GSP database module provides the affective state according to the data supplied by the incomplete mapping and; the affect result module provides feedback to the user in the form of message and image.
V. RESULTS AND DISCUSSION
In order to acquire the best-fitted classification algorithm appropriate for this study, the following algorithms were tested: Random Tree, BF Tree and J48 Algorithm. To test these, the dataset containing the records of the competent
students was used. The dataset contains 1502 instances which are identified as the total number of instances that the classifier used in testing the model. The criteria in choosing the best-fitted algorithm used in this study is the statistical measures produced by WEKA such as the following: (1) Correctly Classified Instances which is the number of instances that the classifier was able to predict correctly; (2) Recognition Rate which is the percentage of correctly classified instances to the total number of instances and; (3) Kappa statistic which is a more reliable measure of model performance as it takes account of agreement by chance, a given when not doing a singular annotation. Cohen’s kappa or the Kappa statistic in this study is an agreement measure between the predicted, as done by the classifier, and the actual classes which in turn are subject to the probability of an instance of the actual class turning up in a dataset. A kappa statistic of 1 represents a perfect agreement while a 0 represents all agreements as conflicting prevalent to annotation done purely by chance. This measure is commonly used in purely categorical data which the study is using.
TABLEV
Statistical Measures for Model Performance using various tree-based classification algorithms for the draft data on competent programmer
affective states
Table V shows the statistical measures for the 3 algorithms tested and among these, the J48 algorithm works best with this object domain with a correctly classified instances of 1432 out of 1502 total number of instances, recognition rate of 95.79% and a Kappa statistic of 0.9262. The high recognition rate of J48 means that the model performed a good classification of the test instances and the high Kappa statistic means that the model provides a cohesive agreement of prediction with the class. With this result, the J48 algorithm was chosen in developing the models.
After testing the performance of the 3 classification algorithms, the 2 datasets that distinguishes the competency of the students were also fed into WEKA to develop the other models. Using 70% training and 30% test set up, WEKA also analyzed the model developed by statistical accuracy measures presented in the classifier output field. Before the statistical analysis, here are some terms that needed to be defined: (1) True positives are the desired outcomes of the model which is tested by the classification algorithm; (2) False positives are the erroneous judgments of a particular instance thinking that it is the desired class but it is not and; (3) False negatives are the incorrect predictions of a test thinking of a particular instance is not of the desired class label but in truth it is. And to further discuss the model’s accuracy performance, here are the statistical measures produced by WEKA: (1) TP Rate (True Positive
Tree Based Classification
Algorithms
Total Number Of
Instances
Correctly Classified Instances
Recognition Rate Kappa Statistics
Random Tree 1502 1419 94.74% 0.8546
BF Tree 1502 1428 95.07% 0.8690
[image:5.595.47.293.361.525.2]Rate) indicates the degree of true positives being found by the model; (2) FP Rate (False Positive Rate) indicates the degree of false positives being found by the model; (3) Precision is a measure of exactness and it is derived from the number of true positives and false positives found in this classification test. A high precision can be easily achieved by limiting the observed number of instances; (4) Recall is a measure of completeness or the ability of the model to treat instances as relevant to a test and it is derived from the number of true positives and false negatives in a classification test. A high recall can be received by testing all the instances; (5) F-measure combines the precision and recall rates of the model to produce a more general measure of classification performance; (6) ROC area is the area under a line graph comparison between true positives and false positives and is equal to the probability that it will rank a true positive instance higher than a false one. For the competent model, it is taken from the 1051 data instances out of 1502 while the remaining instances will be reserved for the test set which are around 451 instances. For the incompetent model, it is taken from the 1052 data instances out of 1501 while the remaining instances will be reserved for the test set which are around 449 instances. Table VI shows the detailed accuracy by class of the competency models.
TABLEVI
Detailed Accuracy by Class of the Competency Models (test set)
Competency Detailed Accuracy By Class
Competent TP Rate FP Rate Precision Recall F-Measure ROC Area 0.958 0.021 0.959 0.958 0.958 0.976
Incompetent
0.971 0.032 0.949 0.971 0.96 0.972 0.856 0.061 0.809 0.856 0.832 0.916 0.85 0.058 0.902 0.85 0.875 0.924 0.898 0.049 0.898 0.898 0.897 0.940
The range of the following measures in the table above is 0 -1. It is also shown in the table that the high TP Rates of both models (0.958 and 0.898) indicate that the model correctly expresses which affect state should be exhibited from the features provided while the low FP rates of both models (0.021 and 0.049) implies that the model correctly states when not affect others from the features provided while; the high precision rate (0.959 and 0.898) indicates that the model rarely misclassify an actual instance then; the high recall rate (0.958 and 0.898) indicates that the model knows when not to classify an instance as incorrect and; the high F-measure (0.958 and 0.897) means that the relationship between precision and recall is harmonious and lastly; having a large ROC area (0.976 and 0.94) correlates to a model being accurate at classification and being chance-corrected and sensitive to class distribution.
Another gauge in measuring the effectiveness of the model is the confusion matrix. It is a visual tool in determining how well the performance of the classifier is on a given set of data. The rows represent the actual data while the columns represent the classifiers prediction that should be the same with the actual data. Meeting cells from the same row and column headers represent correct predictions
while meeting cells of different row and column headers represent incorrect ones. In Table VII, the confusion matrices of the two competency models show that the models are efficient in predicting affect states of the novice programmer.
TABLEVII
Confusion Matrices for the affective states on both competency models (test set)
Competency Confusion Matrix
Competent
a b c <-- classified as 137 10 2 | a = others 2 92 5 | b = confused 0 0 203 | c = bored
Incompetent
a b c <-- classified as 167 2 3 | a = bored 2 89 13 | b = confused 7 19 147 | c = others
For instance on the competent model, the diagonal {137, 92, 203} represent the true positives of the classification while the non-diagonal values {10, 2, 2, 5, 0, 0} represent the false positives of the classification. With the matrix presenting large values in the diagonal in comparison to the values not found in the diagonal, there are a greater number of true positives than the false positives; it means that the model is an accurate classifier. This also holds true for the incompetent model as its matrix is similar in makeup to the competent one.
Since the class variable is nominal, the effectiveness of the models from the summary on the classifier output window in WEKA was also shown. Other statistical measures on the model performance are the correctly classified instances, incorrectly classified instances as well as their percentages in relation to the total number of instances. In Table VIII, it presented the summary output of both competency models. With a high correctly classified instance and a low incorrectly classified instance rates, the model performance shows its initial measure while having a high Kappa statistic means that the model will still perform well even if test instances are made in chance.
TABLEVIII
Summary Table data for both competency models (test set)
Competency
Correctly Classified Instances
Incorrectly Classified Instances
(%) of Correctly Classified Instances
(%) of Incorrectly Classified
Instances Kappa Statistic
Competent 432 19 95.7871% 4.2129% 0.9341
Incompetent 403 46 89.755% 10.245% 0.8432
(a) Curve for the class “others” on the “Competent” model
[image:7.595.305.543.49.131.2]{b) Curve for the class “others” on the “Incompetent” model
Fig. 6. ROC Curves for Competency Models
For the unified model, it is taken from the 2103 data instances out of 3003 while the remaining instances will be reserved for the test set which are around 900 instances. The unified model exhibits the following performance measurements presented in Table IX.
TABLE IX
Detailed Accuracy by Class of the Unified Model (test set) TP Rate FP Rate Precision Recall F-Measure ROC Area
0.878 0.059 0.901 0.878 0.89 0.937 0.98 0.036 0.944 0.98 0.962 0.971 0.833 0.045 0.85 0.833 0.841 0.932 0.907 0.047 0.906 0.907 0.906 0.949
Table IX, shows that the TP Rate, FP Rate, Precision Rate, Recall Rate, F-measure, and ROC Area have lower values in comparison to the competency and incompetency model performance scores. The combination of the instances had introduced a noticeable amount of noise in training the model and that somewhat lowered the performance of the model.
[image:7.595.44.287.50.129.2]The confusion matrix for the unified model shown in Table X, means that even with the noise introduction, the model is once again efficient in predicting affect states of novice programmers.
TABLE X
(a)Confusion Matrix for the Affective States on the Unified Model (test set)
Predicted
Others Bored Confused
Actual
Others 302 13 29
Bored 5 339 2
Confused 28 7 175
(b) Summary Table data for the unified model (test set)
Correctly Classified Instances
Incorrectly Classified Instances
(%) Of Correctly Classified Instances
(%) Of Incorrectly
Classified Instances
Kappa Statisti
c
816 84 90.6667% 9.3333% 0.8566
In Fig, 7, the ROC curve for the class of others on the unified model is presented. According to the curve, the model is sensitive to change criterion and avoid random guessing.
Fig. 7. ROC Curve for the Class “Others” on the Unified Model
A. Discovery of New Patterns
[image:7.595.45.286.154.233.2]With the data from the decision trees, a deterministic model was constructed. It is basically a rudimentary set of rules accessed in order according to the values of the feature variables derived in keyboard strokes found in novice programmers programming in C/C++. The new patterns discovered were shown in Table XI.
TABLE XI
New Patterns Discovered of Student’s Affect via the Notable Features
Affect Competent Incompetent
Bored (idle time == 20) && (backspaces == 0) Confused (backspaces >idle time)
(idle time >11 && backspace == 0)
(idle time > 9) && (backspace == 0)
Others (backspaces < idle time) (idle time < =11) && (backspaces == 0)
VI. CONCLUSION
From the experiment, the data analysis, and performance testing of the models, it has been found that key logs can provide adequate data to determine affect in novice programmers. Key logs produce features in typing present affect analyzers with acceptable data. From these logs, the models that have been developed were accurate and evidence to this is the model performance measures done.
It was also found out that the dominant typing features in the analysis are the idle time and the number of backspaces pressed. As shown in Table XI, the number of backspaces pressed feature is used to differentiate the affect “confused” with the additional affect for this study, “others”. The idle time, on the other hand, has a great degree of pull when it comes to labeling affect states. It is used to detect the affect “boredom” and it correlates with the number of backspaces pressed feature for all the affect states. With this, the models have been accurate in determining affect states in respect to the model performance measures.
Looking over the accuracy rate for the 3 models, the model for competent with a rate of 95.79%, the model for incompetent with 89.67%, and the unified model with 90.67%, these rates have definitely attained and surpassed the 80% hypothetical rate of the study. Inter-agreement reliability can be found in the Kappa statistic of the three models. This is presented through the fact that the model for competent has a value of 0.9341, the model for incompetent has a value of 0.8432 and the unified model has a value of 0.8566 Kappa statistics. This also means that the models have a less chance of having a wrong classification when compared to the same observation done by another model of similar construction.
[image:7.595.306.547.272.359.2] [image:7.595.49.289.588.726.2]participated in the study and this is the first time to conduct experiments like this using our school resources; it is recommended that further investigation must be conducted to conclude the relevance of our method. That is, by having larger sample that may include other students.
Lastly, the software prototype of the affective intelligent agent using the model should be tested not only to novice programmers but also to other students having programming laboratory classes.
ACKNOWLEDGMENT
This research would not have been possible without the inspiration, guidance and help of several individuals who in one way or another contributed and extended their valuable assistance in the preparation and completion of this study. To our mentors, Dr. Ma Mercedez Rodrigo and Dr. Proceso Fernandez Jr who inspired us in the field of Affective Computing and Data Mining respectively, to Dean Nilda Eliquen of the School of Information Technology for her moral support and steadfast encouragement to accomplish this study, to the Development Office for Information Technology for their assistance in installing our data gathering tools in the laboratories, and to CS126 students who actively participated in the study.
REFERENCES
[1] A.R. Wight. Toward a Definition of Affect in Education. Interstate Educational Resource Service Center, Salt Lake City, Utah, 1972. [2] E. S. Tabanao, M. M. T. Rodrigo, and M .C. Jadud. Identifying
At-Risk Novice Java Programmer Through the Analysis of Online Protocols. 2008.
[3] Mao, Xia and Li, Zheng. Agent based affective tutoring systems: A pilot study. Computers and Education, 505. 204. 2010.
[4] M. M. T. Rodrigo, R. S. Baker, M. C. Jadud, A. C. M. Amarra, T. Dy, M.B.V., Lim, S. A. L. Espejo-Lahoz, S. A. M. S. Pasuca, J. O. Sugay, and E. S. Tabanao. Affective and Behavioral Predictors of Novice Programmer Achievement. 2009
[5] T. Dragon, I. Arroyo, B. P. Woolf, W. Burleson, R. Kaliouby, and H. Eydgahi. Viewing Student Affect and Learning through Classroom Observation and Physical Sensor. ITS ’08 Proceedings of the 9th international conference on Intelligent Tutoring System. 2008 [6] P. Khanna and M. Sasikumar. Recognising Emotions from Keyboard
Stroke Patterns. International Journal for Computing Application.11(9). 2010.
[7] Student Motivation to Learn. ERIC Clearinghouse on Education Management:
http://www.kidsource.com/kidsource/content2/Student_Motivatation. html
[8] K. B. Kirk. Motivating Students, 2011. On the Cutting Edge – Professional Development for Geoscience
Faculty:http://serc.carleton.edu/NAGTWorkshops/affective/motivatio n.html
[9] E. Vockel, Ph.D. Affective Components of Motivation. Educational Psychology – A Practical Approach:
http://education.calumet.purdue.edu/vockell/edPsybook/Edpsy5/Edps y5_affective.htm
[10] C. Izard. Four Systems for Emotion Activation: Cognitive and Non-cognitive Processes. Psychological Review, 100 (1), 68-90, 1993. [11] E. Kinard. Perceived and Actual Academic Competence in
Maltreated Children. Child Abuse and Neglect, 25 (1), 33-45. [12] D. Goleman. Emotional Intelligence .Bantam Books, New York,
2000.
[13] A. Yüksektepe and N. Russler. Superkeylogger, 2011. Whitebyte: http://www.whitebyte.info/projects/superkeylogger.
[14] Preserving order in split leads to Inferior results - Why?, 2008. Wekalist Mailing List:
https://list.scms.waikato.ac.nz/pipermail/wekalist/2008-February/012603.html