Abstract
For many years brands make use of the power of metaphors. Think of a feather that expresses lightness, or placing items on top to give it more power. It is a strong and attractive technique to communicate a product attribute. At least, that is currently assumed, but the effects and influence are still quite uncertain because too little research has been conducted on this topic. Currently many brand use metaphors intuitively, but are not certain of its effects. This study tests what a metaphor of strength, namely placing an image of a lion on a coffee pack, can do for the tasting experience. The focus of this study lies on the effects of the use of a metaphor, its spatial positioning and a direct text claim on a coffee packaging and how it will influence the product experience and evaluation. This study uses a 2 (text claim vs. no text claim) x 3 (no metaphor vs. metaphor up located vs. metaphor down located) experimental design. This study shows that a visual metaphor can be an appealing and effective option to communicate a product attribute, but more interestingly that placing a metaphor on the bottom of the package can be seen as a metaphor for a stronger and more intense taste through the concept of
Table of contents
1 Abstract 3
2 Introduction 7
3 Theoretical framework 9
3.1 Influence of packaging 9
3.2 Taste experience 9
3.3 Metaphors 10
3.4 Verbal cues 13
3.5 Mediators 13
3.6 Research design 14
4 Pre study 15
4.1 Focus group 15
4.2 Design of the focus group 15
4.3 Important findings 16
5 Main study 17
5.1 Stimuli and design 17
5.2 Participants 18
5.3 Coffee consumption 19
5.4 Procedure 20
5.5 Measurement instruments 21
5.6 Reliability 22
6 Results 25
6.1 Metaphor effects 25
6.2 Text claim effects 27
6.3 Interaction effects 27
6.4 Regression analysis 28
6.5 Overview of hypotheses 29
7 Discussion 31
7.1 Discussion of results 31
7.2 Implications 34
6
7.4 Conclusion 36
Reference list 39
Appendices 43
Appendix A – Questions pre study 44
Appendix B – Images pre study 46
Appendix C – Stimuli main study 47
Appendix D – Questions main study 49
1
Introduction
The influence of packaging design remains a popular research topic in consumer behaviour. This is not surprising since many consumers often base their decisions on the aesthetic product design (Creusen & Schoormans, 2005). The consumer prefers the more attractive packaging or chooses the packaging that is most clear in communicating its benefits when the consumer is in a hurry. The design elements of a packaging can express the characteristics of a product, which can determine which product is the right one for the consumer. A packaging even has the power to create specific expectations and illusions that change the product experience and evaluation (Becker, Van Rompay, Schifferstein, & Galetzka, 2011; Lee, Frederick & Ariely, 2006).
Manipulated elements in packaging design often involve the material, colour or shape of a product. Another strategy in communicating a product attribute or quality can be to make use of metaphors. Research already shows the success of metaphors and how they have the power to create a specific product experience via visual metaphors (Forceville, 2002; Karnal, Machiels, Orth & Mai, 2016) or through the use of visual spatial positions (Sundar & Noseworthy, 2014; Van Rompay, de Vries, Bontekoe & Tanja‐Dijkstra, 2012).
Many brands already make use of metaphors, but in fact little is known about the effects of metaphors. Expressing a product attribute through design is not always an easy job because it can be interpreted completely wrong. Especially for elements that are hard to define and open to interpretation it is of importance to know that the triggered associations are the right
associations for that product. It is possible that the consumer understands the meaning of a packaging completely wrong when shopping in an overcrowded supermarket, where also many consumers decide under time pressure. Knowing which effects certain packaging elements have on the consumer can increase the product evaluation and purchase intention. Especially for visual metaphors the chance exists that the image does not portray the right meaning, is not represented clearly enough or is too difficult to be interpreted by the consumer (McQuarrie & Phillips, 2005).
8 This study aims at providing more insights into the use of metaphors, its visual spatial position and text claims on coffee packages and how the customer evaluates them. Therefore this study focuses on giving an answer to the main research question:
2
Theoretical framework
The theoretical framework provides insights in the relevant topics of the research design. The text gives an overview of the excising and relevant literature available on the topics. First the packaging design in general is reviewed, followed by a paragraph on taste expectations; the use of metaphors; the use of texts cues; the mediators and finally the research design is
presented.
2.1
Influence of packaging
Product packaging has a big influence on consumer behaviour. Especially in stores and supermarkets the packaging is one of the main factors which determines if a consumer buys a product or not (Creusen & Schoormans, 2005; Schifferstein, Fenko, Desmet, Labbe, & Martin, 2013). A consumer is influenced by many aspects of a packaging, such as the label (Fenko, Kersten & Bialkova, 2016), images and alignment (van Rompay, Fransen & Borgelink, 2014) and colour use (Kauppinen‐Räisänen, 2014; Spence, 2016). A label for instance can increase the
expected tastiness or healthiness of the product, depending on the type of label that is presented (Fenko et al, 2016).
According to Creusen and Schoormans (2005) the appearance of a product can have different purposes, for instance it can have an aesthetic and a symbolic meaning. It
communicates the functional benefits of the product, the quality of the product and how the product can be used. Displaying the right values and characteristics of the product is important for drawing attention and customer satisfaction. The former is especially important in the overexposed supermarket where the consumer is overloaded with products. For a brand it is crucial to communicate clearly and attractively in order to stand out.
Schoormans and Robben (1997) also empathize the importance of product categorization by different product characteristics, such as quality or a specific flavour. For the product coffee this can be for instance the intensity of the flavour (strong or weak).
2.2
Taste experience
10 Schifferstein et al., 2013). Consumers have certain expectations of the sensory attributes only by examining the text, colour and images on the packaging (Deliza, MacFie, and Hederley (2003).
Lee, Frederick and Ariely (2006) showed in their research that the packaging of a food product actually influences the experienced taste when it was showed before tasting a product but not when it was showed after tasting the product. This implies that simply the packaging alone influences how people experience the taste of a product and can confirm expectations by tasting it. This finding is also supported by the research from Mizutani et al. (2010), were they found that pleasant images on the packaging of orange juice led to an overall increased taste experience. Not just the design of the packaging influences the consumers’ taste perception, but also the texture (Van Rompay, Finger, Saakes & Fenko, 2016), the shape and colour (Becker et al., 2011) can significantly influence how the consumer experiences a product. For example a study by Lith (2015) shows that a healthy looking material and colour enhances the expected healthiness of crackers. Measuring the actual taste experience is an important aspect of a product evaluation since the actual tasting experience verifies if the consumer likes it or that he or she will be disappointed and probably would not consider buying the product again.
Currently, most research about taste is focused on the relationship between haptic sensations of the packaging and the taste expectations and evaluations (Becker et al., 2011; Krishna & Morrin, 2008). The research by Becker et al. (2011) for example indicated that a more angular shape of a yogurt pack creates a more intense flavour sensation, or that the texture of a coffee cup can influence the perceived sweetness or bitterness of the coffee (Van Rompay et al., 2016). However, little is know about the impact of images and metaphors on taste experience.
Another technique to create a taste expectation and experience is by simply making a textual claim of the taste, which has already been proven in a study by Mizutani et al. (2010). For example ‘strawberry’, ‘soft’ or ‘rich’ give a very specific indication of which flavour the consumer can expect. Another option is to visualize the flavour by for instance placing a picture of a strawberry on a yoghurt pack. However, there are also taste expectations that are harder to visualize, for example a weak or strong taste or a round or smooth taste are quite difficult to be visualized. For these product expectations there are no literal translations in the form of an image, but it can be indirectly visualized by showing something that represents this
characteristic by the use of a metaphor. In the next section this topic will be further discussed.
2.3
Metaphors
in terms of a different kind of object or experience”. Forceville (2008) stresses that there needs to be a clear resemblance between the target and the source. A metaphor cannot only be
experienced in words, but a metaphor can influence consumer behaviour in many different ways (Krishna & Schwarz, 2014).
Visual metaphors
Forceville (1994) mentions visual metaphors, which are metaphors that are visually expressed by presenting two different images in a non-literal but in a ‘is’ or ‘is like’ way; replacing an expected image by an unexpected one. Forceville (2002) argues that metaphors are not only related to words but also to a wide range of thoughts, therefore images can represent these thoughts. For example, the concept of strength can be conceptualized by a representation of a ‘strong’ image, like a lion (‘as strong as a lion’). A condition for a metaphor according to Forceville (2002) is that a visual metaphor is typically irreversible; the metaphor representing the source cannot be reversed. The lion can represent strong coffee, but strong coffee cannot represent a lion. The visual metaphor owns his success due to the implicit way of
communicating and by the attractive use of images (Jeong, 2008).
Embodied cognition
The mechanism of a metaphor can be explained by embodied cognition. Embodied cognition is generally referred to as the abstract meaning of a product feature that is related to our bodily movements and experiences (Van Rompay et al., 2012). Our bodily experiences and our sensory interactions are required to understand the human cognition (Krishna & Schwarz, 2014; Wilson, 2002).
12 associated with a literal heavier package, intense smell and less activity (Van Rompay et al., 2014). Here, a lower position was associated with heaviness and more intensity. Since there is still a lot to be discovered about this topic and the results are not very straightforward, it is important to conduct more research to know more about the effects of different spatial positions. Interesting can be to investigate how placing images high or low, or left or right possibly have other effects on the consumer’s perception of the product. Perhaps placing a text or image up high can be seen as more powerful or that a higher position can be associated with more strength and effort to get to that high position and therefore the product can be evaluated as strong or heavy. This concept of strength is considered in this research.
Metaphors in research
Earlier studies have shown the effect of metaphors, where Meier, Robinson and Clore (2004) for example have presented the effect of the metaphor ‘dark is bad’ by showing that bright coloured objects evokes more positive feelings. However, McQuarrie and Phillips (2005) consider a few important features of visual metaphors; they claim that metaphors are not always effective when the metaphor is irrelevant to the product category and a visual metaphor is more open to different interpretations compared to a direct cue like a word. This empathizes the importance of research on this topic.
The metaphor strength for food products, for example coffee, can give an impression of a strong taste and therefore influence the evaluation of the packaging, the perceived taste, the effectiveness of the product and influence the final purchase intention. This research tests if a metaphor related to strength on the packaging of coffee has a significant influence on the taste experience and product evaluation.
The following hypotheses are formulated to guide the research:
o H1a/b/c/d/e: Coffee packages with a lion as a metaphor for strength positively influences the a) packaging evaluation b) strength experience c) taste experience d) physical effects e) purchase intention of the coffee.
2.4
Verbal cues
While visual elements of the packaging obtain much attention in research on packaging design, verbal cues should not be ignored. A text, compared to a visual element, can evoke different meanings of the product (Mueller & Lockshin, 2008), and so can have a unique contribution when it comes to packaging design. However the same study also stated that generally consumers find visual representations easier to process and understand, compared to a textual one.
Mueller and Lockshin (2008, p. 3) refer to the saying “a picture is worth a thousand words”, but a text on a package can contribute to a higher perceived attractiveness, quality and purchase intention (Machiels & Karnal, 2016).
Furthermore, a text cue can be used to support an indirect visual metaphor in order to give the right meaning to the image, since a metaphor can be open to interpretation (McQuarrie & Phillips, 2005; van Rompay & Veltkamp, 2014), nonetheless the study by Machiels and Karnal (2016) tested this phenomenon and found different results. Their research indicated that further research on this topic is needed. Moreover, the Dual Coding Theory by Paivio (1990) suggests that combining a visual with a verbal cue should enhance the recognition and retention of the given information. Since a metaphor is an indirect indicator of a product quality, a metaphor will be compared to a direct message, namely a text claim: ‘Extra strong’. For the use of a text claim the following hypotheses are formulated, including an expected interaction effect. o H3a/b/c/d/e: Packages with a text claim indicating a strong coffee positively influences the
a) packaging evaluation b) strength experience c) taste experience d) physical effects e) purchase intention of the coffee.
o H4: A combination of a metaphor related to strength and a text claim related to strength will have a stronger influence on the evaluation of the coffee, compared to when the two
elements are presented separately.
2.5
Mediators
14 influence the final variable Purchase Intention. Therefore the following and final hypothesis is formulated:
o H5a/b/c/d: The a) packaging evaluation b) strength experience c) taste experience d) physical effects will mediate the effects of the metaphor and text claim and positively influence the final purchase intention.
2.6
Research design
The following model in Figure 1 gives an overview of the research. A 3 (no metaphor vs. up located metaphor vs. down located metaphor) x 2 (text claim vs. no text claim) experimental research design will be conducted. With this design the main research question will be addressed: ‘To what extend does a metaphor compared to a text claim on a coffee packaging influence the product experience and evaluation?’
Metaphor
o Top located metaphor
o Down located metaphor
o No metaphor
Text claim
o Text claim
o No text claim
Packaging evaluation
Taste experience
Physical effects
Purchase intention Strength
[image:14.595.83.496.387.527.2]experience
3
Pre study
In order to create reliable measurement scales and stimuli for the main study, a pre study was conducted. The main study tests the evaluation of different coffee packages. Measurement scales to evaluate coffee are not present in existing research, therefore more insights in the evaluation of coffee was needed. Moreover, a correct metaphor and text claim were chosen for the stimuli in the main research that communicate the right metaphor and the right message. Both the measurement scales of the evaluation of a coffee pack (Strength Experience, Taste Experience and Physical Effects), the image of the metaphor and text claim were determined with the pre study.
3.1
Focus group
Chosen was to conduct a pre study in the form of a focus group. The focus group consisted of coffee experts who have a more professional view on the evaluation of coffee; in this case baristas from Starbucks were used for the study. The same focus group determined the final image and text claim for the stimuli material for the main study. The focus group presented the needed insights needed for the main study, of which the most important insights are presented in Paragraph 3.3. The focus group consisted of six participants, both male and females. The participants all work or used to work at Starbucks, which make them a coffee expert. All participants are between the ages of 21 until 29 years old.
3.2
Design of the focus group
16
3.3
Important findings
The discussion went well and led to a range of expected tastes in a coffee. For example sweet, bitter, sour, nutty, smoky and spicy are flavours that were called several times during the conversation. It was surprising to hear that the continents of a good or bad cup of coffee are very different per person. Not everyone likes a nutty flavour and prefers a bitterer cup of coffee. Therefore it can be concluded that the evaluation of a coffee taste can best be judged by simply asking if the participant thinks the coffee tastes good or bad, or maybe the coffee is expensive or cheap. Most participants did agree on the effects of coffee, they expect that coffee makes them more awake, energetic, focussed, alert and gives them a boost but also a relaxed feeling. When the participants were asked to come up with a text claim that indicated a strong coffee the words ‘dark’, ‘dark roast’, ‘extra strong’ and ‘intense’ were called. They all agreed that the text claim ‘Extra dark’ or ‘Extra strong’ were clear in communicating a strong type of coffee. For the determination of the image for the metaphor the participants made a top 3 of the most beautiful cards, the cards for best suiting the word ‘strong’ and also for ‘coffee’. The cards contained different images of for example animals and a bodybuilder. All images can be found in
4
Main study
The main study of this research tests how the use of a visual metaphor and text claim are evaluated. Also the location of the metaphor is considered. A questionnaire is used to measure the constructs that represent the evaluation of the respondents. By using a questionnaire it is possible to tests all conditions in a fast and efficient way. The respondent got a quick impression of the different packages; next the participant got to taste the coffee and was asked to evaluate it with the use of a questionnaire. This chapter reflects the design, participants, procedure and the measurement instruments and reliability for all constructs.
4.1
Stimuli and design
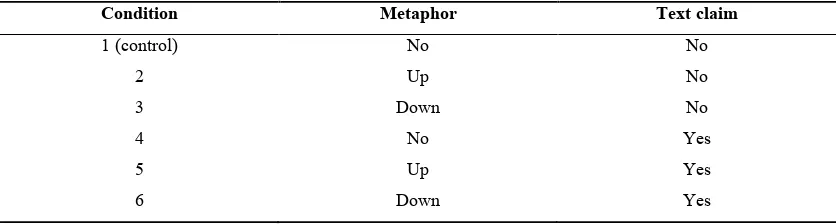
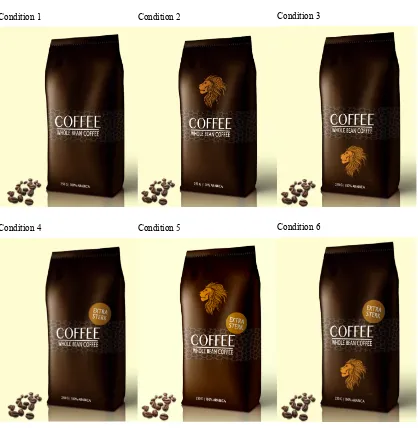
[image:17.595.85.503.586.698.2]This study uses the product coffee beans. For this product the (indirect) metaphor on different two locations (top and bottom) and the (direct) text claim are compared. The metaphor of strength is visualized with an image of a strong animal, as a result of the focus group a lion was chosen as a correct metaphor. Also the text claim is based on the focus group, the direct text claim indicates the strength with the text ‘Extra sterk’ (translated: ‘Extra strong’). The typeface, the packaging shape and the packaging colour are kept as neutral as possible. The packaging contains as less a possible distracting features but still a few are used in order to make the packaging as real as possible. The stimuli are created with the use of Adobe Photoshop and can be found on the next page in Figure 2. A bigger version of the images can also be found in Appendix C. There are six different conditions in total. The conditions are presented below in Table 1:
Table 1 – Overview of the six conditions
Condition Metaphor Text claim
1 (control) No No
2 Up No
3 Down No
4 No Yes
5 Up Yes
18
Condition 1 Condition 2 Condition 3
[image:18.595.92.510.112.540.2]Condition 4 Condition 5 Condition 6
Figure 2 - Overview of the six stimuli
4.2
Participants
For the main study 131 participants participated in the study, distributed over the six different conditions. The participants are active consumers who could buy a coffee product; therefore the participants are included in the research when they drink at least one cup of coffee a year. All participants are both male and female consumers and at least 18 years old, living in the Netherlands.
A few participants were deleted from further evaluation since they did not meet the
Chi-Square tests shows that there were no significant differences, X2(5) = 5.29, p = .38, between gender and the conditions. A one-way ANOVA also confirmed that there were no significant differences between the conditions and ages, F(5, 117) = 1.11, p = .36. These results confirm that the sample was random. An overview of the final participants can be found in Table 2.
Table 2 - Demographic information of the participants
Condition N Age Gender
M SD Male Female
1 20 35.90 16.22 40% 60%
2 20 30.85 15.29 15% 85%
3 20 31.30 14.67 45% 55%
4 20 28.30 13.48 25% 75%
5 22 27.68 11.38 31.8% 68.2%
6 21 27.10 13.27 33.3% 66.7%
Total 123 30.12 14.12 31.7% 68.3%
4.3
Coffee consumption
The participants were asked about their coffee preferences. Their preferred type of coffee, strength of coffee and frequency of consumed coffee was asked. With these questions the different types of consumers were controlled in this study. Figure 2 gives an overview of the coffee usage among the participants.
Figure 3 - Overview of the coffee consumption
[image:19.595.91.481.505.643.2]20
Table 3 – Preference for type of coffee
Type of coffee N % % of cases
Espresso 13 8.4 10.6
Regular coffee 40 26.0 32.5
Cappuccino / latte 80 51.9 65.0
Sweetened coffee 20 13.0 16.3
Other 1 0.6 0.8
Total 154 100.0 125.2
Table 3 shows the preference of the type of coffee. The most popular types of coffee are cappuccino (65%) and regular coffee (32.5%). Participants were able to select more than one type of coffee; this makes the total number of cases 154 instead of 123.
Table 4 – Preferred strength of coffee
N Min Q1 M Q3 Max Mean
Preferred strength 123 1 5 6 7 10 5.93
Table 4 shows a simple overview of the preferred strength of the coffee of the participants. Most participants prefer a bit strong coffee, with a mean strength of 5.93 on a scale from 1 to 10. Based on the five number summary it can be concluded that 50% of the participants prefer a level of strength between 5 and 7 on a scale from 1 to 10.
4.4
Procedure
4.5
Measurement instruments
The questionnaire measures all variables (Packaging Evaluation, Strength Experience, Taste Experience, Physical Effects and Purchase Intention). If available, existing scales for the constructs were used. All items are measured on a 7-point Likert scale, including reversed items in order to avoid bias. The questionnaire starts with the selection criteria were the participant was asked how much coffee he or she drinks, people who drink less than one cup of coffee a year were excluded from the research. The questionnaire ends with demographical questions regarding their age and gender. The questionnaire can be found in Appendix D.
Packaging Evaluation
This construct measures the first impressions the respondent has of the packaging and is expected to mediate the effects of the independent factors (metaphor and text) and the dependent variables (Strength Experience, Taste Experience and Physical Effects). The questions test the basic evaluation of the packaging on a 7-point Likert scale. Questions like ‘I like this packaging’ and ‘I think this coffee is of good quality’ are asked. This question ensures that the participant really takes the time to evaluate the packaging before tasting the coffee.
Strength Experience
The measurement of the construct Strength Experience is based on the insights of the focus group from the pre study. Asked was how the participants evaluated a strong coffee and what they associated with this. Strength Experience was measured using a 7-point Likert scale where the participant was asked to indicate their level of agreement with how well words like ‘dark’, ‘heavy’ and ‘powerful’ fitted the coffee they tasted. The participant could choose between ‘totally disagree’ and ‘totally agree’.
Taste Experience
The construct Taste Experiencemeasures how well the participants evaluate the coffee taste. Since a good or bad coffee tastes for everyone different, the tastes were measures on a more basic level. The participant could indicate their level of agreement on a 7-point scale between ‘totally agree’ and ‘totally disagree’ on statements like ‘I think this coffee tastes… good… expensive…etc.’.
Physical Effects
22 question ‘I expect that this coffee makes me’ was asked. The participant would rate statements like ‘more awake’, ‘more concentrated’ and ‘more focussed’. The rated items are based on the findings from the pre study.
Purchase Intention
For Purchase Intention the scale of Dodds, Monroe and Grewal (1991) is used. The scale was also measured with a 7-point Likert scale where the participant could chose between ‘totally disagree’ and ‘totally agree’. The existing scale was edited to fit the supermarket product coffee and resulted into three items that were used in the questionnaire.
4.6
Reliability
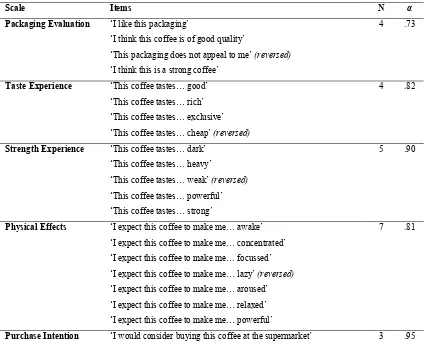
[image:22.595.85.524.427.772.2]The reliability of the scales is calculated according to the values of Cronbach’s Alpha. The values need to be at least .70 in order to be called reliable (Spector, 1991). Table 5 presents the final scales and their reliability. All items have an alpha of at least .73 and can be called reliable.
Table 5 – The items per scale and the reliability of the constructs
Scale Items N α
Packaging Evaluation ‘I like this packaging’ 4 .73 ‘I think this coffee is of good quality’
‘This packaging does not appeal to me’ (reversed) ‘I think this is a strong coffee’
Taste Experience ‘This coffee tastes… good’ 4 .82 ‘This coffee tastes… rich’
‘This coffee tastes… exclusive’ ‘This coffee tastes… cheap’ (reversed)
Strength Experience ‘This coffee tastes… dark’ 5 .90 ‘This coffee tastes… heavy’
‘This coffee tastes… weak’ (reversed) ‘This coffee tastes… powerful’ ‘This coffee tastes… strong’
Physical Effects ‘I expect this coffee to make me… awake’ 7 .81 ‘I expect this coffee to make me… concentrated’
‘I expect this coffee to make me… focussed’ ‘I expect this coffee to make me… lazy’ (reversed) ‘I expect this coffee to make me… aroused’ ‘I expect this coffee to make me… relaxed’ ‘I expect this coffee to make me… powerful’
‘I would buy this coffee at the supermarket’
5
Results
This research tests two factors: the use of metaphors on two different positions and the use of text claims. This resulted in six different conditions that measured the five dependent variables: Packaging Evaluation, Taste Experience, Strength Experience, Expected Effectiveness and Purchase Intention. A one-way MANOVA was conducted to see which influence the metaphor and text claim have on the variables. An alpha with the value of .05 is used. All noticeable results are discussed in the results section, which leads to a confirmation or disconfirmation of the proposed hypotheses. An overview of the descriptive statistics of the variables and the results of the one-way MANOVA test can be found in Appendix E.
5.1
Metaphor effects
The study tests the effects of metaphors on packages. Four out of the total six conditions contained the metaphor of a lion that resembled the strength of the coffee, placed on the top or at the bottom of the packaging. Below the effects of the metaphor are tested.
Packaging Evaluation
A metaphor appears to have a significant main effect on the Packaging Evaluation, F(2, 117) = 9.36, p < .001. These results show that packages with a metaphor are more positively evaluated compared to a packaging without a metaphor. Figure 4 shows a graph that demonstrates that the presence of a
metaphor, whether up or down, has a positive influence on the Packaging Evaluation of the coffee. The packaging is more appreciated with a lion or maybe the appearance of an image on the design. The metaphor in the top position is somewhat more appreciated compared to the bottom position, but this effect between the top and bottom location is not significant. The findings are in favour of the hypothesis regarding the presence of the lion (H1a), but
[image:25.595.288.500.456.596.2]demonstrate no significant results regarding the hypothesis about the top and bottom location (H2a).
26
Strength Experience
The metaphor effect is marginally
significant for Strength Experience, F(2, 117) = 2.42, p = .09. The graph in Figure 5 shows how the evaluation is distributed among the positions of the metaphor. Strength
Experience has the highest evaluation on packages containing a metaphor, but show no difference between the different positions of
the lion. Just as for the Packaging Evaluation, the presence of a lion shows a positive effect on the Strength Experience, but the position does not show any effect. This is in line with the predictions about the main effect of the metaphor (H1b), but contradicts the hypothesis about the position of the metaphor (H2b).
Purchase Intention
The metaphor effect is also marginally significant for Purchase Intention, F(2, 117) = 2.47, p = .09. The graph in Figure 6 shows how the effects are distributed among the positions. This graph shows a different pattern than the graphs in Figure 4 and 5 since the metaphor does not seems to have the main influence, but the position of the lion does.
Surprisingly, the metaphor placed on the bottom has the highest evaluation on Purchase Intention, and therefore contradicts the hypothesis about the effects of the position on Purchase Intention (H2e). Also the metaphor on the top position is equally evaluated as the packages without a metaphor. The top position therefore does not seem to add any value when it comes to Purchase Intention. The metaphor alone does have an influence, supporting H1e, but only when the metaphor is in the down-placed position, rejecting H2e.
[image:26.595.303.519.129.267.2]The effect of the metaphor was not found significant for the other variables as can be seen in Table 9, Appendix E. This leads to a rejection of the remaining hypotheses H1c/d and H2c/d. An overview of the supported and not supported hypothesis can be found in paragraph 6.5.
[image:26.595.286.515.408.552.2]Figure 5 - The mean strength evaluation
5.2
Text claim effects
A text claim was tested on the different coffee packages. Three out of the six conditions contained a text claim ‘Extra strong’ on a fixed location. The effects of the text claim are discussed below.
Strength Experience
The use of a text claim has a significant main effect on the Strength Experience, F(1, 117) = 4.42,
p = .04. As can be seen in the graph in Figure 7, the presence of a text claim has a positive influence on the level of strength of the coffee. This is in line with the expectations claiming that a text claim has a positive influence on the Strength Evaluation of a coffee packaging (H3b).
Purchase Intention
The text claim effect is marginally significant on Purchase Intention, F(1, 117) = 2.29, p = .07, which means that the current data almost confirms the main effect of text claim for this construct. In Figure 8 it can be seen that the text claim also has a positive influence on the Purchase Intention of the coffee. So a text claim shows for both the Strength Experience and the Purchase Intention a positive influence. This positive influence of the presence of
a text claim on the Purchase Intention is in line with the predictions (H3e).
The effect of the metaphor was not found significant for the other variables as can be seen in Table 9, Appendix E. This leads to a rejection of the remaining hypotheses H3a/c/d. An
overview of the supported and not supported hypothesis can be found in paragraph 6.5.
5.3
Interaction effects
[image:27.595.331.535.218.362.2]No interaction effects were found between the metaphor and text claim. This means that the
[image:27.595.326.535.414.566.2]Figure 7 - Mean strength experience
28
Figure 9 - Results of the regression analysis
other. This results in a rejection of H4, which indicated that a text claim and a metaphor together have a more positive effect compared to when the elements are presented separately.
5.4
Regression analysis
To see if Packaging Evaluation, Strength Experience, Taste Experience and Physical Effects had a direct effect on Purchase Intention a stepwise multiple regression was conducted.
[image:28.595.85.474.679.782.2]Although the constructs Taste Experience and Physical Effects did not appear to be influenced by the use of a metaphor or text claim according to the one-way MANOVA, the variables do seem to have a predictive power for the construct Purchase Intention. All other variables did not have a significant effect on Purchase Intention and were deleted from the regression analysis. Table 6 shows the results of the regression analysis.
Table 6 – Regression analysis of Physical Effects and Taste Experience
Dependent variable: Purchase Intention
Models β t p F
Adj. R2
(ΔR2)
Model 1 84.69 .41
(.00) Physical Effects .64 9.20 .00
Model 2 59.42 .49
(.08) Physical Effects .45 5.75 .00
Taste Experience .35 4.53 .00
The only remaining variables in the regression analysis are Physical Effects and Taste Evaluation and support H5c and H5d. Remarkable is that both variables are more focussed on the quality of the coffee. Merely the variable Physical Effects already predicts Purchase Intention for 42% and has a significant influence on Purchase Intention, β = .64, t = 9.20, p < .001. However, including Taste Experience, β = .35, t = 4.53, p < .001, to the model with the Physical Effects, β = .45, t = 5.75, p < .001, increases its predictive power with 8%, which leads to a final adjusted R2 of .49. Physical Effects and Taste Experience together then predict almost 50% of the Purchase Intention of the coffee. The model in Figure 9 below shows the regression analysis of the total model, including the non-significant variables.
Packaging Evaluation Strength Experience Taste Experience Physical Effects Purchase Intention NS NS
β = .35
β = .45
5.5
Overview of hypotheses
[image:29.595.73.549.244.784.2]Considering the previous results, the proposed hypotheses can be supported or rejected. Below in Table 7 an overview is given of the hypotheses.
Table 7 – Overview of the supported and rejected hypotheses
Hypotheses Supported
H1a Coffee packages with a lion as a metaphor for strength positively influence the packaging evaluation of the coffee.
Yes
H1b Coffee packages with a lion as a metaphor for strength positively influence the strength experience of the coffee.
Yes*
H1c Coffee packages with a lion as a metaphor for strength positively influence the taste experience of the coffee.
No
H1d Coffee packages with a lion as a metaphor for strength positively influence the physical effects of the coffee.
No
H1e Coffee packages with a lion as a metaphor for strength positively influence the purchase intention of the coffee.
Yes*
H2a Placing the metaphor on the top compared to on the bottom of a packaging has a more positive influence on the packaging evaluation of the coffee.
No
H2b Placing the metaphor on the top compared to on the bottom of a packaging has a more positive influence on the strength evaluation of the coffee.
No
H2c Placing the metaphor on the top compared to on the bottom of a packaging has a more positive influence on the taste experience of the coffee.
No
H2d Placing the metaphor on the top compared to on the bottom of a packaging has a more positive influence on the physical effects of the coffee.
No
H2e Placing the metaphor on the top compared to on the bottom of a packaging has a more positive influence on the purchase intention of the coffee.
No
H3a Packages with a text claim indicating a strong coffee positively influences the packaging evaluation of the coffee.
No
H3b Packages with a text claim indicating a strong coffee positively influences the strength experience of the coffee.
Yes
H3c Packages with a text claim indicating a strong coffee positively influences the taste experience of the coffee.
No
H3d Packages with a text claim indicating a strong coffee positively influences the physical effects of the coffee.
30
of the coffee.
H4 A combination of a metaphor related to strength and a text claim related to strength will have a stronger influence on the evaluation of the coffee, compared to when the two elements are presented separately.
No
H5a The packaging evaluation will mediate the effects of the metaphor and text claim and positively influence the final purchase intention.
No
H5b The strength experience will mediate the effects of the metaphor and text claim and positively influence the final purchase intention.
No
H5c The taste experience will mediate the effects of the metaphor and text claim and positively influence the final purchase intention.
Yes
H5d The physical effects will mediate the effects of the metaphor and text claim and positively influence the final purchase intention.
Yes
6
Discussion
This study aimed to get more insights in the effects of metaphors and text claims on product packages. To test these effects six conditions were examined and used to evaluate the dependent variables Packaging Evaluation, Strength Experience, Taste Experience, Physical Effects and Purchase Intention. In this discussion all results are evaluated per factor and the final
conclusions are described. Furthermore, the implications and limitations of the research are discussed and a general conclusion is given.
6.1
Discussion of results
Metaphor
This study is interested in how a metaphor on a product packaging can contribute to the product expectations and evaluation. The last couple of years there is an increasing amount of research focussed on this topic and has shown the importance of testing how a metaphor impacts the consumer’s evaluation of a product (Sundar & Noseworthy, 2014; Van Rompay & Veltkamp, 2014). This study confirms these findings and demonstrates that the presence of a metaphor, in this case the image of a lion to communicate the strength of the coffee, positively influences the general packaging evaluation.
The lion on the coffee packaging was successful in communicating the strength of the coffee. Packages with a lion were perceived to taste stronger compared to packages without a lion, even though the coffee the participants tasted was not a specifically strong coffee and for all participants in the different conditions the same coffee was used. This means that a visual metaphor is an effective tool in communicating a product attribute or can give the illusion that a product contains a specific product attribute. Therefore, this result confirms the previous findings by Forcevile (2002).
A significant effect for the presence of a metaphor was found on the packaging evaluation. Placing a lion on a packaging has a positive influence on the packaging evaluation, meaning that the participants evaluated the packages to be more beautiful, appealing, higher of quality and were more convinced that the product contained a stronger coffee. Jeong (2008) states that the attractiveness of images contributes to the evaluation of a product; this claim can be confirmed with this study.
32 intention of a product. Surprisingly, this result is not mediated by the previously mentioned variables Packaging Evaluation or Strength Experience since these variables were
non-significant in the regression analysis. A metaphor can therefore have a direct effect on Purchase Intention or be mediated by an external variable like for example price, brand or trust.
Also the results were not significant for the Taste Experience and Physical Effects, perhaps the representation of a lion is not associated with a better taste or human physical effects and therefore the right connection is not made. Or the lack of a physical product like of a coffee cup or bean makes the packaging less connected to the original product coffee and therefore the taste experience can be harder to imagine.
Position
One of the most unexpected results is how the position of the metaphor influenced the evaluation of the participants. There was a top-located position of the metaphor and a bottom-located position. The top-bottom-located lion was evaluated to have a more appealing packaging. However overall, the bottom-located lion was better evaluated. Unfortunately, many of these effects were not found significant. To be more specific: the mean evaluation of Strength
Evaluation, Taste Experience and Physical Effects was a bit higher for the lower placed lion, but these results were too little to be called significant. Thus, it can be concluded that the location has no influence on the general evaluation, but expected is that more data can confirm the trend that has been acknowledged and that a bottom-located lion will have a positive influence on the more intrinsic product evaluation but not for the extrinsic attributes.
The one significant result was found for Purchase Intention; participants implied to buy the product sooner when they were shown a packaging with a lion on the bottom of the package. This result is in line with the other non-significant results, which show that a lion on the bottom has a more positive influence on their evaluation of the product. This result can be supported by the research of Van Rompay et al. (2014) where it was concluded that a lower position and movement referred to the idea of heaviness. The concept of heaviness can, according to the results of the focus group, be related to the idea of strength, a strong taste can be perceived as heavy (on the tongue). Heaviness was also one of the items of the scale for Strength Experience. Hereby, this research enhances the idea that a lower spatial position on a packaging can give the impression of heaviness, not just literally but also metaphorically heavy of taste.
Text claim
‘Extra sterk’ (‘Extra strong’ in English) was placed on the coffee packages for half of the conditions. As in line with the expectations, a text claim did contribute to communicating its product attribute of a strong coffee.
The text claim is found significant on the Strength Experience and also on the Purchase Intention, for both variables the packages containing a text claim had a positive influence on their evaluations. The text claim is very straightforward and it would have been surprising if the message was not well understood, this also did not seem to be a problem in the study.
The text claim was not of benefit for the taste or effectiveness of the coffee. Contrary to the metaphor, the packaging was also not found more appealing with the text claim presented. From this is it can be concluded that a text claim works best for communicating a specific product attribute, but not really for much more. This strategy possibly makes the consumer more convinced about the benefits a product has; he or she perhaps has more trust in the product or prefers a simple and clear message, which can lead to a higher purchase intention. A negative effect for the text claim has not been found in this study, from which it can be concluded that a text claim works for the aim it is suppose to work and does not negatively influence other elements. A text claim presents itself as a simple and effective communication tool for product packages.
Interaction effects
In this study there were no interactions found between the factors, but the text claim and metaphor were found effective on its own. This result is surprising since the Dual Coding Theory by Paivio (1990) proposes that both visual and verbal information are processed and recognized better together than presented separately. The results do not show any effects
between the visual metaphor and the verbal text claim, which raises questions about the working of the two elements together. Though, these results are in line with the study by Machiels and Karnal (2016) where they found that a text and image, both regarding the level of processing of an orange juice, did not show any interaction effects. This shows that there is more to be discovered about how visual and verbal elements work together and how the consumer processes them.
Mediating effects
34 importance than the actual coffee itself. Besides, this study did not particularly manipulate the taste expectations or effects directly, but is more focussed on the strength of the coffee. It seems that the participants were not influenced by the metaphor or text claim when it comes to the actual taste and effects or maybe even the quality of the coffee itself. However, the two
variables Taste Experience and Physical Effects are important predictors for the decision to buy a coffee or not. A coffee should have a pleasant and good taste and it should have the desired physical effects in order to make a chance to be purchased by the consumer. However, still 51% of the purchase intention is determined by other factors that are not tested in this research, but these variables remain unknown in this study.
When the consumer buys a product in a supermarket he or she most of the time does not know how a coffee actually tastes or which effect the coffee has. In this study the participants did taste the coffee product and the factors Taste Experience and Physical Effects became predictive for Purchase Intention. Possibly these two variables have a different impact when the consumer buys the product in the supermarket and has no opportunity to taste the product. This remains a question that cannot be answered with this study, but it can be concluded that the quality, meaning the taste and the physical effectiveness, of the coffee does say a lot about the chances if a consumer is likely to buy the product or not.
6.2
Implications
Practical implications
Current research already shows the influence that packages have on the decision making process of consumers in supermarkets (Creusen & Schoormans, 2005; Schifferstein, Fenko, Desmet, Labbe, & Martin, 2013). Thus, a good design based on the knowledge of which effects different factors can have on consumer behaviour can be crucial. A brand does not only want to stand out, but also wants to communicate the right message in order to be successful.
This study demonstrates that the use of a metaphor, its location and a text claim all have influence on the evaluation and the product evaluation. Placing a metaphor on a packaging does not only communicate successfully its message in a metaphorically and indirect way, but it also enhances the aesthetic quality of the packaging and can contribute to the final purchase
a text claim is effective in communicating one simple message or product attribute. If the text claim is not drawing too much attention it probably will not negatively influence any other factors, but it would also not contribute to anything else. Though, a text claim on its own is powerful enough to influence the purchase intention of the consumer.
Theoretical implications
This research supports existing studies about the influence of product packages, making the findings and theories more valid and valuable. More information has come to knowledge that creates opportunities for new research. This research in particular is a good example where several studies are combined and tested in one study; a metaphor, its position and text claim are factors that are not new within the field of consumer research, but are topics that need more research to gain more insights on how to successfully make use of them. The used factors in this study, to my knowledge, have also never been researched in this combination before. The results can be applied and tested for other products or categories in future studies. It can be interesting to see if the results are the same for other beverages like energy drink, soda or tea. But the design might also be suitable for completely different products like cleaning products, where for instance a lower placed lemon can increase the expected cleaning effects or scent experience.
6.3
Limitations and suggestions for future research
36 study did not show significant effects for the different type of consumers, which can possibly affect the preference for a strong coffee when people might not like strong coffee in general. Since the experiment was conducted in a Starbucks the participants possibly might not represent the general coffee buyers in the supermarkets but might appear to be more coffee lovers than the general supermarket consumer.
Elaborating on the limitations, advice and guidelines for future research can be formulated. First of all it can be interesting too test how this design works for other products and product categories, tested on more participants. From this it can be concluded if the results can be generalized for all packages or perhaps only drinks or food products. To get more insights in the final results it is important to know which other mediating or moderating variables can be influenced by a metaphor, its position and text claim and how these variables can influence the eventual purchase intention. Possible mediators can be brand preference or awareness, price and trust. A moderator can be the amount of consumption or the level of involvement. High
involved consumers are likely to take more time to evaluate a packaging and can be less
sensitive for peripheral cues, for these consumers a text claim providing useful information will probably have the biggest influence on the purchase intention. Where the lower involved consumer prefers a more simple and attractive packaging and will be influenced by the images and its location on a packaging. This study shows that taste and effectiveness are very important predictors for the purchase intention, but they were not influenced by the independent factors. Interesting can be to investigate how a package can influence the variables of taste and physical effectiveness in order to increase the purchase intention. A possible method for this can be a focus group or interviews to find the underlying reason why they like a packaging or not and to understand how important certain packaging elements are for them.
6.4
Conclusion
Reference list
Becker, L., Van Rompay, T. J., Schifferstein, H. N., & Galetzka, M. (2011). Tough package, strong taste: The influence of packaging design on taste impressions and product evaluations. Food Quality and Preference, 22(1), 17-23.
Cardello, A. V. (1994). Consumer expectations and their role in food acceptance. In
Measurement of food preferences (pp. 253-297). Springer US.
Creusen, M. E., & Schoormans, J. P. (2005). The different roles of product appearance in consumer choice. Journal of product innovation management, 22(1), 63-81.
Dodds, W. B., Monroe, K. B., & Grewal, D. (1991). Effects of price, brand, and store information on buyers' product evaluations. Journal of marketing research, 307-319.
Fenko, A., Kersten, L., & Bialkova, S. (2016). Overcoming consumer scepticism toward food labels: The role of multisensory experience. Food quality and preference, 48, 81-92.
Forceville, C. (2002). The identification of target and source in pictorial metaphors. Journal of pragmatics, 34(1), 1-14.
Forceville, C. (1994). Pictorial metaphor in advertisements. Metaphor and Symbol, 9(1), 1-29.
Jeong, S. H. (2008). Visual metaphor in advertising: Is the persuasive effect attributable to visual argumentation or metaphorical rhetoric?. Journal of Marketing Communications,
14(1), 59-73.
Kahn, B. E., & Deng, X. (2010). Effects on visual weight perceptions of product image locations on packaging. Sensory marketing: Research on the sensuality of products, 259-278.
40 Kauppinen‐Räisänen, H. (2014). Strategic use of colour in brand packaging. Packaging
Technology and Science, 27(8), 663-676.
Krishna, A., & Morrin, M. (2008). Does touch affect taste? The perceptual transfer of product container haptic cues. Journal of Consumer Research, 34(6), 807-818.
Krishna, A., & Schwarz, N. (2014). Sensory marketing, embodiment, and grounded cognition: A review and introduction. Journal of Consumer Psychology, 24(2), 159-168.
Lakoff, G., & Johnson, M. (1980). The metaphorical structure of the human conceptual system.
Cognitive science, 4(2), 195-208.
Lee, L., Frederick, S., & Ariely, D. (2006). Try it, you'll like it the influence of expectation, consumption, and revelation on preferences for beer. Psychological Science, 17(12), 1054-1058.
Lith, R. (2015). Communicating health through package color and material: the influence of color and material of food packaging on perceived product healthfulness (Master's thesis, University of Twente).
Machiels, C. J., & Karnal, N. (2016). See how tasty it is? Effects of symbolic cues on product evaluation and taste. Food Quality and Preference, 52, 195-202.
McQuarrie, E. F., & Phillips, B. J. (2005). Indirect persuasion in advertising: How consumers process metaphors presented in pictures and words. Journal of advertising, 34(2), 7-20.
Meier, B. P., Robinson, M. D., & Clore, G. L. (2004). Why good guys wear white automatic inferences about stimulus valence based on brightness. Psychological science, 15(2), 82-87.
Mizutani, N., Okamoto, M., Yamaguchi, Y., Kusakabe, Y., Dan, I., & Yamanaka, T. (2010). Package images modulate flavor perception for orange juice. Food quality and preference,
Mueller, S., & Lockshin, L. (2008). How Important is Wine Packaging for Consumers? On the Reliability of Measuring Attribute Importance with Direct Vebal Versus Indirect Visual Methods (Doctoral dissertation, Academy of Wine Business Research).
Paivio, A. (1990). Mental representations: A dual coding approach. Oxford University Press.
Schifferstein, H. N., Fenko, A., Desmet, P. M., Labbe, D., & Martin, N. (2013). Influence of package design on the dynamics of multisensory and emotional food experience. Food Quality and Preference, 27(1), 18-25.
Schoormans, J. P., & Robben, H. S. (1997). The effect of new package design on product attention, categorization and evaluation. Journal of Economic Psychology, 18(2), 271-287.
Schwarz, N. (2004). Meta-cognitive experiences in consumer judgment and decision making.
Journal of Consumer Psychology, September.
Spence, C. (2016). Multisensory Packaging Design: Color, Shape, Texture, Sound, and Smell.
Integrating the Packaging and Product Experience in Food and Beverages: A Road-Map to Consumer Satisfaction, 1.
Spector, P.E. (1991). Summated rating scale construction. Thousand Oaks: Sage publications inc.
Sundar, A., & Noseworthy, T. J. (2014). Place the logo high or low? Using conceptual metaphors of power in packaging design. Journal of Marketing, 78(5), 138-151.
Van Rompay, T. J., De Vries, P. W., Bontekoe, F., & Tanja‐Dijkstra, K. (2012). Embodied
product perception: Effects of verticality cues in advertising and packaging design on consumer impressions and price expectations. Psychology & Marketing, 29(12), 919-928.
42 Van Rompay, T. J., Fransen, M. L., & Borgelink, B. G. (2014). Light as a feather: Effects of
packaging imagery on sensory product impressions and brand evaluation. Marketing letters, 25(4), 397-407.
Van Rompay, T. J., & Veltkamp, M. (2014). Product packaging metaphors: Effects of ambiguity and explanatory information on consumer appreciation and brand perception.
Psychology & marketing, 31(6), 404-415.
Appendi
ces
44
Appendix A – Questions pre study
Note: All questions were asked in Dutch.
-- INTRODUCTION --
Here I want to ask the participants to not just think of the ‘Starbucks rules’ about coffees and tasting coffees. But I would like there own and general opinions. I also will mention that they free to say anything what is on their mind. The interview will be used for research purposes only and the participants will remain anonymous.
PART 1. TASTE EXPECTATIONS
Q1. You are all coffee experts. Can you tell me which words you might use when you describe how a coffee tastes, despite the quality of the coffee? Can everyone name 2 words?
Q2. Which flavours would you like to taste in a good cup of coffee? Q3. Which flavours would you expect to taste in a strong cup of coffee? Q4. Which flavours would you expect to taste in a weak cup of coffee?
PART 2. EXPECTED EFFECTIVENESS
Q5. Which effect do you expect after drinking coffee? How do you expect to feel afterwards?
Q6. Would you say that coffee makes you…: … more focussed? (NL: gefocussed)
… more active? (NL: actief) … more awake? (NL: wakker)
… more concentrated? (NL: geconcentreerd) … more aroused? (NL: geprikkeld)
PART 3. TEXT
Q7. Image you buy a pack of coffee, what kind of coffee would you expect to see on the packaging that indicates is it a strong coffee? What would you choose to place on such a coffee packaging?
Q8. Which of the following text claims do you think is most clear in communicating a strong type of coffee?
• ‘Extra sterk’ (EN: extra strong)
• ‘Extra sterke koffie’ (EN: extra strong coffee)
• ‘Sterke smaak’ (EN: strong taste)
• ‘Extra dark’
• ‘Extra krachtig’ (EN: extra powerful)
• ‘Extra caffeine’
• ‘Very strong”
PART 4. STRENGTH
Q9. What does a strong coffee mean to you? (Only strong of taste, or more caffeine etc.)
Q10. Before you I placed a couple of images. My question to you is to make a top 3 together of the cards that you think are most appealing/beautiful.
Q11. Can you now do the same, but then a top 3 of the cards that you think best match the word ‘coffee’.
Q12. Can you now do the same, but then for the word ‘strength’?
46
Appendix B – Images pre study
Appendix C – Stimuli main study
Condition 1: Control condition (no metaphor, no text claim)Condition 2: Metaphor up + no text
48 Condition 5: Metaphor up + text claim
Appendix D – Questions main study
Note: All questions are translated to Dutch in the final questionnaire.
This questionnaire is part of my Master Thesis for the study Communication Studied, which I attend at the University of Twente. By filling out this questionnaire you are helping me
graduate, thank you for that! Filling out the questions will take about 4 minutes. The results are used for research purposes only and will be treated anonymously. Know that there is no right or wrong answer. Thank you again for taking the time to fill out this questionnaire.
Important: The products that are used in this study have by no means a relation with Starbucks products. The brand Starbucks has no relation with this study.
Kind regards, Roxan de Vries
☐ I hereby agree to participate in this study and declare that I am at least 18 years old.
Q1. How often do you drink coffee?
□ Never (à excluded from the research)
□ At least 1 cup of coffee a year
□ One or two cups a month
□ A few cups of coffee a week
□ At least one cup of coffee every day
Q2. What kind of coffee do you prefer?
□ Espresso
□ Regular coffee (filter, lungo, Senseo etc)
□ Cappuccino or latte
□ Sweetened coffee with syrup
□ None of the above
Q3. On a scale from 1 to 10, how strong do you prefer your coffee?
50
The following questions are about the packaging you see below. Take a minute to look at the image. Important: you cannot go back to this image later on.
> SHOW PACKAGING A / B / C / D / E / F <
Q4. Please indicate your level of agreement on the following statements:
Totally disagree - - - Totally agree Q4.1 I like this coffee package
Q4.2 I think this coffee is of good quality Q4.3 This packaging does not appeal to me Q4.4 I think this is a strong coffee
You may now taste the coffee. The coffee belongs to the coffee packaging you just saw. (A sip is enough, it is about the impression you have of the coffee).
The next questions are about the coffee you just tasted from the shown packaging. Q5. Please indicate your level of agreement on the following statements:
This coffee tastes:
Totally disagree - - - Totally agree Q5.1 Good Q5.2 Rich Q5.3 Exclusive Q5.4 Cheap Q5.5 Dark Q5.6 Heavy Q5.7 Weak Q5.8 Powerful Q5.9 Strong
Q6. Please indicate your level of agreement on the following statements:
I expect this coffee to make me:
Q6.3 Focussed Q6.4 Lazy Q6.5 Aroused Q6.6 Relaxed Q6.7 Powerful
Image you are in the supermarket looking for coffee and you see this coffee packaging. The product fits within your budget.
Q7. Please indicate your level of agreement on the following statements
Totally disagree - - - Totally agree Q7.1 I would consider buying this coffee at the supermarket
Q7.2 I will purchase this coffee at the supermarket
Q7.3 There is a strong likelihood that I will buy this coffee at the supermarket
Finally, I would like to know some general information about you.
Q8. What is your age? __
Q9. What is your gender?
□ Male
□ Female
52
Appendix E – Additional tables
Table 8 – Descriptive statistics of scales
Text claim Metaphor Evaluation Packaging Experience Strength Experience Taste Physical Effects Purchase Intention M SD M SD M SD M SD M SD
No Text claim No metaphor 4.84 1.21 3.72 1.32 4.14 1.51 4.07 1.20 3.78 1.85
Metaphor up 5.63 .64 4.31 1.43 4.43 1.34 4.27 1.18 4.25 1.76
Metaphor down 5.40 .81 4.77 1.32 4.59 1.12 4.51 1.02 4.50 1.25
Text claim No metaphor 4.76 1.21 4.58 1.16 4.36 1.25 4.39 1.06 4.60 1.67
Metaphor up 5.57 .74 5.01 1.24 4.68 1.14 4.61 .71 4.21 1.46
Metaphor down 5.56 .56 4.66 1.14 4.86 .88 4.61 .79 5.21 .92
Table 9 – Results of the one-way MANOVA for all variables
Factor Packaging Evaluation
Strength Experience
Taste Experience
Physical Effects
Purchase Intention F p F p F p F p F p
Metaphor 9.35 .00 1.55 .22 2.42 .09 1.15 .32 2.47 .09
Text claim .00 .96 1.29 .26 4.42 .04 1.91 .17 3.29 .07
Metaphor * Text
[image:52.595.81.521.449.592.2]