University of Warwick institutional repository: http://go.warwick.ac.uk/wrap
This paper is made available online in accordance with publisher policies. Please scroll down to view the document itself. Please refer to the repository record for this item and our policy information available from the repository home page for further information.
To see the final version of this paper please visit the publisher’s website. Access to the published version may require a subscription.
Author(s): M.S. Kariapper, C.J. Fisher, D.P. Woodruff , A.S.Y. Chan and Robert G. Jones
Article Title: Structure determination of PF3 adsorption on Cu(1 0 0) using X-ray standing waves
Year of publication: 2008 Link to published version:
http://dx.doi.org/ 10.1016/j.susc.2007.11.025
Publisher statement: Hariapper, M. et al. (2008). Structure
Structure determination of PF3 adsorption on Cu(100) using X-ray
standing waves
M. S. Kariapper
Department of Physics, King Fahd University of Petroleum and Minerals, Dhahran 31261, Saudi Arabia
C. J. Fisher, D. P. Woodruff∗
Physics Department, University of Warwick, Coventry CV4 7AL, UK
A. S. Y. Chan, Robert G. Jones
Department of Physical Chemistry, School of Chemistry, University of Nottingham Nottingham NG7 2RD, UK
Abstract
The local structure of the Cu(100)c(4x2)-PF3 adsorption phase has been investigated
through the use of normal-incidence X-ray standing waves (NIXSW), monitored by P 1s
and F 1s photoemission, together with P K-edge near-edge X-ray absorption fine
structure (NEXAFS). NEXAFS shows the molecule to be oriented with its C3v symmetry
axis essentially perpendicular to the surface, while the P NIXSW data show the molecule
to be adsorbed in atop sites 2.37±0.04 Å above the surface, this distance corresponding to
the Cu-P nearest-neighbour distance in the absence of any surface relaxation. F NIXSW
indicates a surprisingly small height difference of the P and F atoms above the surface
0.44±0.06 Å, compared with the value expected for an undistorted gas-phase geometry of
0.77 Å, implying significant increases in the F-P-F bond angles. In addition, however, the
F NIXSW data indicate that the molecules have a well-defined azimuthal orientation with
a molecular mirror plane aligned in a <011> substrate mirror plane, and with a small
(5-10°) tilt of the molecule in this plane such that the two symmetrically-equivalent F atoms
in each molecule are tilted down towards the surface.
Keywords: surface structure; chemisorption; X-ray standing waves; copper; phosphorous
trifluoride
∗
1. Introduction
The chemisorption properties of phosphorous trifluoride, PF3, have attracted significant
interest due, in large part to the strong similarity as a ligand in metal coordination
chemistry to that of CO, although with most transition metals it bonds only in a
singly-coordinated fashion. Studies of PF3 adsorption on extended surfaces of several metals
appear to indicate similar behaviour, but have also served as model systems for the study
of electron-induced dissociation and desorption phenomena. The great majority of these
investigations have been on three-fold symmetric substrates: Pd(111) [ 1
1
], Ni(111)
[ , 2, 3, 4], Pt(111) [5], Ru(0001) [6], Cu(111) [7
3
], and in the case of Ni(111) and
Cu(111) quantitative structure determination (mainly based on normal-incidence X-ray
standing Waves (NIXSW) [ , 7] and scanned-energy mode photoelectron diffraction
(PhD) [4]) have shown the bonding to be to singly-coordinate atop sites, with the
molecular C3v symmetry axis essentially perpendicular to the surface. One interesting
aspect of the adsorption of PF3 on these surfaces is the extent to which the adsorbed
molecules are azimuthally aligned, or are freely rotating about their C3v symmetry axis.
On both Ni(111) [2] and Ru(0001) [6] it has been shown, using ESDIAD
(electron-stimulated desorption ion angular distributions), that at low coverages (~0.04 ML)
azimuthal alignment occurs only at low temperatures (typically ~ 80 K or less), but at
saturation coverages of 0.25 ML or 0.33 ML, free rotation is suppressed even at room
temperature. This latter finding is broadly consistent with the fact that the intermolecular
distances in these high-coverage ordered phases (4.97 Å and 4.68 Å, respectively) are
significantly smaller than the estimated van der Waals diameter (relative to the symmetry
axis and thus parallel to the surface) of about 5.4 Å [1], leading to steric hindrance of the
rotational movement. There has also been some interest in the vibrational motion of the
adsorbed PF3 molecules relative to the surface, the atop adsorption site tending to favour
large-amplitude frustrated translational motion parallel to the surface, first noted in
NIXSW experiments on Ni(111) [3].
Somewhat more recently Braun et al. [ 8 ] have investigated the properties of PF3
and inelastic helium atom scattering. Their results show the formation of a c(4x2) ordered
phase at a nominal coverage of 0.25 ML (see Fig. 1) for which the nearest- and
next-nearest intermolecular distances are 5.11 Å and 5.71 Å, values that may, or may not, be
sufficiently short to allow azimuthal rotation of the adsorbed molecules. This study also
provided clear evidence of a frustrated translational surface vibration, and also identified
a higher coverage incommensurate phase at low temperature that, by implication, must
involve at least some molecular adsorption in multiply-coordinated sites.
Here we present the results of an experimental investigation of the Cu(100)c(4x2)-PF3
surface phase using NIXSW and NEXAFS (near-edge X-ray absorption fine structure).
NIXSW [9, 10] involves the measurement of the element-specific X-ray absorption, in
the present case by monitoring the P 1s and F 1s photoemission signal, in an X-ray
standing wavefield established due to the interference of the incident and scattered X-rays
at a Bragg reflection in the crystalline sample. By monitoring the absorption profile as the
photon energy is scanned through the Bragg condition, leading to a systematic shift in the
location of the standing wavefield, the location of the absorbing atoms relative to the
substrate scatterer atoms can be determined. Complementary information on the adsorbed
molecular orientation is provided by the polarisation-angle dependence of the NEXAFS
signal. Together these methods allow us to determine the local adsorption geometry, and
specifically, the adsorption site, and to explore the evidence for azimuthal ordering.
2. Experimental details
The experiments were conducted in a purpose-built UHV surface science end-station
taking radiation from a double-crystal monochromator (station 6.3) installed on the SRS
(Synchrotron Radiation Source) at the CCLRC Daresbury Laboratory. The NEXAFS
spectra and the NIXSW absorption profiles were obtained by measuring the intensity of
an element-specific Auger or photoelectron emission peak using a concentric
hemispherical electron-energy analyser (VSW Ltd) mounted in the horizontal plane at a
fixed angle of 40° to the incident synchrotron radiation. The Cu(100) sample was
mechanical polishing, and in situ argon ion bombardment and annealing cycles until a
clean well-ordered surface was obtained as indicated by Auger electron spectroscopy
(AES) and low energy electron diffraction (LEED). Adsorbate dosing of the surface was
effected by exposing the sample at a temperature of 110 K to PF3 gas introduced into the
chamber to a typical pressure of 5x10⁻⁸ mbar. An exposure of 2x10⁻⁶ mbar.s appeared to
be sufficient to ensure saturation coverage within a single layer; higher exposures led to
no further adsorption and no formation of multilayers. The sample was then briefly
annealed to 180 K to ensure that only the c(4x2) phase was present on the surface and not
the higher-coverage incommensurate phase found by Braun et al. [8] for temperatures below 145 K. Adsorbed PF3 is known to have a high cross-section for electron beam
desorption and dissociation (e.g. [7, 8, 11, 12, 13
13
]), so LEED and AES data recorded
from the adsorbate surface (to check for contaminants such as oxygen and carbon) were
carried out only after the NIXSW or NEXAFS measurements had been completed. These
checks with LEED did reveal the expected c(4x2) diffraction pattern, but this was only
seen for a few seconds before being replaced by a (1x1) structure, clear evidence of this
radiation damage. Incident photons can also cause fragmentation (probably by an
electron-mediated process) of adsorbed PF3, leading to characteristic chemical shifts in
the P 2p and 1s photoemission spectra associated with the PFx fragments (e.g.
[ , 14, 15]), but careful checks of the P 1s and F 1s photoemission spectra before and
after the NIXSW measurements (which typically took ~ 3 hours) showed no such effects;
this lack of damage may be attributed to the use of a low incident flux-density of
relatively poorly-focussed bending-magnet synchrotron radiation.
For the NIXSW measurements, X-ray absorption in the copper substrate was monitored
by the intensity of the Cu L3VV Auger transition (920 eV). The absorption at the F and P
atoms was obtained by monitoring the intensities of the F 1s photoemission (697 eV
binding energy) and P 1s photoemission (2146 eV binding energy) signals. In most cases
these intensities were taken as the difference between the electron emission at the peak
energy and the intensity measured at a kinetic energy a few eV higher. In the case of the
NIXSW experiment from the (111) scatterer planes (Bragg energy ~2975 eV), however, a
the X-ray absorption at the P atom. This is because, over the range of the photon energy
used, the P 1s photoemission peak crosses the Cu L3M2,3V Auger peak, at 840-849 eV
kinetic energy, on the high photon energy side of the standing wave condition. In order to
achieve effective separation of the intensity contributions from these two peaks, a wide
range energy distribution curve (EDC) of the Cu Auger peak was recorded using a photon
energy set to a value ~170 eV below the Bragg energy, chosen so that the P 1s peak is not
present in this range. This EDC (after normalisation to the X-ray beam flux) was then
used as the standard structured background spectrum. A series of narrow EDCs of the P
1s peak for a set of photon energies across the standing wave condition was then obtained
and each normalised to the X-ray beam flux. The standard background spectrum was
then matched to the high kinetic energy end of these individual P 1s EDCs by a
multiplication factor, and subtracted from the narrow EDC, leaving just the P 1s
photoelectron peak. The P 1s spectra obtained in this way were fitted using a
Doniac-Sunjic line shape [16], and the peak heights were extracted to form the absorption curve
for phosphorus. The fitting factors used in this background subtraction procedure
reproduce the fluctuations in the copper substrate background emission intensity through
the standing wave scan, and can be used as a measure of the NIXSW absorption signal in
the copper substrate.
Phosphorous K-edge NEXAFS data were obtained by monitoring the P KLL Auger peak
intensity (KE 1859 eV) as the X-ray energy was scanned through the P K-edge (2146 eV).
Spectra were recorded in five different incidence angles; using the standard NEXAFS
nomenclature of the grazing incidence angle (the angle between the photon beam and the
surface plane), these were 90° (normal incidence) 60°, 45°, 30° and 15°.
3. Results and structural analysis
3.1 NEXAFS
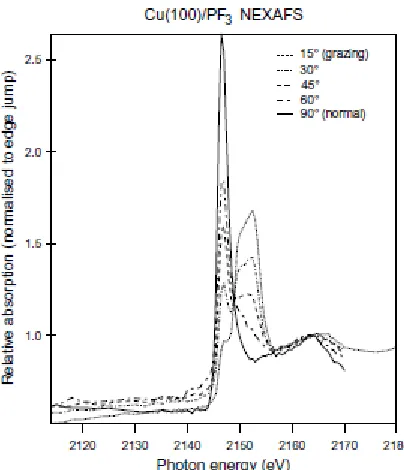
The P K-edge NEXAFS spectra are shown in Fig. 2. Individual spectra are normalised to
the incident X-ray beam and then all five spectra were normalised to a constant edge
is considered an adequate procedure as variations in the intensities of the EXAFS
oscillations with detection angle are expected to be small compared to the variations in
the NEXAFS peak intensities, which are our primary concern here.
Two clearly-resolved NEXAFS peaks, at ~2146.5 eV and ~2152.5 eV, are seen. When
the sample is moved towards normal incidence the first peak grows in intensity and the
second peak disappears, whereas at grazing incidence the second peak grows and the first
peak fades. As described in [7] for the same molecule adsorbed on Cu(111), the lower
energy peak is associated with a transition from the fully symmetric P 1s state into the
lowest unoccupied π-symmetry (strictly e-symmetry) 7e orbital of the molecule, partially occupied by π back donation from the metallic d orbitals, whilst the second peak corresponds to the transition to the σ-symmetry 8a1 orbital of molecule. In fact,
inspection of fig. 2 indicates that the σ-resonance peak consists of two components with
identical or closely similar dependence on the polarisation direction. Why this should be in unclear; a tilt of the molecule on the surface could lead to a splitting of the π-state due to loss of degeneracy of the πx and πy state, but there should be no equivalent effect on
the σ-state. However, we make no explicit use of the σ-resonance peak, and so do not
consider this problem further. The degree of polarisation of the synchrotron radiation at
these energies is 90%, with the electric vector in the plane of the incidence, and this
means that at normal incidence the electric vector is parallel to the crystal surface,
whereas at 0° grazing incidence it would be perpendicular to the surface. Therefore the
absence of the a1 peak at normal incidence and the large drop in intensity of the
e-symmetry peak on going to grazing incidence shows that the C3v axis of the molecule is
aligned perpendicular to the surface. No detailed quantitative analysis of these peak
intensities has been undertaken, but it is clear that the near-edge π-resonance at grazing
incidence is either extremely small or of essentially zero intensity depending on the
position of the continuum edge-jump. As such, we conclude that the molecule has this
3.2 NIXSW
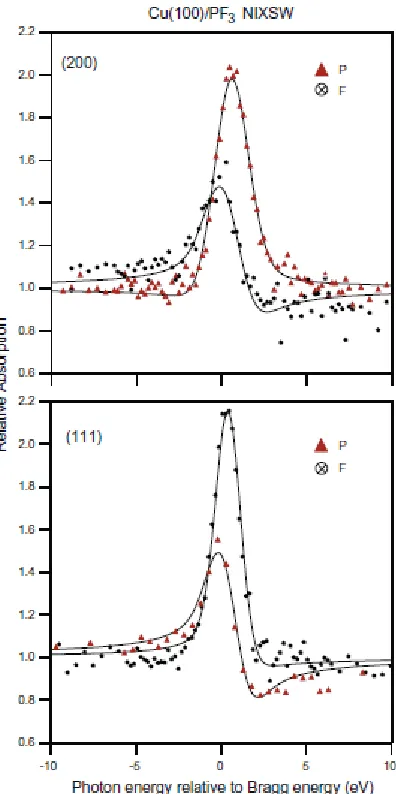
The NIXSW absorption profiles monitored from the P 1s and F 1s photoemission signals
through the (200) and (111) reflection conditions are shown in fig. 3. These experimental
NIXSW profiles were analysed using the XSWfit automated fitting procedure [ 18
9
].
NIXSW analysis provides two structural parameters [ , 10, 19]: the coherent position dH
(where H specifies the Miller indices of the scatterer planes) and the coherent fraction fco.
In the simplest case of an absorber occupying a single well-defined site, dH is equal to the
perpendicular distance of this site from the scattering planes, while fco is a measure of the
degree of local order. Notice that dH is defined relative to the nearest extended scatterer
plane, so even in this simplest structural situation the real distance may differ from the
coherent position by an integral number of substrate interlayer spacings.More generally,
fco can only take values between 0 and 1; some reduction below the ideal value of 1 for a
single well-defined site to ~0.8-0.9 arises from dynamic (thermal vibrations) and static
local disorder. Much lower values can occur, but this generally implies that there is
multiple site occupation. The shape of the profiles is also influenced by two
non-structural parameters, the Gaussian instrumental broadening ΔΕ (mainly due to the finite
resolution of the monochromator) and the absolute energy of the Bragg reflection EB.
These parameters were determined by fitting the substrate standing wave profile, and
were then fixed for the analysis of the adsorbate absorption profiles, which were then
fitted by only adjusting the adsorbate structural parameters.
For a more general understanding of the relationship between the XSW structural
parameters of the coherent position and coherent fraction, and the actual positions of
absorber atoms, a rather more formal discussion is required. In particular, to analyse
situations involving two or more distinct absorber sites one exploits the finding that the
coherent fraction and coherent position can be related to the spatial distribution of the
absorber atoms relative to the nearest scatterer plane f(z), defined by the spacing coordinate z, by
0
exp(2 / ) DH ( ) exp(2 / )
co H H H
where DH is the bulk interlayer spacing of the H scatterer planes [9, 10, 19]. From this it
is clear that fco and dH /DH define the amplitude and phase of one Fourier component of
the absorber site distribution projected along one direction (perpendicular to the relevant
Bragg scatterer planes). Notice that the left hand side of this equation can be represented
as a vector in an Argand diagram with length fco and direction determined by the phase
angle 2πdH /DH relative to the positive real axis [20
exp(2 / ) exp(2 / )
co H H i i H
i
f πid D =
∑
p πiz D dz]. The right hand side of the equation
is then a summation (integral) over component vectors of length f(z) and phase angle 2πz/DH. This interpretation is particularly useful in summing over discrete sites at
spacings zi,in which case f(z) is replaced by a set of discrete occupation probabilities, pi ,
leading to
(2)
The NIXSW structural parameter values obtained from the data of fig. 3 are summarised
in Table 1, while the quality of the resulting fits to the experimental data are shown in fig.
3. These functional fits, both based on monitoring 1s photoemission signals, include the
effects of non-dipole effects in the angular dependence of the photoemission, leading to a
forward/backward asymmetry parameter Q, and to a small offset in the coherent fraction due to a phase factor introduced by these non-dipole effects. The values of these
correction terms have been determined in previous calibration experiments for the
Cu(111) and (200) NIXSW energies [21]; specifically Q values for the (111) and (200) conditions used were, respectively, 0.18 and 0.25 for P 1s, and 0.25 and 0.31 for F 1s.
Note that the error estimates in Table 1 are based on the scatter of several different
experimental measurements; error estimates based on the least-squares fitting to
individual data sets are actually significantly smaller.
In order to interpret these structural parameters in terms of the actual structure, we
consider first the P atom which we expect to be bonded to the surface in a single atomic
site. In this context we note that the value of f(200) is quite close to unity, reinforcing the
view that all P atoms have essentially the same height above the surface. The (200)
surface, but because the XSW measurement provides the distance of the atoms from the
nearest extended substrate scatterer plane, the true height above the outermost Cu atom
layer is z(200) = d(200) + nD(200), where n is an integer. In principle, n could take any
integral value, but in practice only one value is likely to lead to a plausible Cu-P
nearest-neighbour distance. Notice, though, that if the outermost interlayer spacings of the
Cu(100) surface are relaxed, the net relaxation will constitute a systematic error between
z(200) as determined by this equation, and the true nearest-neighbour Cu-P interlayer
spacing. In practice, it is highly improbable that this net relaxation (i.e. the relaxation
integrated over all relaxed layers, which typically have alternating sign with layer
thickness) is greater than 0.1 Å, and is almost certainly much less than this, so this
problem has a minimal impact on the proper choice of n.
Table 2 shows the Cu-P nearest-neighbour distances (assuming no net relaxation) for n
values of 0 and 1 for each of the three highest-symmetry adsorption sites, namely
one-fold coordinated atop, 4-one-fold coordinated hollow, and two-one-fold coordinated bridge sites.
A NIXSW study of PF3 adsorption on Cu(111) [7] inferred a value of the Cu-P distance
of 2.25±0.04 Å, so we may expect a value on Cu(100) within about 0.1 Å of this value.
The only structure in table 2 to satisfy this constraint corresponds to atop adsorption with
a value of n of 1, and thus a value of z(200) of 2.37±0.04 Å. Valuable additional
information in making this selection, and even more significantly to determine the
adsorption site, is provided by the (111) coherent position. In particular, for a specific
height of the absorber atom above the surface, z(200), we can predict the value of d(111) to
be expected for different adsorption sites by simple triangulation. Specifically, for the
two fully-symmetric sites (the sites that retain the full point group symmetry of the
substrate), the general relationships are:
atop: z(111)=z(200) sin 35.26° = z(200) /√3 (3a)
hollow: z(111)=(z(200) + D(200)) sin 35.26° = 0.5 D(111) + (z(200) /√3) (3b)
These predicted values are included in Table 2, which shows that the atop geometry
value. Notice that Table 2 also shows that, on the basis of the triangulation of the (200)
and (111) XSW parameters alone, there is an ambiguity between the atop site with n=1, and the hollow site with n=0. This is because both sites correspond to the P atom lying at the same height atop a Cu atom, in one case atop a first layer atom, in the other case atop
a second layer atom. The XSW technique does not distinguish these situations, but the
different implied Cu-P nearest-neighbour distances clearly allows us to reject the hollow
site model.
Table 2 also shows that it is straightforward to reject the possibility of bridge site
adsorption, even without considering the bondlengths, because the predicted (111)
coherent fraction value for these sites is identically zero. Because the bridge sites have
only 2-fold rotational symmetry on a 4-fold symmetric substrate, there are two
inequivalent bridge sites (related by a 90° azimuthal rotation) that must have equal
occupation. The d(111) values for these two sites (that are the same as for the atop and
hollow sites, respectively) differ by D(111)/2, leading to a net cancellation and the zero
value of f(111), as may be recognised by substitution of this two-state solution into
equation (2) with p1=p2=0.5 and z2=z1+0.5D(111).
The clear conclusion that the PF3 molecule adsorbs in a one-fold coordinated atop site on
Cu(100) is, of course, consistent with our expectations of the general chemistry of this
species. One further feature of the NIXSW data that is qualitatively consistent with this
conclusion is the fact that for the P atoms the value of f(111) is significantly lower than that
of f(200). In studies of a range of molecular adsorbates on surfaces, using both NIXSW and
photoelectron diffraction, we have found evidence for atop-bonded species to show
large-amplitude wagging vibrational modes corresponding to frustrated rotation, with most of
the motion parallel to the surface. In NIXSW such motion has little effect on the coherent
fraction measured for standing wave nodal planes parallel to the surface, as the height
variation is small, but leads to a marked reduction of the coherent fraction for
measurements with nodal planes steeply inclined relative to the surface. For example, this
effect was seen in a NIXSW study of PF3 adsorbed (in atop sites) on Ni(111) using the
the surface), for which the P coherent fraction values were 0.8 and 0.5, respectively,
attributed to a root-mean-square (rms) vibrational amplitude parallel to the surface of
approximately 0.27 Å [3]. The reduction of the coherent fraction between the (200) and
(111) NIXSW in the present case could be reconciled with a very similar value of the rms
vibrational amplitude. Of course, an alternative source of this reduced f(111) value could
be a static rather than dynamic offset of the P atom from the exact atop site by a similar amount, implying a tilt of the Cu-P bond relative to the surface normal.
For further information on the adsorption geometry we now turn to the F (200) NIXSW
structural parameter values of Table 1. As for the P atom, the only plausible value of
z(200) corresponds to adding one bulk interlayer spacing to the measured d(200), leading to a
value 2.81 Å, just 0.44 Å higher above the surface than the P atoms. This small difference
in height of the P and F atoms is surprising. In the gas-phase molecule the P-F distance
projected onto the C3v symmetry axis is 0.77 Å, and the NIXSW studies of PF3 adsorbed
on Ni(111) [3] and Cu(111) [7] the height difference of the P and F atoms above the surface was found to be 0.75±0.15 Å and 0.80±0.06 Å respectively, both consistent with
adsorption of an undistorted molecule adsorbed with the molecular C3v axis perpendicular
to the surface. In the present case the much smaller interlayer spacing of the P and F
atoms clearly implies a substantial increase in the F-P-F bond angles relative to the
gas-phase molecule if the molecular symmetry axis is perpendicular to the surface. A tilt of
this axis, however, could partially account for the reduction in the average P-F interlayer
spacing relative to the surface normal. Of course, tilting the PF3 axis leads to some F
atoms moving down and others moving up, but if the tilt plane corresponds to a mirror
plane of the molecule such that two F atoms move down and one moves up, the weighted
average height, as monitored by the coherent position, is reduced. Such a difference in
height of the F atoms relative to the surface could also account for the fact that f(200) for
the F atoms is significantly lower than the value for the P atoms.
In order to explore this idea a little further a simple calculation was undertaken of the
(200) F coherent position and coherent fraction, as a function of the tilt angle of the C3v
the gas-phase value of 1.57 Å and the difference in the P and F coherent positions is 0.44
Å, as measured. A solution was found with a tilt angle of 13°, but this solution also
retains the large F-P-F bond angle distortion, the projection of the P-F bond along the
molecular symmetry axis being 0.47 Å, only slightly larger than the difference in the
d(200) values. Nevertheless, it is notable that such a tilt angle would place the P atoms 0.53
Å off atop, leading to a 40% reduction in f(111) relative to f(200) (see fig. 4 discussed below).
This is a significantly larger effect than that seen in the experimental data, so while a
small tilt may help to reconcile some aspects of the (200) coherent fractions, other
sources of disorder must contribute. Significantly, the much-reduced P-F spacing along
the molecular symmetry axis is not significantly changed by incorporating tilting, so this
effect seems to be an inescapable implication of the experimental data.
We finally turn to the (111) NIXSW parameter values for the F atoms; can this
information provide any specific information on the lateral positions of the F atoms and
thus the azimuthal alignment of the adsorbate PF3 species? The fact that f(111) is very
significantly larger than zero suggests that some such information should be available. Of
course, for any location of the three-fold symmetric PF3 molecule on the four-fold
symmetric Cu(100) surface, at least some of the F atoms must be in low symmetry sites
relative to the substrate, so we need to understand how the (200) and (111) XSW
structural parameters triangulate for low symmetry adsorption sites. This can be
established through the use of equation (2) above, where the summation is over all
symmetrically equivalent sites on the surface (related by the point group symmetry
operations of the substrate). The results, for photo-absorption at a single adsorbed atom in
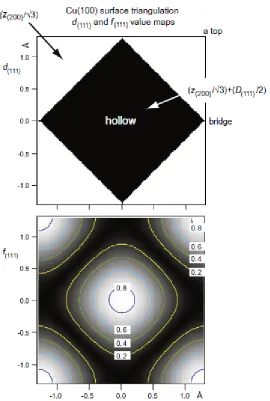
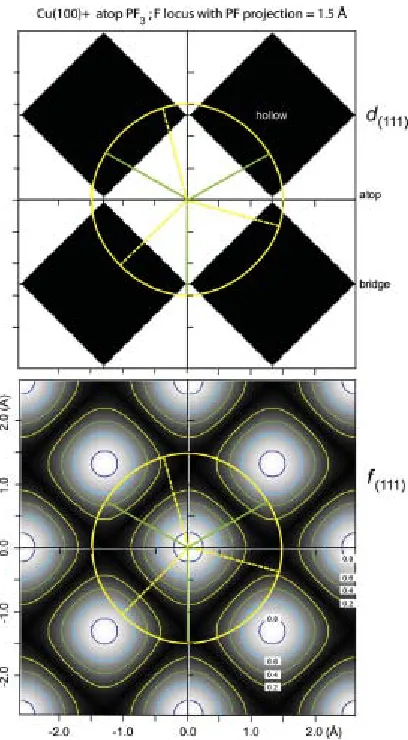
all possible lateral positions on the surface, are given in fig. 4, which shows
grey-scale-shaded contour maps of the values of d(111) and f(111) within a surface unit mesh. A
striking result is that there are only two possible values of d(111) for a specific height of
the absorbed atom above the surface, z(200). These specific values correspond to those
associated with the high-symmetry atop and hollow sites given in equations (3) above, so
the map in d(111) shows only the two extreme grey levels, black and white. The map in f(111) shows how the sudden switches between these two discrete d(111) can occur, because
d(111). Moreover, the value of this coherent fraction, that is unity at the two four-fold
symmetric atop and hollow sites, falls smoothly as the adsorption site is displaced further
and further from these high-symmetry locations. Thus, within an Argand diagram
representation, the vector representing the solution becomes shorter and shorter
(decreasing f(111)) as one moves off the high-symmetry sites, and switches direction (and
thus d(111) value) as its length passes through zero.
Of course, in the present case, we have three F atoms per adsorbed molecule, constrained
in their relative positions by the intramolecular bonding, so simple symmetry arguments
(the only common symmetry property that the surface and molecule can share is a mirror
plane) show that there must be at least two symmetrically-distinct F atom sites on the
surface. Notice, though, that the only two possible d(111) values differ by D(111)/2, so their
associated Argand vectors are diametrically opposed. Any mixture of surface sites must therefore lead to a summation involving these two discrete values, weighted according to
the location of the contributing sites. Thus, if we sum components having these two
values with the same occupancy (as in the bridge site discussed above), then the coherent
fraction is zero (the vectors cancel). If their occupancies are different, the resultant vector
has the direction (coherent position) of the higher-occupancy component, but a much
reduced amplitude due to the partial cancellation. We therefore conclude that, not only
does any single adsorption site on this fcc(100) surface lead to only two possible values,
of d(111), but any combination of surface sites also can lead to only one of these two
values.
Turning now to the experimental data, if we take z(200) for the F atoms to be 2.81±0.04 Å
as discussed above, then the two possible d(111) are 1.62±0.02 Å (atop) and 0.72±0.02 Å
(hollow). The experimental value is 0.77±0.04 Å, clearly consistent with the hollow-site
value. To understand the implications of this result, and the potential significance of the
measured value of f(111), fig. 5 shows the triangulation maps of fig. 4 re-plotted over 4
unit meshes of the clean surface, each map having a (yellow) circle superimposed around
the P atop site at a radius of 1.5 Å. This circle corresponds to all possible locations of the
molecular F-P-F angle consistent with the measured value of the P-F distance projected
along the molecular symmetry axis of 0.44 Å. Also superimposed on these plots are two
specific azimuthal orientations of the P-F bonds (shown as dashed (yellow) and solid
(green) lines) corresponding to one of the mirror planes of the molecule being aligned to
one of the mirror planes of the substrate, as shown in fig. 1. Notice that almost all points
on the circle defining possible F locations lie within the region of hollow-site d(111) values,
so the experimental result is entirely consistent with this picture.
The points of intersection of the P-F bonds with the circle on the f(111) map provide a
route to estimate the expected (111) coherent fraction to be measured for the two specific
azimuthal orientations shown in fig. 1. With the <001> mirror plane alignment,
corresponding to the (yellow) dashed P-F bond projections, all three F atoms lie in the
regions of hollow-site triangulation, one falling on a f(111) contour corresponding to a
value of ~0.65, the other two with f(111) values of ~0.15. The experimental f(111) value to
be expected is thus the weighted average of these, namely (0.65+0.15+0.15)/3=0.32. For
alignment in the <011> mirror plane, represented by the (green) solid P-F bond
projections, two F atoms are in equivalent sites with hollow site d(111) values and
individual f(111) values of ~0.47, while the third F atom is in a region (close to a bridge
site) corresponding to atop-site triangulation but with a very small f(111) value of ~0.05. In
this case, therefore, the weighted average coherent fraction expected is
(0.47+0.47-0.05)/3=0.30. Bearing in mind the experimental precision, these two predicted (111)
coherent fraction values are thus indistinguishable, and indeed, it is clear that from
inspection of fig. 5 that a random azimuthal orientation (or a freely rotating molecule)
would give essentially the same value.
Comparison with experiment, however, indicates that the true value of the (111) coherent
fraction is larger than these predicted values. The measured value is 0.43, but this value
must also include the consequences of whatever disorder or tilt leads to the experimental
value of f(200) (0.66) that is significantly reduced from the ideal value of unity. In
considering this substantial reduction of f(200) in our discussion above, we concluded that
one model that could account for this, at least in part, was if the molecule was tilted
atom. In the case of alignment in the <011> substrate azimuth, the consequence of such a
tilt can be estimated by displacing the F-locus circles upwards in fig. 5. This will clearly
have the effect of significantly increasing the f(111) values of the two F atoms in the upper
half of the figure maps, as these atoms move closer to the symmetric hollow sites, while
the effect on the f(111) value of the third F atom will be minimal as this passes through a
bridge site with zero coherent fraction. Such a tilt thus markedly improves the fit to the
measured f(111) value, as well as the f(200) value, for the F atoms. Notice that quite a small
tilt angle will have a large effect – a tilt of 10° produces a shift in the circle (which
becomes very slightly ellipsoidal) on the contour maps of fig. 5 by almost 0.5 Å,
sufficient to place the two F atoms in the upper half of the figure very close to the
symmetric hollow sites. By contrast, for the alignment of the molecular mirror plane in
the <001> azimuth, tilting has the opposite effect. In this case the circle is displaced
towards the top right-hand corner of the figure, and the individual f(111) values of all the
contributing F atoms are reduced.
Notice that these arguments relate to a static tilt of the molecular axis. The reduced f(111)
value for the P absorbers could be attributed to either dynamic time-averaged tilt of the
molecular axis, or a static tilt (averaged over symmetrically equivalent domains). The
same is not true in attempting to understand the f(111) value for the F absorbers, which is
actually higher than would be expected for a rigid perpendicularly-aligned molecule. In particular, this increase in the coherent fraction is associated with a particular sign of the
tilt in a particular azimuthal direction; tilting in the opposite sense would lead to a
reduced value of f(111), so a wagging motion symmetric about the surface normal will not
have the same effect as the static tilt.
4. General Discussion and Conclusions
The NIXSW data presented here clearly show that the PF3 species in the
Cu(100)c(4x2)-PF3 surface phase are adsorbed in one-fold coordinate atop sites, the triangulation of both
the P and F atom coherent fractions supporting this interpretation, with the molecular C3v
axis at least approximately perpendicular to the surface. This result is consistent with all
known behaviour of PF3 as a ligand in coordination chemistry. The P K-edge NEXAFS
data also clearly support this molecular orientation, although these data do not exclude
the possibility of a small (~10°) static or dynamic tilting of the molecular axis. The
reduced value of the NIXSW (111) coherent fraction for the P absorbing atoms could be
due to a substantial amplitude of atomic vibrations parallel to the surface, consistent with
a similar conclusion for PF3 adsorbed on Ni(111) [3], and with the observation of a
frustrated translational mode in an inelastic helium scattering investigation [8] of the
same surface phase on Cu(100) investigated here. However, this reduced P coherent
fraction could also be due to a static, rather than dynamic, lateral offset of the P atoms
from the exact atop site that would accompany a molecular tilt. In this regard it is notable
that more detailed consideration of the coherent fractions for the F absorption data,
indicates a significant preference for a slight tilt of the molecular symmetry axis such that
a molecular mirror plane is aligned in the <011> azimuth, with the two equivalent F
atoms tilted down closer to the surface. The static tilt required to achieve this improved
description of the NIXSW is only ~5-10°, well within the estimated precision of the
NEXAFS result. Incorporating this static tilt also defines the azimuthal orientation of the
PF3 species as having their molecular mirror plane aligned in the <011> close-packed
direction of the Cu(100) surface.
While at first sight the implied molecular tilt is surprising, and has certainly not been seen
in any previous studies of adsorbed PF3, inspection of fig. 1 serves to remind us that
introducing a three-fold symmetric molecule onto a four-fold symmetric substrate leads
to a system of much-reduced symmetry, with only a single mirror plane remaining. This
contrasts with all previous adsorption studies of PF3 conducted on three-fold symmetric
substrates. Notice, too, that the plane in which the molecular tilt is proposed, the <011>
direction of the upper diagram of fig. 1 (which shows the preferred azimuthal orientation
of the molecules) corresponds to the direction of the closest intermolecular distances, a
value less than the estimated van der Waals radii. It is thus only in this direction that the
intermolecular interactions can prevent the free rotation of the adsorbed PF3 species, and
in the absence of such free rotation there is no static or time-averaged two-fold rotational
There remains, however, one unexplained feature of the results presented here, namely
the significant reduction of the projection of the P-F bondlength along the molecular
symmetry axis, implying a substantial increase in the F-P-F bond angles relative to the
gas-phase species. In the gas-phase molecule it is known that the umbrella vibrational
mode of the molecule is rather soft, so this distortion is unlikely to have a high energy
cost, yet no such distortion appears to occur in the same species adsorbed on both
Ni(111) and Cu(111). Two differences between the Cu(100) surface on the one hand, and
the Ni(111) and Cu(111) surfaces on the other, could be relevant. One is that the
rotational symmetry mismatch of the molecule and the surface on Cu(100) makes a
solution with a tilted molecule more likely (and indeed, we find evidence for such a tilt)
and this brings (tow of) the F atoms closer to metal surface and thus more able to interact
with it. The second is that the packing density of the molecules in the Cu(100)c(4x2)
phase is ~15% lower than in the Ni(111)(2x2) surface, although the intermolecular
distance is almost identical. This could mean that it is easier to accommodate the larger
van der Waals radii of the distorted PF3 molecules (with enlarged F-P-F angles) on the
Cu(100) surface. Unfortunately, no ordered LEED pattern was seen in the Cu(111)/PF3
system (perhaps due to enhanced electron-beam desorption cross-sections) so we can
only surmise that saturation on this surface would also lead to a (2x2) ordering. However,
neither of these differences between the (100) and (111) surfaces seems to offer a
compelling reason for expecting the significant difference in F-P-F bond angles, and it
would certainly be of interest to see if this difference is reproduced by modern
total-energy calculations for these systems.
Acknowledgements
The authors are pleased to acknowledge the financial support of the Engineering and
Physical Sciences Research Council in the form of a research grant including provision
for access to the Daresbury Synchrotron Radiation Source. MSK acknowledges the
support given by the King Fahd University of Petroleum and Minerals. Jane Hinch
(Rutgers University) is thanked for providing information on the Cu(100)/PF3 system
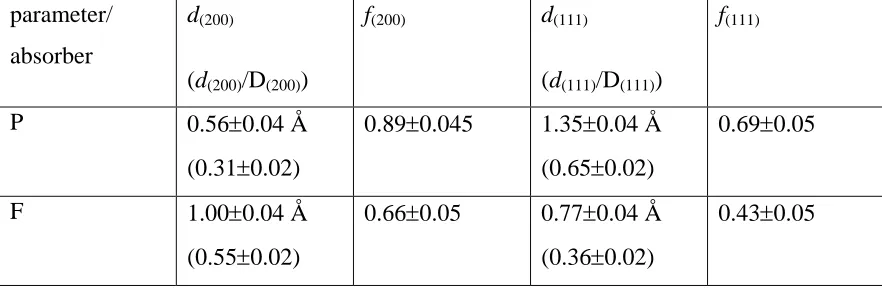
Table 1
Summary of NIXSW structural parameters obtained from absorption at the P and F atoms
of PF3 adsorbed on Cu(100). The coherent positions are shown both in the form of dH (in
Ångström units) and of dH/DH (a dimensionless quantity), the latter shown in brackets.
parameter/
absorber
d(200)
(d(200)/D(200))
f(200) d(111)
(d(111)/D(111))
f(111)
P 0.56±0.04 Å
(0.31±0.02)
0.89±0.045 1.35±0.04 Å
(0.65±0.02)
0.69±0.05
F 1.00±0.04 Å
(0.55±0.02)
0.66±0.05 0.77±0.04 Å
(0.36±0.02)
0.43±0.05
Table 2
Implications of specific P adsorption sites compatible with the measured NIXSW d(200)
value and the predicted d(111) values. The values shown in bold are those corresponding
to the solution consistent with NIXSW triangulation and bondlength considerations, as
described in the text.
adsorption
site
Cu-P nn
distance with
zCu-P = d(200)
predicted d(111)
value with
zCu-P = d(200)
Cu-P nn distance with
zCu-P = d(200)+D(200)
predicted d(111)
value with
zCu-P = d(200)+D(200)
atop 0.56±0.04 Å 0.32±0.02 Å 2.37±0.04 Å 1.36±0.01 Å
hollow 1.89±0.01 Å 1.36±0.01 Å 2.98±0.03 Å 0.32±0.02 Å
bridge 1.39±0.02 Å indeterminate
(f(111)=0)
2.69±0.04 Å indeterminate
[image:19.612.89.526.176.321.2]Figure Captions
Fig. 1 Schematic diagram of the Cu(100)c(4x2)-PF3 surface phase assuming the
molecules are located in atop sites (as found in the present study). The structure is shown
for two possible azimuthal orientations of the molecule corresponding to alignment of a
Fig. 2 P K-edge NEXAFS spectra from the Cu(100)c(4x2)-PF3 surface recorded at five
different incidence angles. Note that no absolute calibration of the photon energy scale
was conducted in these experiments, as only the relative energies are significant for this
[image:21.612.98.300.73.308.2]Fig. 3 Experimental NIXSW (200) and (111) absorption profiles (symbols) from the P
and F absorbers together with best-fit theoretical curves using the structural parameter
values listed in Table 1. Reduced photon energy steps were used in the data collection in
[image:22.612.105.303.76.473.2]Fig. 4 Grey-scale-shaded contour maps, as a function of lateral position on a Cu(100)
surface, of the values of the NIXSW parameters, d(111) and f(111), for a single absorber
[image:23.612.108.378.71.472.2]Fig. 5 NIXSW contour maps as shown in Fig. 4, but over an area of four Cu(100) surface
meshes, including a superimposed locus of possible F atoms sites for atop PF3 as found in
References
1 F. Nitschké, G. Ertl, J. Küppers, J. Chem. Phys. 74 (1981) 5911
2 M. D. Alvey, J. T. Yates, Jr., K. J. Uram, J. Chem. Phys. 87 (1987) 7221
3 M. Kerkar, D. P. Woodruff, J. Avila, M. C. Asensio, M. Fernandez-Garcia, J. C.
Conesa, J. Phys.: Condens. Matter 4 (1992) 6509
4 R. Dippel, K. -U. Weiss, K. -M. Schindler, P. Gardner, V. Fritzsche, A. M. Bradshaw,
M. C. Asensio, X. .M. .Hu, D. P. Woodruff, A. R. González-Elipe, Chem. Phys.
Lett. 199 (1992) 625
5 S. Liang, M. Trenary, J. Chem. Phys. 89 (1988) 3323
6 N. J. Sack, T. E. Madey, Surf. Sci. 347 (1996) 367
7 R. G. Jones, N. E. Abrams, G. J. Jackson, N. A. Booth, M. T. Butterfield, B. C. C.
Cowie, D. P. Woodruff, M. D. Crapper, Surf. Sci. 414 (1998) 396
8 J. Braun, G. G. Bishop, A. V. Ermakov, L. V. Goncharova, B. J. Hinch, J. Chem. Phys.
110 (1999) 5337
9 D. P. Woodruff, Prog. Surf. Sci. 57 (1998) 1
10 D. P. Woodruff, Rep. Prog. Phys. 68(2005) 743
11 M. D. Alvey, J. T. Yates, Jr., J. Am. Chem. Soc. 110 (1988) 1782
12 H. –S. Tao, U. Diebold, V. Chakarian, D. K. Shuh, J. A. Yarmoff, N. D. Shinn, T. E.
Madey, J. Vac. Sci. Technol. A 13 (1995) 2553
13 K .-U. Weiss, R. Dippel, K. -M. Schindler, P. Gardner, V. Fritzsche, A. M. Bradshaw,
D. P. Woodruff, M. C. Asensio, A. R. González-Elipe Phys. Rev. Lett. 71 (1993)
581
14 S. A. Joyce, J. A. Yarmoff, T. E. Madey, Surf. Sci. 254 (1991) 144
15 G. J. Jackson, J. Lüdecke, D. P. Woodruff, A. S. Y. Chan, N. K. Singh, J. McCombie,
R. G. Jones, B. C. C. Cowie, V. Formoso,Surf. Sci. 441 (1999) 515
16 S. Doniach, M. Sunjic J. Phys. C: Solid State Phys. 3 (1970) 285
17 D. P. Woodruff Rep. Prog. Phys. 49 (1986) 683
18 XSWfit is a procedure, written as an Igor-Pro macro, which automatically fits XSW
for calculating the XSW profile for a given set of parameters. A copy of the Igor
routines can be obtained from Rob Jones, email: [email protected].
19 J. Zegenhagen Surf. Sci. Reports 18 (1993) 199
20 D. P. Woodruff, B. C. C. Cowie, A. R. H. F. Ettema J. Phys.: Condens. Matter., 6
(1994) 10633
21 J. Lee, C. Fisher, D. P. Woodruff, M. G. Roper, R. G. Jones, B. C. C. CowieSurf. Sci.