Optimizing Purchasing and Distribution
Decisions at Fugro:
A Mathematical Programming Approach
Karen Abeniacar
Industrial Engineering and Management
Supervisors:
University of Twente:
Matthieu van der Heijden
Petra Hoffmann
Fugro Marine Services:
Management Summary
This research was carried out together with the Purchasing & Logistics Department of Fugro Marine Services. Fugro Marine Services is the inhouse vessel manager of Fugro and is internally referred to as Fleet Services (FS). Fugro operates a fleet of vessels in different regions around the world to provide site characterization and asset integrity services. These vessels are required to be optimally equipped to fulfill their tasks.
For this research, we focused on the supply chain network of FS. The company operates over a global network consisting of many suppliers and distribution options. We limited our research to materials of type "consumables & parts". These items constitute of household goods, stationary and small hardware that are consumed regularly and periodical order groups are already introduced for them. FS believes there is a possibility to standardize their purchasing and logistics processes. We need to determine the optimal purchasing and delivery options to supply these goods to the vessels.
Problem Description
FS wishes to revise their global procurement operations to improve financial performance. FS has a global network consisting of a large supplier base and multiple warehouses. This renders it difficult to evaluate the costs of all alternative purchasing and distribution options. Currently, the Purchasing & Logistics Department makes purchase decisions based on experience and intuition. The degree of efficiency of this approach is not known. There is no standard methodology that provides control over the process or evaluates alternative costs. As a result, expenses are perceived to be high.
Research Objective
We aimed to develop a decision-making tool for consumables & parts to minimize total purchasing and logistics costs while ensuring all required goods are supplied. We answered the corresponding research question: “How to make purchasing & distribution decisions for consumables & parts to ensure efficient operation of purchasing & logistics?”.
Approach
We initially studied the current way of operation of FS. We identified the cost breakdown building up the purchasing and logistics costs and the applicable distribution options. We accounted for cost components displayed in Table 1. We modeled deliveries made to the agents, the central or local warehouses or directly from the supplier to the vessels. We wanted to determine the minimum cost supply and distribution option for each required item. Since the costs incurred per port call are disjoint, we formulated our model to be run for each port call separately. We limited our analysis to 15 port calls realized in 2017 based on the available data. We re-enacted these cases and compared the cost of optimal decisions for purchasing and distribution with the realized costs.
We developed a mixed integer linear programming model. Formulating a linear model enabled us to obtain an exact solution corresponding to the minimum cost supply and distribution decisions. We modeled FS’s distribution network as a directed graph and incorporated applicable distribution options. We considered these options together with procurement and freight discounts.
Conclusions and Recommendations
Analyzing the decisions made by FS in 2017, we concluded that small modifications in the purchasing and distribution decisions could yield to significant improvements (Table 1). However, due to data unavailability, we cannot project the observations based on our test cases to the whole fleet. Largest fraction of realized costs, around 81% of the total costs, are coming from product prices, followed by transportation costs corresponding to 10%. Minimizing total costs by adjusting the purchasing and distribution options can lead to a saving of 6% mostly arising from product costs.
We demonstrated that considering different and more competitive suppliers over a larger geographical region can yield to a reduction in overall costs, although this may lead to an increase in ordering and handling costs. The results suggest splitting orders among a higher number of suppliers. Consolidating goods prior to delivery to vessel in a warehouse close to the suppliers is also preferred as was already done by FS. In the optimal case, one warehouse per port call was used and use of agents was never preferred. Direct deliveries from the suppliers to the vessel were chosen when the shipment was heavy and would result in extra handling costs or when the dangerous goods and perishables were restricted from having indirect distribution. Here, we note that the decisions presented by the model are a result of the interaction of the input values like the port location, the required goods and the associated costs and therefore, are case specific.
Table 1. Comparison of total costs of the realized and the optimal cases for the selected 15 port calls
TOTAL (€)
Description Realized Optimal Saving Saving (%)
Product cost: 307.674 287.009 20.664 7%
Ordering cost: 19.600 24.000 - 4.400 -22%
Transportation cost: 38.914 36.765 2.149 6%
Fixed facility cost: 1.918 1.319 599 31%
Handling cost: 1.848 2.047 - 198 -11%
Loading the vessel: 9.000 6.600 2.400 27%
Total cost: 378.953 357.739 21.214 6%
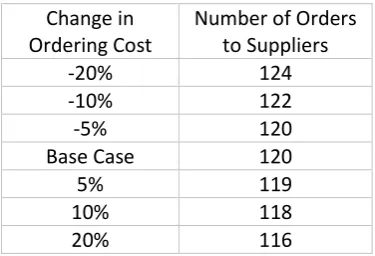
We performed a sensitivity analysis on transportation, ordering and loading costs to test the robustness of the optimal solutions. Changing costs by -20 – +20%, affected the decisions for only slight changes in the optimal decisions. As expected, in some cases we observed that decrease in ordering costs lead to splitting orders and decrease in loading costs resulted in higher number of separate deliveries made to the vessel. Increase in transportation costs required using suppliers closer to the port region. Since only small number of items were affected by these changes, we conclude that the model is not sensitive to any of these costs. This means that in case an increase in these costs occur, the decisions of the model would remain close to optimal. Since the product costs constitute the largest fraction of total costs, we suggest negotiating for procurement discounts. Introducing various threshold discount policies, we demonstrated that savings up to 12% can be achieved.
Acknowledgments
This thesis marks the end of my master’s in Industrial Engineering and Management. I am thankful to all the people who made my two years in the Netherlands memorable. Here, I would like to give special thanks to people who have supported and encouraged me during my thesis.
Major thanks to my first supervisor, Matthieu van der Heijden, for his valuable guidance, help with structuring my report and encouraging attitude. Also, thanks to my second supervisor, Petra Hoffman for her always critical and detailed feedback. I am grateful for all the help they have provided me. I would like to thank my company supervisor, Marco Joosten, for creating this thesis opportunity, for making time for me even when he was the busiest and for our discussion sessions. Special thanks to Matthew van Veen for helping me to get familiar with the daily operation of the Purchasing & Logistics Department and elaborately answering every single question I had. I also thank all the members of the Purchasing & Logistics Department for welcoming me at the office.
I would like to thank Henk Hoving and Thijs van Reijn, my scholarship sponsors, for giving me this opportunity. I am truly grateful.
Finally, I want to express my gratitude to all members of my family and my friends for their love and support. I thank my Enschede group for their friendship, Hannah and Hengameh for always listening to me and making me feel more optimistic, Samara for her encouragement, Jitske for being my companion since my first days here, Ren for always checking up on me, my housemate Barni for his daily support, and lastly, Selçuk for always giving me the motivation to pursue my goals.
List of Abbreviations
DDP Delivery Duty Paid
ETA Expected Time of Arrival
FS Fleet Services
GA Genetic Algorithm
ISM International Safety Management KPI Key Performance Indicator
MR Material Requisition
OEM Original Equipment Manufacturer
NFP Network Flow Problem
PO Purchase Order
RFQ Request for Quotation
SCND Supply Chain Network Design
Table of
Contents
Management Summary ... 3
Acknowledgments ... 5
List of Abbreviations ... 6
1. Introduction ... 10
1.1. Company Introduction ... 10
1.1.1. Fleet Services ... 11
1.1.2. Purchasing & Logistics Department ... 11
1.1.3. From Purchasing to Procurement Project ... 11
1.2. Research Plan ... 12
1.2.1. Problem Description ... 12
1.2.2. Research Objective ... 13
1.2.3. Research Questions ... 14
1.3. Project Scope ... 15
2. Analysis of the Current Situation ... 16
2.1. Current Network... 16
2.1.1. Distribution Options ... 18
2.2. Demand ... 19
2.3. Purchasing Process ... 20
2.4. Supplier Information ... 21
2.5. Logistics and Transportation ... 22
2.6. Inventory and Storage ... 22
2.7. Current performance... 23
2.8. Information Systems ... 25
2.9. Data Issues ... 25
2.10. Conclusion ... 26
3. Literature Review ... 27
3.1. Introduction ... 27
3.1.2. Distribution Network ... 27
3.2. Supply Chain Network Optimization ... 29
3.2.1 Supply Chain Model Classification ... 29
3.2.2. Related Work ... 29
3.3. Conclusion ... 33
4. Model Construction ... 34
4.1. Conceptual Model ... 34
4.1.1. Problem Description ... 34
4.1.2. Key Trade – offs Considered ... 34
4.1.3. The Network Structure ... 35
4.2. Mathematical Model ... 36
4.2.1. Modeling Choices ... 36
4.2.2. Sets and indices: ... 38
4.2.3. Parameters: ... 39
4.2.4. Decision Variables: ... 39
4.2.5. Objective: ... 40
4.2.6. Constraints: ... 40
4.2.7. Model Size ... 42
4.2.8. Software and Solver ... 43
4.3. Model Input and Output ... 43
4.3.1. Input Requirements ... 43
4.3.2. Model Output ... 47
4.4. Conclusions ... 48
5. Computational Experiments ... 49
5.1. Verification and Validation ... 49
5.2. Model Results ... 50
5.2.1. Experimental Design ... 50
5.2.2. Computational Results ... 51
5.3. Sensitivity Analysis ... 58
5.3.1. Transportation Costs ... 58
5.3.2. Ordering Cost ... 59
5.3.3. Loading Cost ... 60
5.3.4. Discount Structure ... 61
5.4. Conclusion ... 62
6. Conclusions and Recommendations ... 64
6.1. Conclusions ... 64
6.2. Recommendations ... 66
References ... 68
Appendix... 71
Appendix A. Organization of Fleet Services ... 71
Appendix B. Details of Realized and Optimal Configurations per Port Call ... 72
Appendix C. Purchasing and Distribution Decisions Optimization Tool User Guide ... 92
Appendix D. Algorithm Run Time per Port Call ... 106
Appendix E. Sensitivity Analysis for Transport Costs ... 107
Appendix F. Sensitivity Analysis for Ordering Cost... 108
Appendix G. Sensitivity Analysis for Loading Cost... 109
Chapter 1
Introduction
Global supply chain networks consist of alternative paths for purchasing and distribution activities. This may render it difficult for companies to evaluate the alternatives following a holistic approach. Fleet Services (FS) experiences this difficulty when submitting purchase orders (PO) and planning their logistics as well. Through this paper, we develop a mathematical model for determining the best combination of suppliers and distribution paths for required items, to supply the vessels with minimum overall supply chain costs.
This first chapter explains the context of the project. Section 1.1 provides an overview of the company, and then introduces the Purchasing & Logistics Department where the project is performed in. Section 1.2 provides the problem description and the research questions to be answered in the following chapters. Finally, Section 1.3 describes the scope of the project.
1.1. Company Introduction
[image:10.595.102.496.415.617.2]Fugro is a Dutch multinational company providing geo-intelligence and asset integrity solutions worldwide with a focus on sustainable and efficient development. The company was founded in 1962 and currently, operates in 65 countries with 10.000 employees (Fugro, 2018c) (Figure 1.1). The headquarters is in Leidschendam, in the Netherlands.
Figure 1.1.Fugro’s five regions: revenue (EUR million), number of employees, offices in 2017 (Fugro, 2018a).
renewables, power, nautical and mining (Fugro, 2018b). Oil companies, governments and engineering firms constitute the main customer groups of the company.
1.1.1. Fleet Services
FS is the business entity under Marine Division, responsible for providing Fleet Management, Fleet Development, and Fleet Personnel services to the division. This entity regulates operations of 29 vessels and accommodates various managerial branches (Appendix A). Among the responsibilities of these branches are making profit plans for regions, planning overhaul and maintenance, carrying out engineering projects such as building or conversions of the vessels, performing vessel assurance activities, and personnel planning. Moreover, the procurement and logistics activities required to outfit the vessels are planned by the Purchasing & Logistics Department within the entity. For this project we work together with this department.
1.1.2. Purchasing & Logistics Department
The Purchasing & Logistics Department consist of eight globally operating purchasers among which one is in the role of a tactical buyer and is responsible for establishing contact and agreements with suppliers prior to the occurrence of a material or service requirement. Other purchasers, each have several vessels assigned to them and are responsible for carrying out all the purchases related to these vessels. On a daily basis, the purchasers receive material or service requisitions through the vessel crew, vessel superintendent, Maintenance and Repair Engineering or Fleet Development Departments. Then an initial set of suppliers is selected based on experience. These suppliers are asked for a quotation. Among these suppliers, a selection is performed based on cost comparison, and a PO is placed. The department is also responsible for following the orders and maintaining contact with the third-party warehouse or suppliers for the deliveries and arranging freight transportation to the vessels. We explain the operation of the department in more detail in Section 2.3.
1.1.3. From Purchasing to Procurement Project
1.2. Research Plan
1.2.1. Problem Description
Fugro has a fleet of vessels on mission in different regions around the world all the time. These vessels are required to be optimally equipped to fulfill their tasks related to site characterization or asset integrity. Moreover, the availability of goods required by the crew such as food, clothes or medicines should also be ensured. Critical spares are mainly stored onboard, but for most consumables & parts, periodical orders are planned in advance. Currently, when requests for these orders are received by the Purchase & Logistics Department, a purchasing decision is made based on experience and intuition. The degree of efficiency of this approach is not known. In Section 1.1.3 we have expressed that FS wishes to improve their global procurement operations to improve financial performance. FS has a global network consisting of a large supplier base and multiple warehouses that make it difficult to evaluate the costs of all alternative purchasing and distribution options. We aim to analyze the current practices and develop a structured model providing efficient purchasing ad logistics decisions. Therefore, we give the problem statement as:
“Fleet Services does not have a quantitatively founded purchasing & logistics practice that could ensure cost efficiency.”
Apart from the difficulties in making cost efficient purchasing and distribution decisions, we identified other challenges FS faces as the future locations of vessels are not fully known. When and in which harbor a vessel is to be supplied being unknown renders it difficult to make an optimal supply decision. That is, weather conditions or additional missions that are scheduled after an order is placed affect the performance. Purchasing and resupply planning is therefore limited to short term. The available storage space further restricts the type and quantity of SKUs (stock keeping unit) to be stored on board. Apart from purchase costs for consumables & parts, logistics costs including transportation and taxes should also be considered. The supply decisions should further take into account that the average waiting time of vessels at ports is typically short.
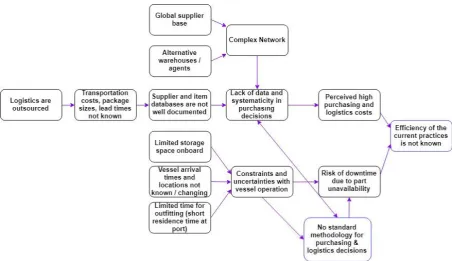
Figure 1.2. The problem cluster representing cause and effect relationships between identified problems
1.2.2. Research Objective
The desired output for the project is a model that ensures the demand is met with minimum costs. The model should determine the suppliers to submit the orders to and the optimal flow of goods in the distribution network. Therefore, we formulate our main research goal as:
“Develop a decision-making tool for consumables & parts to minimize total purchasing & logistics costs”.
We address this research objective by analyzing the current way of operation and building a tailored model for FS’s purchasing and logistics network. We further list the deliverables of this research as below:
• Insight on the current cost breakdown structure for purchasing and distribution expenses.
• A mathematical model for selecting suppliers and delivery routes for given list of orders per port call. Here, we define a port call as an intermediary stop of a vessel for loading or unloading goods. The port calls are defined along with a port location and an order list to be loaded onboard.
• An optimization tool that runs the mathematical model with generic data.
• A cost calculation tool for calculating the costs of given supply and distribution decisions.
• Analysis on the impact of the model. This analysis corresponds to insight on savings, discount and consolidation opportunities.
1.2.3. Research Questions
In alignment with the problem description and project objective, we formulate a main research question and following sub-questions to outline a solution approach. The focus is on the main research question which we define as follows:
“How to make purchasing & distribution decisions for consumables & parts to ensure efficient operation of purchasing & logistics?”
Beamon (1999), defines efficiency as minimizing the utilization of resources in the system to meet the system's objectives. Here we define efficiency as minimizing purchasing and logistics costs while ensuring all required goods are supplied. In correspondence with the research questions, we organize a research framework as described in Figure 1.3. The first step of the research is analyzing the current operation of FS (Q1). Our aim is to gain an understanding of current practices; operation steps, decisions made and motivations behind them and the limitations. We perform data analysis on purchasing, stocking and transport decisions and carry out informal interviews with members of the Purchasing & Logistics Department. We also review the project documents of the “From Purchasing to Procurement Project” to analyze the operation of the internal organization. Then, we conduct a literature review on distribution network design and study alternative modeling techniques (Q2). In alignment with the information we obtain from the literature study, we formulate a distribution network approach that is applicable to FS’s case. We then translate this approach into a mathematical model (Q3) and evaluate this model in comparison to the current situation (Q4). We address each research question separately in the following chapters.
Figure 1.3. The research approach
Q1: How are purchasing and logistics processes handled at FS? o How do items flow in FS’s supply chain network?
o What purchasing, stocking and transport decisions are made and how are they motivated? o What are current inefficiencies in the processes and what are the causes behind them? o How can the efficiency of the current performance be measured?
Q2: What theory and methodologies are presented in the literature in relation to distribution network design?
o What distribution network options are covered in the literature?
o What modeling approaches have been utilized to optimize procurement and distribution strategies?
Q3: How can a quantitative model for purchasing and logistics decisions be constructed?
o What are the quantitative and qualitative trade-offs considered for constructing the model? o How can the existing network can be translated into a mathematical model?
Q4: What are the optimal decisions for outfitting orders for the port calls? o How can the model be validated and verified?
o How are the products procured and distributed compared to the current case? o How significant are the improvement opportunities?
• What are the optimal costs of purchasing and distribution and how do they compare to the current practice?
o How sensitive are the purchasing and distribution decisions to the changes in input parameters?
o What strategies should be followed for outfitting orders for a port call?
Finally, we give a summary of our findings and conclude the paper with recommendations for integrating the model to the current way of operation.
1.3. Project Scope
We define the scope of the project to incorporate company preferences while maintaining a manageable problem size. As the demand information can be known prior to the arrival of a vessel FS does not keep any safety inventory. The products are purchased only after items are requested by the vessel crew. Only these items that were requested by a vessel are temporarily stored in the warehouse until a port call occurs. FS wants to maintain this practice to avoid excessive inventory holding costs. Therefore, we draw the boundaries of the project with the below statements:
• The model only addresses materials of type "consumables". Since these items constitute of household goods, stationary and small hardware that are consumed regularly, FS believes there is a possibility to standardize their purchasing and logistics processes. FS has already introduced periodical order groups for certain consumables in order to ensure availability onboard and reduce purchasing effort. We need to determine the optimal purchasing and delivery options for these goods. In the remainder of this paper we use "consumables" and “consumables & parts” interchangeably.
• We do not introduce a direct supplier selection methodology based on supplier characteristics. Suppliers FS has been working with already meet the quality requirements and comply with the delivery and payment conditions. Our selection of a supplier for a specific order is the result of the total purchase and distribution costs.
• FS states that for consumables & parts, all orders are met and downtime due to unavailability does not occur. We assume the suppliers have all the parts they have previously provided. Similarly, we assume suppliers have no capacity constraints as no issues over purchase quantities have been communicated before.
• We do not re-consider long term contracts and costs and include only the operational costs.
Chapter 2
Analysis of the Current Situation
In this chapter, we analyze the operation of Fleet Services with respect to purchasing and logistics decisions. We provide a description of the current situation based on PO data from 2017. We limit our analysis to 15 port calls with respect to the available data. Moreover, considering all port calls would be exhaustive and would render analyzing the results difficult. These port calls are therefore selected randomly and represent various possibilities as they have different orders and different port regions. Here, we note that due to data unavailability, we cannot give a conclusion on to what extent these port calls are representative of the whole fleet. We only refer to these to evaluate the opportunity for savings. In Section 5.2.1, we describe this selection procedure in detail when discussing the experimental design.
We consider material orders of type “consumables”. These correspond to items such as accommodation necessities, stationary and medical supplies as well as production related items such as electronic components, nuts & bolts and chemicals & gases. The chapter is organized as follows: Section 2.1 starts with an introduction on FS’s distribution network; Section 2.2 provides information on demand; Section 2.3 explains purchasing processes; Section 2.4 provides information on the supplier network and Section 2.5 presents the logistics and transportation decisions. Sections 2.6 and 2.7 explain stock keeping processes and discuss the current performance. Finally, Sections 2.8 and 2.9 mention information systems used, along with present data issues. Section 2.10 presents conclusions for the chapter.
2.1. Current Network
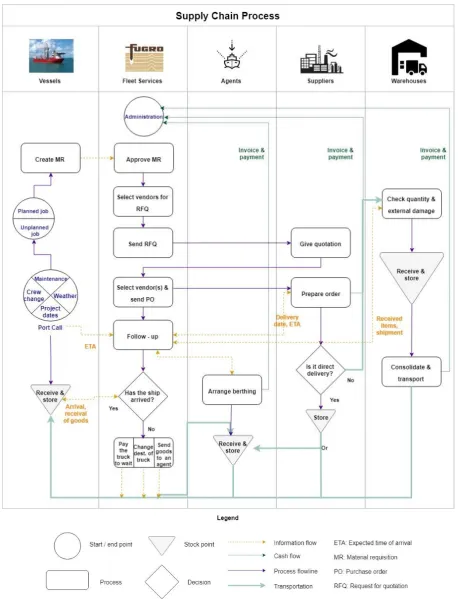
In this research we focus on FS’s global supply chain network. Items can be delivered to the vessels through different suppliers and distribution routes. FS operates in four regions namely, Europe & Africa, Asia & Pacific, Middle East and Americas. We illustrate the operation of the network in Figure 2.1 using a simplified process chart following the notation of Visser and van Goor (2004), and ISO (1985). We further explain the purchasing operations in Section 2.3.
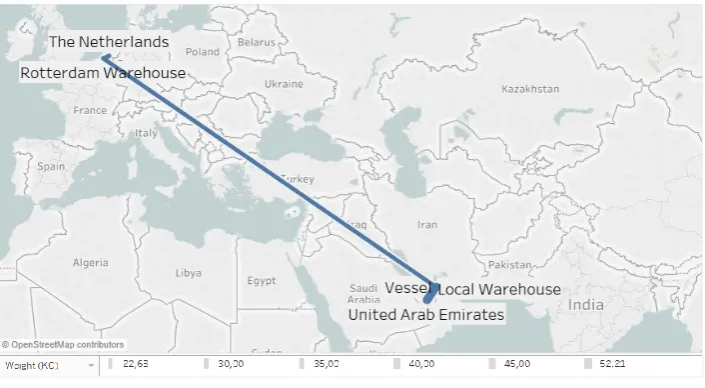
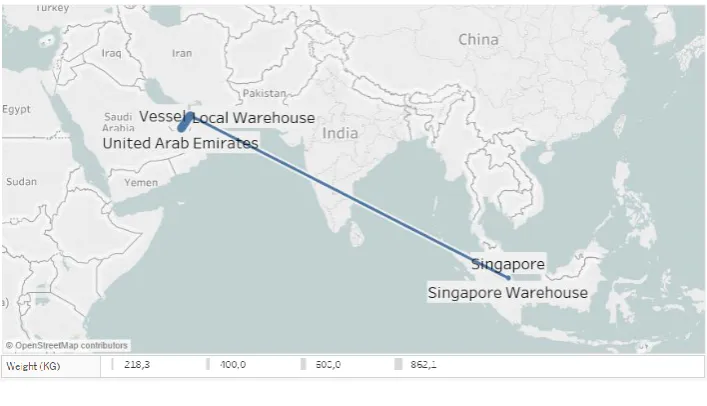
The main participants of the supply chain are: the vessels, FS (Purchasing & Logistics Department), suppliers, warehouses and agents. The vessels perform operations related to the core businesses and inform Purchasing & Logistics Department in case they need any items to be purchased for the next port call. Purchasing & Logistics Department, performs supplier selection, goes through a quote process and places POs for these items. The purchasers are also responsible for monitoring the deliveries. The suppliers are responsible for delivering the items to the specified location which may be an agent, a third-party warehouse or the port the vessel is in before the specified due date. Warehouses are responsible for receiving the goods from the suppliers and storing them until the port call. They also arrange delivery to an agent or a port. FS uses two central third party warehouses one in Rotterdam and the other in Singapore. Usually these warehouses are utilized for consolidating items before delivery to the port. Occasionally, one-time agreements can be made with local third party warehouses. Fugro operational entities can also be used as a local warehouse. FS regularly utilizes Fugro operational entities in Houston, Abu Dhabi and Macaé.
It is possible that a previously announced destination can be changed, and the vessel may arrive at a different port. In this case the same agent or other agents may need to arrange the re-location. The operation of the participants and the relations are further explained in the following sections.
[image:17.595.69.528.141.741.2]2.1.1. Distribution Options
In this chapter, we identify distribution options based on the logistics pipelines ordered goods can flow through. Considering the current purchasing and logistics practices at FS, we map applicable purchasing strategies and distribution options, and identify alternative routes for deliveries. Currently FS, purchases most items to order, that is, after the creation of a material requisition. Periodical orders are purchased for a long time period (one year or half a year) separately for each vessel. The orders are purchased for a specific port call and stored onboard, they may only be stored in a warehouse in transit before being loaded onboard. FS does not keep any safety stock but makes purchases with respect to the demand for the port call.
Table 2.1 displays the previously utilized delivery options. Combining these and all the possible configurations, we list the applicable distribution options as below and further discuss their trade-offs:
1. Supplier - vessel
2. Supplier – agent –vessel
3. Supplier – Rotterdam Warehouse – vessel 4. Supplier – Rotterdam Warehouse - agent –vessel 5. Supplier – Singapore warehouse – vessel
6. Supplier – Singapore warehouse - agent –vessel 7. Supplier – local warehouse – vessel
8. Supplier – local warehouse - agent -vessel
A decision on the delivery configuration should be made when placing orders. We distinguish between direct and indirect deliveries, the former corresponding to the deliveries made directly from the supplier to the agent or to the ports, and the latter corresponding to the deliveries made through an intermediary warehouse. We consider two alternatives for the use of a warehouse; local warehouses in the same region as the port call or the currently used central warehouses: the Rotterdam or the Singapore warehouse. As the ordered goods are not stored, the warehouses are used for cross-docking only. The warehouses only store goods for a short period of time from delivery from the supplier until the port call as the orders are placed specifically for a port call.
Direct deliveries can provide the supplier the flexibility to meet the delivery dates by planning in advance. However, if the delivery is made directly to the vessel, the admission and storage could be less efficient as there are more frequent shipments in smaller sizes coming from various suppliers. Still, these multiple shipments would be received in relatively close time periods since the waiting time at port is short.
Direct deliveries to the port are a requisite for delivery of certain goods. For example, fuel is delivered directly to the vessel since the delivery is made by barge or a specialized truck. Perishable goods such as food and medicine are also directly delivered as they require trucks tailored to fit their storage conditions. Similarly, certain chemicals that are marked as dangerous goods also need certain storage conditions and cannot be transported together with other goods due to safety regulations.
operations may be repeated since the deliveries are not synchronized. In case the agency is providing a crane service for loading based on an hourly rate, this results in extra costs. Similarly, in case there are many individual deliveries, trucks coming from the warehouses are admitted after these individual orders are cleared because they constitute of smaller orders. This results in extra charges corresponding to the waiting time of the truck.
On the other hand, delivering to the agents or using an intermediary warehouse, enables consolidating items ordered from different suppliers, so the vessel gets a single delivery. Although an increase in coordination is required, this may result in lower transportation costs as products are consolidated. However, transportation costs may also be higher than that of direct delivery if the warehouse is located far from the vessels.
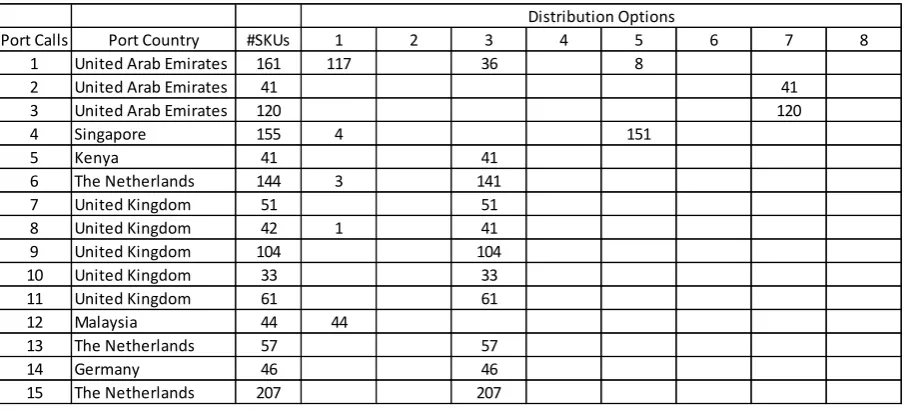
From Table 2.1, we can observe the distribution decisions made previously. As we have stated above, this observation only reflects the selected port calls and consumables & parts. We refer to each distinct item as a stock keeping unit (SKU), we can observe that the number of SKUs ordered differ for each port call. We further describe the generation of demand in Section 2.2. Rotterdam Warehouse is used quite often and for any region, in comparison to the Singapore warehouse or the local warehouses. This choice is related to the proximity of the selected suppliers to the warehouses. In Section 2.5 we also examine the supplier locations. Direct deliveries from suppliers to the vessel and the agents are also commonly used. These are a result of the available time, the agreements with suppliers or separate delivery requirements for certain type of goods as explained above. Details of the port calls in terms of the suppliers used, and the configuration of the distribution network can be found in Section 5.2.2 and in Appendix B.
Table 2.1. Number of SKUs with respect to the distribution options that have been used for the port calls
2.2. Demand
Most orders are purchased after an MR is created for some set of items while some consumables are purchased in grouped orders periodically per vessel. These periodical orders are ordered at a fixed time for a longer period. When there is demand for a certain item or service, an MR is created to trigger the purchasing process. Since, the orders are mostly placed after the demand information is known, we refer to the purchase data as “demand data” for the analysis.
Port Calls Port Country #SKUs 1 2 3 4 5 6 7 8
1 United Arab Emirates 161 135 26
2 United Arab Emirates 41 5 36
3 United Arab Emirates 120 2 118
4 Singapore 155 1 151 3
5 Kenya 41 4 17 20
6 The Netherlands 144 144
7 United Kingdom 51 2 49
8 United Kingdom 42 13 29
9 United Kingdom 104 104
10 United Kingdom 33 33
11 United Kingdom 61 1 60
12 Malaysia 44 44
13 The Netherlands 57 2 55
14 Germany 46 46
15 The Netherlands 207 207
There are planned jobs called “work orders” for the crew which correspond to “to do lists”. The items needed for an execution and their quantities are specified on the work orders. In case some of these items are not available, an MR is created by the crew. Unplanned jobs such as machine break downs or new projects also result in need for items. Requisitions can be made at the office by the vessel superintendents as well.
For frequently used consumables “periodical orders” are placed per vessel as planned in advance, these items constitute 39.12% of all the orderlines of purchases in 2017. These items are replenished one to four times per year. The order quantities are determined by the vessel crew based on experience, and there are no pre-defined re-order levels. The order quantities also depend on the convenience of re-supplying in the next destinations (in terms of price, availability, customs) and varies for each port call (Figure 2.2). For periodical orders, MRs can be created in advance. On the other hand, especially when there is an urgency or uncertainty about specifications, some requisitions are first communicated with the purchasers, and are registered in the system later.
Figure 2.2. Number of orderlines for consumables & parts for selected port calls
2.3. Purchasing Process
Purchasing & Logistics Department carries out procurement processes such as selecting vendors, asking for quotation, awarding quotes, placing orders and following the placed orders. Looking at the whole 2017 data for consumables & parts, we observed that 9.976 SKUs were bought from a total of
401 suppliers. For the purchases, 2.715 POs were issued with a total of 19.806 orderlines. This corresponds to an average of 7,29 orderlines per PO.
The demand from ship level is fulfilled through the purchasing processes. As explained above, the purchasing process starts after receiving an MR (Figure 2.1). After the MRs are created, depending on the prices quoted by the suppliers, POs are placed for the required items. A PO corresponds to a single vessel and is submitted to a single supplier, and it can cover multiple items. Items needed for different MRs can also be combined in the same PO if they are to be ordered from the same supplier.
Before asking suppliers for quotation, an initial set of suppliers are selected based on experience, past purchase history and intuition. The purchasers place an order immediately after receiving an MR to ensure the goods will be delivered on time. Usually these goods are consolidated in the warehouse in advance to ensure timely delivery to the vessel. Generally, for consumables the cheapest supplier is
207
161 155 144 120
104
61 57 51 46 44 42 41 41 33
0 50 100 150 200 250
15 1 4 6 3 9 11 13 7 14 12 8 2 5 10
N u m b er o f O rd erlin es Port Calls
selected while the original equipment manufacturer (OEM) is preferred for spare parts. If an order is expected to be more expensive than €3000, at least three suppliers are asked for quotation in order to prevent excessive orders and to ensure budget constraints are not exceeded. Moreover, each PO must be approved by a vessel superintendent. When there is more than one supplier, whether awarding the lowest-cost quote or splitting the order among the suppliers is more economical is checked to reduce expenses. This is done considering only the product prices. The information system has a function to highlight the cheapest supplier per item. Given this, the purchasers decide whether it is more convenient to split the order to have savings or whether to issue a single PO for reducing the purchasing effort. The purchasers may ask the supplier for discount if they perceive the total amount to be high. The purchasers stated that suppliers sometimes apply a 5% or a 10% discount over the total PO amount in these cases.
2.4. Supplier Information
In 2017, orders for consumables & parts were placed to 401 suppliers, in 40 countries. A large fraction of the purchase volume is sourced from the Netherlands (40,7%), followed by Germany (16,8%) and Singapore (11,4%) (Figure 2.3). Although some suppliers are original equipment manufacturers, some serve as intermediary firms. The exact purchase locations of the goods are not always known, yet transportation costs are sometimes provided by the suppliers.
Figure 2.3. Map displaying supplier locations (countries) with respect to total purchasing spend over 2017
Figure 2.4. Number of items for given number of substitute suppliers
2.5. Logistics and Transportation
A third-party warehouse located in Rotterdam is used as a central depot where most orders are received, stored in, and later consolidated to be delivered to the ships. Around 30% of all the POs were ordered to the warehouse in 2017. in case certain storage conditions or time limits should be met, some orders can also be ordered to be directly delivered to local agents. Similarly, in case of a time limit or a port arrival, items can be ordered directly to the vessel. However, since there is a long-term contract with the warehouse, transportation and holding costs for alternative locations are usually not considered when placing orders.
Transport modes are chosen by the supplier when delivering orders and by the third-party warehouse when delivering goods to the ships. Truck or airfreight can be used for deliveries. In case there is an emergency order, a courier is arranged immediately, and the delivery is arranged in the fastest way applicable, usually disregarding the cost aspects as they are not comparable to day rates of the vessels. When moving the goods from the warehouse to the ports, the transport mode is selected by the warehouse and FS receives an invoice accordingly. In case a full truck load is achieved, direct delivery to the vessel is preferred. Otherwise, the goods may be sent to a local agent for storage. If the ship does not arrive at the pre-stated time, following actions can be taken: the waiting time of the truck can be paid for, the destination of the truck can be changed, or an agent can be paid to receive the goods.
After an arrival day for the vessel is decided on, an expected arrival day is shared with the offices and is updated daily by the vessel crew. This ensures the outfitting will be planned accordingly. As we stated above, arriving to a port is referred as “port call” and can occur due to following reasons: crew changes, project start and end dates, maintenance (planned or unplanned) and weather conditions. An announced port location can also be changed in case the port does not have available space or weather conditions render it difficult to enter the port.
2.6. Inventory and Storage
In the FS database, on hand stock level is kept through following the POs and MRs. Every time a PO is finalized (items are received onboard and the invoices are paid), stock count is increased by one in the system. Similarly, after the completion of a “work order” at the vessel, the onboard stock levels of the
582
327
179 118
71 42 31 28 15 6 8 5 1 2 2 1 1 4 1 1 1
0 100 200 300 400 500 600 700
1 2 3 4 5 6 7 8 9 10 11 12 13 14 15 16 17 18 19 23 26
N u b er o f it em s
Number of substitute suppliers
items used for the job are reduced in the system. Since registering these activities in the system takes time, actual inventory levels may sometimes be different than the ones shown in the system.
As we mentioned in Section 2.2, periodical consumables are stored on board of the ships to cover the consumption for half a year or one year. Critical items are stored on board of the ships as well, the stock quantity is determined by the experience of the crew together with the recommendations of the supplier. Critical parts correspond to parts the failure of which would result in hazardous situations to the safety at sea, human safety or the protection of the environment, and are determined with respect to International Safety Management (ISM) standards. Other critical parts are ones that are critical for the continuation of the operation and are determined by the Maintenance and Repair Engineering Department. However, for most parts there is no inventory planning, and as mentioned above, orders are placed when demand is known.
The storage locations within the vessel are determined by the crew. Items received at the warehouse are reported daily. However, the packages are not checked after they are received from the supplier, and missing items may end up being registered as “received” in the system. The degree of regulation during outsourced repair and maintenance operations is not known either. For example, the party offering the service may use parts from the stock of the vessel, and this may end up not being reported. Big ships have dedicated stock keepers onboard who ensure that stock is counted and receivals are registered on system accurately. However, for smaller ships, aforementioned problems occur more frequently. As the ships are at the port for outfitting only on certain time periods, orders that are placed early wait in the warehouse resulting in warehousing costs. However, warehousing performance and inventory age are not tracked.
2.7. Current performance
Purchasing & Logistics Department adds value through ensuring the required items are procured in a cost and time efficient way. Purchasing & Logistics Department follows certain internal KPIs. For example, average number of request for quotation (RFQ) drafts should not be higher than 7 and the percentage of unmet promised deliveries has a limit of 95%.
A certain amount of saving should be made from procurement costs as well. This saving corresponds to the gain from choosing cheaper suppliers or distributing orders among multiple suppliers. However, as mentioned above, the supply chain performance in terms of warehousing or supplier lead times, which may be more important for attaining savings, is not accurately tracked. Data related issues regarding this process is further covered in Section 2.9.
Although there is no data available, it was expressed by the company that part - availability haven’t caused downtime in the past years, orders are always managed through emergency deliveries contacting the suppliers. As mentioned above, in case of urgent orders, purchasing and transportation costs may be disregarded, and stock-outs are prevented. Budget targets are calculated referring to the expense data of the last year, then foreseen expenses for additional maintenance activities and the crewing-budget are added to this amount. Budget does not serve as a hard constraint but an indicator for the business for budget allocation. The necessity of an MR is judged with respect to the available budget and purchasing decisions are made accordingly.
consolidated at a warehouse close to the suppliers and then transported to the port region. However, for Port Calls 1 and 5, the Singapore Warehouse was not used for consolidation. We observe that for port calls in Europe only suppliers in this region were considered. For port calls in Middle East or Asia, suppliers from Europe and these regions are used together.
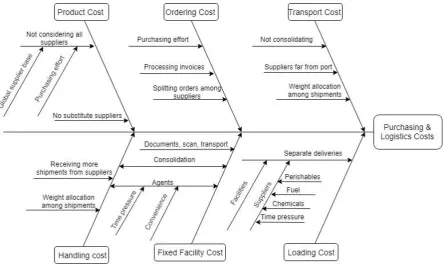
[image:24.595.80.526.355.622.2]We identify the components building up the total costs of purchasing and logistics. Combining the information in the previous chapters, we illustrate the cost components with a fishbone diagram in Figure 2.5. Below we list these costs and provide a short description. In Chapter 4, we explain in detail how these costs are quantified and applied.
• Product cost: Amount spent on the products, refers to the summation of product prices
• Ordering cost: Cost of submitting an order to a supplier, refers to the cost of personnel involving in the procure to pay process
• Transportation cost: Cost of transporting goods between locations
• Fixed facility cost: Cost of utilizing a facility per port call, refers to cost of admission and documentation
• Handling cost: Cost of handling goods at a facility
• Loading the vessel: Cost of loading each arriving shipment to the vessel, refers to the cost of the loading equipment and the personnel
Figure 2.5. Cause and effect diagram for total purchasing and logistics costs
Table 2.2. Estimated purchasing and logistics costs for the 15 port calls in the current situation
Description Europe
(9 Port Calls)
Non Europe
(6 Port Calls) Total Costs
Percentage of Total Costs Product cost: 127.535 180.139 307.674 81,2%
Transportation cost: 7.044 31.870 38.914 10,3%
Ordering cost: 13.000 6.600 19.600 5,2%
Loading the vessel: 4.200 4.800 9.000 2,4%
Handling cost: 1.334 514 1.848 0,5%
Fixed facility cost: 840 1.078 1.918 0,5%
Total cost: 153.953 225.000 378.953
We inspect the logistics costs in more detail with respect to the port locations. Here, we refer to the total cost of transportation and facilities together as logistics costs. Looking at our test cases of 15 port calls, on average, logistics costs for a port call outside Europe (5.577€) is 5,4 times more expensive than that of a port call in Europe (1.024€). As we have explained in Section 2.4, more than 50% of the purchase volume is in Europe and many products have been purchased only from Europe based suppliers. Dependency on suppliers in Europe requires more inter-continental deliveries resulting in higher transportation costs. Therefore, there may be a higher potential for savings from economies of scales for port calls outside of Europe.
2.8. Information Systems
Item information is stored in StarIPS, the database system which is available for the crew onboard. Planned works including planned maintenances of vessels, equipment trees (bill of materials) along with tactical accounts and part specifications are available in the system. The database is updated hourly. Work orders and MRs are created in this database. MRs are received and processed by purchasers and vessel superintendents through another system, StarFSM (Fleet Supply Management). This database allows creating RFQs and POs and includes a supplier database and a past purchase history per item.
Currently, there are two databases, one for purchasers (starFSM) and one for the Finance Department. The Finance Department registers suppliers when a receipt arrives. Both databases are manually filled in and this manual entry, together with the duplicity of databases, may result in double entries. The system will be changed so that only the Finance Department will have access to the database and their entries will be linked to the orders.
2.9. Data Issues
In this section some issues regarding the data accuracy are summarized. Some of them already are recognized for hindering purchasing processes. However, others are not given high attention yet. Such issues would make accurate evaluation of the performance difficult. Data on the delivery times and cost breakdown with respect to the logistics are not well documented.
some requisitions and orders are first communicated with the vessel crew / suppliers before they are officially created in the system.
Freight forwarders and facilities usually provide an overall quote, and the tariff structure and the pricing criteria used is usually not clearly presented. In Chapter 4, we describe the assumptions we made and limitations regarding data availability. Spend amounts may also be wrongly entered in the system. When a PO is created, costs given in the quotation are considered. Invoices are booked later after the completion of the delivery. However, it happens relatively often that the PO amount and the invoice amount do not match. This could happen because of errors with manual entry, suppliers updating the quotations or transportation costs being added later.
2.10. Conclusion
This chapter allowed us to answer the first research question: “How are purchasing and logistics processes handled at FS?”. We observed that FS does not have a standard methodology for selecting suppliers nor distribution options. The discounts are attained rather randomly and possible discount options that could arise from purchasing larger quantities from the same supplier are not considered when placing orders. Similarly, economies of scales in transportation, or agency and warehousing costs arising from consolidating shipments are not accounted for in advance. We observed that procurement costs constitute 81% of the total costs followed by transportation costs that correspond to 10%. We contemplate that procurement and freight discounts present an opportunity for improvement and should be taken into consideration systematically.
Chapter 3
Literature Review
The problem described in Chapter 2 can be summarized as not having a method for evaluating alternative purchasing and distribution options. To determine how to select purchasing and distribution strategies for FS, we perform a literature study. We give a brief introduction in Section 3.1., with basic information on global sourcing and trade-offs in distribution networks which reflects the conceptual background of this research. Here we explain the trade-offs between the options we identified in Chapter 2. Next, in Section 3.2. we explain related work on network optimization and illustrate classical supply chain design models. We conclude this chapter in Section 3.3 by presenting the solution methodology that will be followed.
3.1. Introduction
Supply chain is a complex network of all facilities and organizations involved in moving a product or service from the manufacturer to the customers. Simchi-Levi et al. (2003), define supply chain management as a set of approaches utilized to efficiently integrate suppliers, manufacturers, warehouses and stores, so that merchandise is produced and distributed at the right quantities, to the right locations, and at the right time, in order to minimize systemwide costs while satisfying service level requirements. The efficient operation of the company depends on the procurement decisions and the pipeline structure of the distribution network (Ross and Jayaraman, 2008).
3.1.1. Global Sourcing
Acquiring part or all of the required goods from suppliers from countries all over the world has become a trend as it yields to cost controls and possibility to attain savings (Crainic et al., 2013). This worldwide integration of engineering, operations and logistics to meet procurement requirements is defined as global sourcing (Trent and Monczka, 2003). Acquiring goods from countries with low manufacturing costs and tailoring logistics networks accordingly has become usual practice for many industries (Crainic et al., 2013, Christopher et al., 2006). Still, Christopher et al. (2006) states that low cost sourcing strategies can result in high-cost supply chain outcomes. They emphasize that the transportation costs should not be overlooked. Network operations require costs to be considered along with transport and lead time efficiency. When evaluating supply chain performance, Simchi-Levi et al. (2003) emphasize that a systems approach should be taken, and all stages should be considered together.
3.1.2. Distribution Network
products flowing down each channel to the destination have been determined by intuition (Christopher et al., 2009).
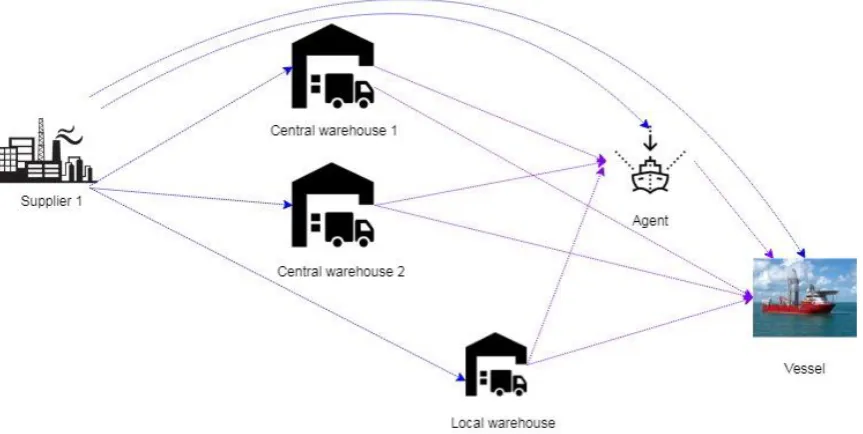
Combining the distribution network design classifications made by Chopra and Meindl (2014) with practices followed by FS, we group the distribution options in three configurations: (1) supplier storage with direct shipping, (2) supplier storage with direct shipping and in-transit merge and (3) distributor storage with last-mile delivery (Figure 3.1). Suppliers delivering directly to the vessel corresponds to the first option. FS uses warehouses and agents for transit. Long term storage is not used, and no safety stock is kept, therefore utilization of the facilities corresponds to the second option.
Figure 3.1. Distribution network configurations
With supplier storage with direct shipping, the items can be shipped directly from the supplier to the vessels. Since the orders are placed on demand and per vessel, the supplier would keep the inventory separately. Therefore, there is no risk pooling advantage for the supplier, yet this gives the supplier the opportunity to plan in advance and manage their internal lead time more efficiently (Simchi-Levi et al., 2003). This configuration generally requires significant investment in information infrastructure as synchronization is needed among different stages of the supply chain (Chopra & Meindl, 2014). A disadvantage of supplier storage with direct shipping could be that the items ordered from different suppliers are not consolidated, and the receival and storage could be less efficient for the vessel as there are more frequent shipments in smaller sizes. Still, these multiple shipments would be received in relatively close time periods as the vessel is at port only for a short time.
Unlike the first option, under which each product in the order is sent directly to the vessels, supplier storage with direct shipping and in-transit merge combines pieces of the order coming from different suppliers, so the vessel gets a single delivery. The process is completed relatively fast and no inventory is kept. Although an increase in coordination is required, in-transit merge may decrease transportation costs relative to direct delivery by aggregating the final delivery. Still, higher overall handling costs are incurred. This network configuration is also referred as cross-docking (Simchi-Levi et al., 2003). Gue (2007), states that cross-docking is applicable when customers are willing to wait for their orders. Since, in our case the vessels have to wait until arriving to a port to be re-supplied, this configuration may be applicable. Moreover, both option 1 and option 2, can help shifting the storage costs to the supplier while giving the supplier flexibility to meet the delivery dates by planning in advance (Ross and Jayaraman 2008).
3.2. Supply Chain Network Optimization
3.2.1 Supply Chain Model Classification
Supply chain models incorporate many levels regarding the mathematical formulations and managerial aspects. To classify the problem at hand, we refer to Huang et al. (2003) and Mula et al. (2010). Huang et al. (2003) proposed four criteria for classification, namely, supply chain structure, decision level, modeling approach and shared information. Here, we refer to the first three as we do not consider information sharing between the different participants in the supply chain.
The supply chain structure refers to the relationships between the organizations in the supply chain. Four types of network structure can be defined as below (Beamon and Chen, 2001, Mula et al., 2010):
• Convergent: each location in the chain has one successor and non or several predecessors.
• Divergent: each location has one predecessor and non or several successors.
• Conjoined: a combination of each convergent chain and one divergent chain.
• Network: this cannot be classified as convergent, divergent or conjoined, and is more complex than the three previous types
Decision levels are mainly classified by the extent or effect of the decision to be made in terms of time (Mula et al., 2010). In supply chain network problems, the strategic level covers decisions made in relation to selecting number, capacity and location of facilities as well as contracting decisions. The tactical level corresponds to determining the distribution planning, transportation modes, amount and type of purchases and managing safety inventories. Finally, replenishment and delivery operations are made at the operational level (Huang et al., 2003, Farahani et al., 2014). Linear programming, fuzzy programming, stochastic programming and, heuristic algorithms have been used for network optimization problems (Huang et al., 2003, Mula et al., 2010).
Given above, we identify the model we present in this research as a network structure as we have a multi-echelon network with flows going skipping or through intermediary steps as we identified in Chapter 2. The model will serve for tactical planning as the decisions concern submitting purchases and determining the distribution of the purchased items through the facilities. We follow an exact approach and formulate the problem as a mixed integer linear programming model in Chapter 4.
3.2.2. Related Work
First, we give an outline of the literature review process and explain how the articles relevant to our research were selected. We primarily used Scopus as the literature database as it includes articles from many publishing portals such as Elsevier, Taylor & Francis, Wiley or Emerald. We list the search terms used below. We initially make an abstract review on these primary resources to assess their relevance and, then also review the relevant references listed in these articles. We used Google scholar for articles that were not accessible via Scopus.
• "distribution network optimization" AND "supply chain"
• “distribution network design” AND "supply chain"
• "supply chain network design" AND distribution
• “supply chain network optimization”
• “supply chain network design problem”
• “supply chain” AND “network models”
Supply chain network design (SCND) problem aims to construct an efficient network structure or to reengineer an existing network (Gan et al., 2014). The network structure to be determined may correspond to the number, location or capacity of manufacturing or distribution facilities. After the network structure is determined, the flow of the goods in the network is optimized. The goal is to make this decision while meeting demand requirements of the network. These decisions concern various costs such as shipping cost, resource cost, manufacturing cost, advertising cost, and ordering cost. Most related studies in this area selects minimization of total costs as the objective (Ebrahimi, 2018). Integrated models, considering decisions on production, inventory and distribution simultaneously are studied widely in literature (Mula et al., 2010).
Owing to the high importance of the SCND, there are a relatively large number of review papers in this field. Farahani et al. (2014), propose a comprehensive review for the SCND in different categories such as solution approaches, model types, and applications. Melo et al. (2009), compare various articles on facility location with respect to supply chain structure, planning period, decisions considered and application area.
There are many studies using exact mathematical techniques. Linear programming is widely used for network optimization problems (Mula et al., 2010). Karabakal et al. (2000), customized the facility location model to generate acceptable scenarios minimizing the costs of transportation and facility operation for the number and location of automobile distribution and processing centers. Gümüş and Bookbinder (2004), present a linear programming model to minimize total costs of operation and transportation in a three- echelon network, consisting of manufacturers, cross docks and customers. Graves et al. (2007), combines freight consolidation with network design. They formulate an integer linear optimization model to decide on the number, location and operation of consolidation hubs minimizing the total logistics costs for the network. De Keizer et al. (2014), developed a mixed integer linear programming model to investigate the benefits of logistics orchestration in three scenarios. In these scenarios, the effects of network design and logistics consolidation on logistics costs, working times and carbon dioxide emissions are quantified.
Apart from exact models, heuristic models providing near optimal solutions are widely presented for SCND problems. Heuristics algorithms are preferred when the model size is large, and an exact solution cannot be obtained with commercial solvers in an acceptable time (Eskandarpour et al., 2017). Altıparmak et al. (2006), presented a multi-objective model that tries to minimize the total cost and maximizes the customer service and equity using to determine which candidate facilities to operate and the shipment quantities between them. They developed a genetic algorithm (GA) based on new solution procedure to find the set of Pareto-optimal solutions and show that their developed GA has a better performance compared to simulated annealing. Ross and Jayaraman (2008), presented a location planning model for the cross-dock and distribution centers using simulated annealing. For their network, they conclude that simulated annealing should be combined with TABU search for results with better solution time, quality, and convergence. Sarrafha et al. (2015), developed a multi-periodic SCND integrating procurement of raw materials from suppliers with production and distribution. They incorporate a flow-shop scheduling model in manufacturing part and propose a bi-objective model minimizing the total supply chain costs as well as minimizing the average tardiness of product to distribution centers. They developed a novel algorithm, called multi-objective biogeography-based optimization with tuned parameters to find a near-optimum solution.
capacitated (fixed- charge) facility location model and the minimum cost network flow problem. As explained above, we give a customized network model with intermediary locations. The decision whether to operate facilities correspond to the decision of using them for a port call in our case. The purpose of our model is also minimizing total cost of item flows and we model our network as a directed graph.
3.2.3. Classical Network Optimization Problems
The capacitated facility location model
The capacitated (fixed- charge) facility location model is a classical optimization model that focuses on minimizing the cost of meeting demand while satisfying capacity constraints of each candidate plant (Chopra & Meindl, 2014). Whether the plants will be operated and what will be the flow from each plant to a customer are the main decisions addressed by the problem. Below we provide the typical formulation of the model:
The decision variables 𝑦𝑖 represents whether plant 𝑖 is open and, 𝑥𝑖𝑗 the quantity shipped from plant
𝑖 to market 𝑗. 𝑓𝑖 is the annual fixed cost of operating facility 𝑖, and 𝑐𝑖𝑗is the cost of producing and shipping one unit from plant 𝑖 to market 𝑗.
Objective:
min ∑ 𝑓𝑖 𝑖𝑦𝑖+ ∑ ∑ 𝑐𝑖 𝑗 𝑖𝑗𝑥𝑖𝑗 (1)
subject to:
∑ 𝑥𝑖 𝑖𝑗= 𝐷𝑗 ∀ 𝑗 (2)
∑ 𝑥𝑗 𝑖𝑗 ≤ 𝐾𝑖𝑦𝑖 ∀ 𝑖 (3)
𝑦𝑖 ∈ {0,1} ∀ 𝑖 (4)
𝑥𝑖𝑗 ≥ 0 ∀ 𝑖, 𝑗 (5)
The objective function minimizes the total costs of operating the plants and the network. Constraint (2) ensures the demand at each market is satisfied. Constraint (3) states that no plant can supply more than its capacity.
Minimum Cost Network Flow Problem
Figure 3.2. A general flow network
If the goal is to determine a least cost shipment of a commodity through a network in order to satisfy demands at certain nodes, the problem is named as minimum cost flow problem. The flow problem is called a multi-commodity flow problem if there are multiple flow demands (Ahuja et al., 1993). This can correspond to demand for multiple SKUs in a logistics network. To formulate this problem mathematically, the following notation is used. The notation is based on graph theory as a flow network can be modeled as a directed graph and written as a linear model (Ahuja et al., 1993, Bompadre and Orlin, 2008).
We set G = (N, A) as the directed graph defined by the sets N of n nodes and A of m arcs. Arcs are in the form of (i, j), i representing the start node and j, the end node. Each arc (i, j)∈ A is associated with a cost per unit flow, Cij and a capacity Uij. There are commodities represented with k and the supply/ demand for commodity k is represented by bk. Finally, the decision variable is 𝑥
𝑖𝑗𝑘, the flow (quantity) of commodity k transported on arc (i, j)∈ A.
Objective:
min ∑(i,j)∈ A∑ 𝑐𝑘 𝑖𝑗∗ 𝑥𝑖𝑗𝑘 (1)
subject to:
∑ 𝑥𝑖𝑗𝑘
𝑘 ≤ 𝑢𝑖𝑗 ∀ (𝑖, 𝑗) ∈ 𝐴 (2)
∑ 𝑥𝑖𝑗𝑘 − ∑ 𝑥𝑗𝑖𝑘 = 𝑏(𝑖)𝑘 (𝑗,𝑖)∈𝐴
(𝑖,𝑗)∈𝐴 ∀ 𝑘 ∈ 𝐾, 𝑖 ∈ 𝑁 (3)
0 ≤ 𝑥𝑖𝑗𝑘 ≤ 𝑢𝑖𝑗𝑘 ∀ 𝑘 ∈ 𝐾, (𝑖, 𝑗) ∈ 𝐴 (4)
Constraint (2) ensures that the arc capacity is not exceeded. Constraint (3) is referred to as mass balance constraints. The first term in this constraint for a node represents the total outflow of the node (i.e., the flow emanating from the node) and the second term represents the total inflow of the node (i.e., the flow entering the node). The mass balance constraint states that the outflow minus inflow must equal the supply/demand of the node. Constraint (4) states that the capacity restriction for each commodity on each arc should be met.
3.3. Conclusion
In this chapter, we carried out a literature review to answer our second question “What theory and methodologies are presented in the literature in relation to distribution network design?”. We observe that there are many studies on supply chain network optimization using exact or heuristic solutions, but customized adjustments might be necessary to accurately model the network we have at hand. Since the available facilities are pre-determined, our goal is to optimize the flow of demanded items through suppliers and these facilities. The method we use for purchasing and delivery decisions must be able to incorporate the distribution options we have identified in Chapter 2, must account for economies of scales and minimize the total costs.