Adoption of online music
Differences between the Netherlands and Germany
By Dominik Deiters S1239317
University of Twente: Dr. ir. Ton Spil
Dr. ir. Christiaan Katsma
TU Berlin: Innovation Management & Entrepreneurship
1
Abstract
The rapid growth of Internet technologies changed the music market drastically. New ways to share music between consumers without paying fees let the sales of the music industry decrease, but on the other side provided an opportunity to offer new music products and services to its customers. The legislations of the Netherlands and Germany reacted differently to these developments.
2
Index
ABSTRACT 1
1 INTRODUCTION 4
1.1 DEFINITION:ONLINE MUSIC SERVICES 4
1.2 LEGAL SITUATION IN GERMANY 4
1.3 LEGAL SITUATION IN THE NETHERLANDS 7
1.4 QUALITY DIFFERENCES 9
1.5 THE ROLE OF ONLINE MUSIC 10
2 RESEARCH QUESTIONS 11
3 ELECTRONIC LITERATURE REVIEW 12
4 THEORY 14
4.1 DIFFUSION THEORY 14
4.2 TECHNOLOGY ACCEPTANCE MODEL 16
4.3 COMBINING DIFFUSION THEORY AND TAM 17
5 METHOD 18
5.1 SURVEY QUESTIONS 21
5.2 USING GOOGLE DATA TO REFINE USAGE QUESTIONS 22
5.3 INTERPRETATION OF OPEN QUESTIONS 25
5.4 REASONING OF ADOPTION OF TAM AND IDM TO MUSIC SERVICES 26
5.5 SURVEY 27
6 RESULTS 28
6.1 USAGE OF MUSIC 29
6.2 ONLINE SERVICE POPULARITY 32
6.3 TAM ANSWERS 35
6.4 PERCEPTION OF FUTURE USAGE OF MUSIC SERVICES 40
7 DISCUSSION 43
7.1 DIFFERENCES BETWEEN BOTH COUNTRIES 43
3
8 LIMITATIONS 49
9 CONCLUSION 50
10 OUTLOOK 51
A Appendix 53
A.1 Private copying levies in Germany 53
A.2 Private copying levies in the Netherlands 53
A.3 Screenshots of the online survey 54
A.3.1 Start web page with welcome text 54
A.3.2 First question page 55
A.3.3 Second question page 56
A.3.4 Third question page 57
A.3.5 Forth question page 58
A.4 Answers to the open Question 24 59
A.4.1 Grouped German answers 59
A.4.2 Grouped Dutch answers 61
A.5 Survey Results 61
A.6 SPSS Results 61
A.6.1 Germany 61
A.6.2 Netherlands 65
B Bibliography 70
4
1
Introduction
1.1
Definition: Online music services
The term digital music is often used in connection with Internet and audio entertainment (Peitz, 2005; IFPI 2012). It has the disadvantage of ambiguity. On one hand, digital music is understood as technical description of how the music was recorded or saved. On the other hand it is used as term for music which is shared, streamed and sold in the Internet. This paper avoids this term in order to avoid imprecise statements.
A much more appropriate term for digital music would be online music, as it refers to the connection with the Internet, and implies that the file format must be digital. The term online music is still too blurry, because it does not describe in which context online music is used. Leonhard (2008) points out that music shifts from music as a product to music as a service, especially in the context of the Internet. Therefore the term of services is added, creating the term online music services.
Online music services are services which enable users to access and listen to music via the Internet. This includes any form of music storage, streaming and distribution services, but excludes services which are only supplement services like music lyrics. These days another term is combining online and service within one word: cloud. Cloud music would be also appropriate, but this term is misused by companies for their product in several ways and thus waters down the precise definition.
1.2
Legal situation in Germany
5 RapidShare AG and Google Inc. with their product YouTube, faced problems with their business models in Germany.
Publishing music without having the proper licenses of the author is punished by the German copyright law with 3 years imprisonment or alternatively with a fine (§106 Abs. 1 UrhG). §2 of this law adds that even the attempt of trying to infringe the copyright is punishable (§106 Abs. 2 UrhG).
While it is very inefficient to sue each case of piracy before a German court, there is another way for authors to claim their losses. Owners of the copyrighted material are allowed to send a so-called “Abmahnung” via a lawyer who is a demand to compensate potential losses because of piracy (Härting, 2005). The “Abmahnung” charges not only this compensation, but also the costs for the lawyer who was needed to set up this letter. The “Abmahnung” is usually accompanied by a contract which forces the accused party to stay away from pirated material, otherwise a much higher fine has to be paid.
Companies and lawyers are currently abusing this system, demanding much higher compensations than a court would approve. Being guilty of uploading one music file is charged with a 650 € fine, which not only generates an income for the suing party, but should also deter people from piracy (Haak, 2010). Due to the high costs for citizens, a new law for this system is currently in progress which should limit the maximum costs for the first offence of Internet piracy (Kremp, 2012).
6 current court rulings, judges agreed that a peer-to-peer upload is an upload to an unlimited amount of people, and that the value of claim is worth several thousand euros.
There is one special case in which copies are allowed: Copying for private usage is allowed in Germany, as long as it is only one copy and no copy protections are circumvented. In 1964, Germany introduced a levy on recording devices and media to compensate for the losses private copying is causing (Helberger, 2012). In the following years all other European countries introduced similar regulations except for Great Britain and Ireland. A list of current charges on recording devices and media can be found in Appendix 10A.1.
The German copyright laws are not only affecting private persons, they also affect companies and their business models. Several streaming or data storage companies are facing issues with German copyright, due to the so called “Störerhaftung”. This expression means that companies which enable customers to commit copyright infringements by making files public are also guilty. In a popular lawsuit Constantin Film against RapidShare, the court supported the media company’s claims. RapidShare is offering a very easy-to-use file exchange service. Customers only need to visit the main page, select a file on their computer for uploading and press a button. This process generates a link, which can be shared with others, enabling them to download the uploaded files. Some users had used this service to share copyright-protected content. RapidShare was already using an automated system which compared the uploaded material to reference files of copyright protected material. The court ruled in the end that these measures were not sufficient (Büscher, Bornkamm, Schaffert et al., 2013). RapidShare has been forced to scan the Internet for websites offering copyright protected material which has been shared on rapidshare.com (Sawall, 2012).
7 rights organization in Germany, which has the exclusive rights to protect the majority of musicians against piracy, while collecting money for every public usage of music of its members. GEMA was founded in 1902, got renamed in 1933 as “Staatlich genehmigte Gesellschaft zur Verwertung musikalischer Aufführungsrechte” (STAGMA) and was renamed GEMA again after the Second World War. GEMA takes cares of the collection and the negotiation of royalties for any public music performance and reproduction.
In the negotiations between GEMA and YouTube, GEMA requested a fee that was much higher than similar fees in other countries. On its website GEMA claims that in Great Britain only 0.0001185 € per stream are paid. This would sum up to 120 € for 1 million video views, which is not considered sufficient by GEMA (Guerges, 2011). While the details of the negotiation were kept secret, the license fees requested by GEMA are between 0.006–0.12 € per video stream (Rundfunk, 2012). YouTube refused to pay these license fees and lost at court against GEMA. Any further infringements of copyright would be costly for YouTube. The court ruled that it is the duty of YouTube to scan permanently for any copyright infringements, which includes not only the original version, but also all cover versions or live versions. Furthermore, GEMA is allowed to report further copyright infringements in any way – even via a phone call — and YouTube has to react immediately (Krempp, 2012a). As a result of these incidents, many videos are blocked from view in Germany. Even videos which contain merely a little part of any copyright-protected music by GEMA are blocked completely.
1.3
Legal situation in the Netherlands
8 In the Netherlands, the Stichting de Thuiskopie has been charged by the ministry of law with the collection of the copyright levy fees. Till the end of 2012 the Stichting de Thuiskopie was only charging fees for media, but not devices. On December 25th the Dutch government announced
a new law for copyright levies which also included a moderate fee for devices. The fee for a PC is 5.00 €, compared to 17.06 € in Germany (cf. Sec. A.2). The new copyright levy on devices covers the losses caused by illegal file sharing of media. The Dutch department of law clarified in January 2013 that it does not plan any further levies or restrictions, because private copies are already covered by the current copyright levy and the right of a private copy (Teeven, 2013).
The Dutch counterparts of the German GEMA are the Vereniging Buma and Stichting Stemra. These two organizations form together the collecting society for the Netherlands. In contrast to the German GEMA, Stichting Stemra was able to license music to all major Internet platforms, including YouTube or Grooveshark, and therefore these two platforms are available with their complete media content and services.
9 The Stichting Brein (Bescherming Rechten Entertainment Industrie Nederland) is an organization which represents Vereniging Buma / Stichting Stemra and several other organizations as well as companies within the entertainment industry. They had a successful lawsuit against
ThePirateBay.se – one of the largest file sharing portals – which led to a blockade of the website within the Netherlands at most ISPs (Internet service providers). The judges ruled that ThePirateBay.se is mainly used for criminal activities and thus it has to be blocked by the ISPs (Rechtsbank ‘sGravenhage, 2012).
1.4
Quality differences
In 1980 Philips announced the invention of the Compact Disc Digital Audio (CDDA), which became the standard for Compact Discs (CD) with audio content. With this invention, the rise of digital music began in 1982 and soon surpassed the sales of phonograph records. The CDDA uses a data transfer rate of 1411.2 kbit/s to achieve its quality (Peek, Bergmans, van Haaren et al., 2009). After 1990, there was a rapid transisition from analogue modem technology (9.8–56 kbit/s) via ISDN (64–128 kbit/s for private connections) to DSL variants (recently up to 100 Mbit/s). Even in the early 90s it became clear that the feasibility of hearing music online was only a matter of time.
10 companies like Sony or Spotify are able to offer streaming services which are offering CDDA-like quality while using only a fraction of a common broadband connection.
1.5
The role of online music
The first successful implementations of online music were blamed for a fundamental crisis within the music business (Fetscherin, 2004). Some researchers argue that the digitization of music is a disruptive innovation (Moreau, 2013). Platforms like Napster or Kazaa offered free services, which allowed users to share their digital files with each other. While the majority of the music industry did not know how to cope with this emerging market, Apple introduced its MP3-store iTunes in 2001. It grew with tremendous speed, achieving a 70% market share of all sales of music within the Internet (Bakker, 2005).
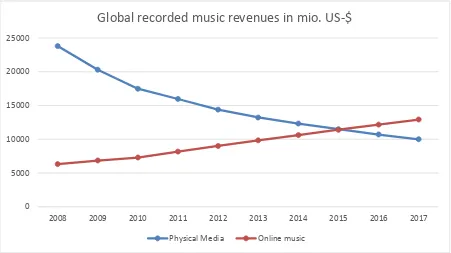
Within the following years, the revenues of online music kept increasing, while the sales of physical media were showing a steady decline. According to recent studies from PricewaterhouseCoopers International LLC, the revenues of online music will surpass those of physical media in 2015, as can be seen in Figure 1 (pwc, 2013) and as it has been suggested in some scientific studies (Peitz & Waelbroeck, 2005). Due to the enourmous success of online music, the global music industry celebrates its first year of growth after a long time of decline (IFPI, 2013). One of the most active fields of growth are online music streaming services, which had grown by 40% in 2012 according to Siemer & Associates (Siemer & Associates, 2013).
11 Figure 1: Composition of global recorded music revenues according to pwc international (pwc, 2013).
2
Research questions
According to the previous sections, the music industry in Europe is undergoing a drastic change. The statisticians predict increasing adoption rates of online music and a steady decline of physical media. Within this climate of change, regional governments have different ways of protecting the music business on the one hand and promoting Internet usage on the other hand. Even though Germany and the Netherlands are neighbours, their approaches are fundamentally different. This leads to the following research questions:
What are the differences in digital music services adoption between Germany and the Netherlands?
o What is the actual state of digital music services adoption in Germany and the Netherlands?
o How satisfied are customers with current music services? o How will music services develop in the future?
0 5000 10000 15000 20000 25000
2008 2009 2010 2011 2012 2013 2014 2015 2016 2017
Global recorded music revenues in mio. US-$
12
3
Electronic Literature Review
The literature review was conducted with help of WebOfKnowledge (Thomson Reuters, 2013) and Publish or Perish (Harzing, 2007). For WebOfKnowledge (WoK) default settings were used, and no limitations in years or any other options were set. Furthermore, the search terms were entered as “topic” to find as many relevant papers as possible. If more than 150 papers were found, the research domain was restricted to economical and business domains as a next step. The titles of the remaining papers were checked for relevance. For example, papers which obviously addressed security issues and their technical solutions were excluded from further investigation. At least the abstract of the remaining papers was read in order to decide, wether any relevant information for this study could be found within those papers.
Publish or Perish was used to search for relevant publications via Google Scholar. If there were more than 150 results, only results with a sufficient h-index were considered. The procedure for further investigation was similar to the one used at WebOfKnowledge.
Search term(s) for WebOfKnowledge Results relevant papers
“Online music” / “music online” 158 15
“music streaming” / “streaming music” 32 2
“Music piracy” 134 114
“Media adoption” / “adoption of new media” 44 6
TAM music 14 1
IDM music 0 0
[image:13.595.59.524.461.691.2]Innovation music 473 10
13 The literature about adoption of new music technologies is scarce, hence a closer look at how far the adoption of online music has gone is an important addition to the current literature. There are plenty of studies analyzing the positive and negative effects caused by music from illegal sources, but only very few deal with newer trends like streaming of music. According to Aguiar and Martens (2013), there is merely one empirical study besides theirs which has analyzed the effects of music streaming on music purchases.
Search terms “online music” and “music online” yielded a total of 158 results at WoK which is surprisingly little. Most of those results were not relevant for this study, merely 15 studies were connected to music in a relevant way based on their topics. Publications like “The Portrayal of Migraine in Popular Music: Observations and Implications” deal with online music, but they focus on other aspects of music–in this case the medical influence of music. The results become even worse if the topic was narrowed down to the streaming of music. The search term “music streaming” lead to 15 results at WoK which were all related to technology, but not to social sciences. If the words in the search topic were reversed (“streaming music”), merely 17 results could be found, but only two of them were relevant for this topic according to their title. One is an article in the Fortune magazine, the other explains the business model of “freemium” for companies which stream music.
14 It turns out that, at the time of the literature survey for this work, the adoption of new media and music in particular has been researched to a rather limited extent only. Most studies concerning these topics analyze the influence of piracy (Jeong & Lee, 2010; Jeong, Zhao & Khouja, 2012; Dörr, Wagner & Benlian, 2013; Geng & Lee, 2013).
4
Theory
This chapter explains the main theories this study is based on and adapts them to create one comprehensive model, which is used for the survey and its results. Firstly, the process of diffusion of innovations is explained. Secondly, the technology acceptance model (TAM) is introduced. Finally, both models are merged into one model.
4.1
Diffusion Theory
The theory of diffusion of innovation by Rogers (1983) is explained in the following section. Rogers defines diffusion as “process by which an innovation is communicated through certain channels over a period of time among the members of a social system” (Rogers, 1983). This process consists of four different stages. They are called: knowledge, persuasion, decision, implementation and lastly confirmation.
z
Image 1: Diffusion process according to Rogers (1983).
The first phase of the process is knowledge. The individual has discovered an innovation, but has no further information about it. The phase is shaped by two different variables. The first one is
Persuasion
Knowledge Decision Confirmation
• Relative Advantage
• Compatibility
• Complexity
• Trialibility
15 the “receiver variable”. This variable describes the internal factors of an individual and how it is reacting to innovation. Factors like the attitude towards change or social characteristics of a person influence the receiver variable and form the first group of factors. The second group are the social system variables. These are external influences, like social norms or tolerance of deviance.
The second phase of the diffusion process is called persuasion. The individual, which has detected an innovation in the first phase, is now gathering information about the innovation. There are five “perceived characteristics of innovation”: relative advantage, compatibility, complexity, triability and observability, which determine on the decision to adopt or decline the innovation. Relative advantage is about the added value which the innovation delivers, compared to the previous generation of the product. Without any additional benefits it is unlikely that an individual is going to adopt an innovation. The second one, compatibility, is about the ability of the product innovation to be adopted by a person; compatibility describes whether the innovation fits or does not fit into an existing environment. A car for example, should fit into the garage; if it does not fit, this is a strong argument against a potential adoption. The third one is complexity, which describes as how complex an innovation is seen. A higher simplicity increases the likelihood of the adoption of an innovation, while complexity decreases it. The fourth factor is triability. The possibility to test and experiment with an innovation, before it is going to be adopted or bought, leads to higher adoption rates. The last factor is observability. Innovations which can be seen by others and thus create a social feedback, lead also to higher adoption likelihood. Those five factors also describe the rate of adoption according to Rogers.
16 discontinuance, due to a replacement for example. Similary, a rejection can lead to a later adoption or a continued rejection.
The last phase in the diffusion process is called confirmation: the adoption finally takes place as the product or technology is used.
All four phases of the diffusion theory are also influenced by communication sources. Different channels like TV advertisement or friends can alter the results in each phase. A friend, who is convinced of the benefits of a certain product, presents a product in another manner than a TV advertisement could do, and thus may alter the decision, particularly because most of the factors are about intentions and perceived values.
4.2
Technology Acceptance Model
The Technology Acceptance Model (TAM) was developed in 1989 by Davis (Davis, 1989). It is based on the “theory of reasoned action” (Liska, 1984; Ajzen, Fishbein & Heilbroner, 1980) and extends its scope to the technological sector. While the theory of reasoned actions was based on elements of attitude and subjective norms, these variables were exchanged with perceived usefulness and perceived ease-of-use by Davis.
The likelihood to adopt a technology depends on its perceived usefulness and perceived ease-of-use, so both variables influence the attitude towards using a specific technology. The first one describes benefits an individual expects from the new technology. The latter one, perceived ease of use, is the perception of simplicity of using a specific innovation. The perceived ease of use also has direct influence on perceived usefulness. If a product is seen as very complex, this decreases its perceived usefulness.
17 the intention to use a product are influenced by the perceived usefulness. The intention can lead to an actual system use, which means that an individual buys and uses a product and thus adopts the technology successfully.
Figure 2: Technology Acceptance Model according to Davis (1989).
4.3
Combining Diffusion Theory and TAM
Within this section, the diffusion theory by Rogers and the TAM by Davis are merged to one comprehensive model.
Based on empirical research, Rogers´ five perceived characteristics of innovation do not consistently lead to adoption. Researchers could only find evidence for a consistent connection to adoption for: relative advantage, compatibility and complexity (Agarwal & Prasad, 1998; Tornatzky & Klein, 1982). Thus the model can be simplified by omitting triability and
observability, before it is merged with TAM.
The constructs used in TAM can be found within the model of diffusion of innovations, according to many studies. Moore and Benbasat (1991) explain within their study: “The similarities between these constructs [perceived usefulness and perceived ease of use] and Rogers´ perceived relative advantage and perceived complexity are clear” (Moore & Benbasat, 1991). Plouffe et al. (2001) argue that “the set of constructs used in TAM is essentially a subset of those proposed by PCI”. Most researchers agree that those constructs are similar or even the same
Perceived usefulness
Perceived ease of use
Attitude toward using
Behavioral intention to
use
Actual system use External
18 (Wang, Meister & Wang, 2011; Adams, Nelson & Todd 1992; Agarwal & Prasad, 1998; Wu & Wang, 2005). Wang et al. (2011) identify some exceptions, but they do not apply to this research.
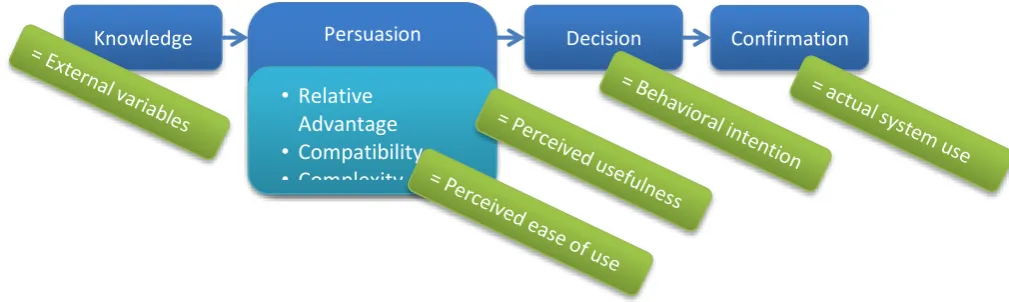
[image:19.595.72.577.401.552.2]According to this research, the TAM by Davids can easily be matched with the diffusion model by Rogers. The first phase, knowledge, is very similar to the external variables within TAM. The persuasion phase of Rogers has one additional point, which cannot be found within TAM – compatibility. While it could be also subsumed under perceived usefulness (Chen, Gillenson & Sherrell, 2001), recent research has shown that it is an independent construct and not interconnected to any construct within TAM (Wu, 2005). Another finding of Wu (2005) is that compatibility has the strongest impact onto behavioral intention. Therefore it is very important to keep this factor within this model. The decision phase is obviously very similar to the behavioral intention, while the confirmation corresponds to the actual use of the innovation.
Figure 3: TAM integrated into updated Diffusion Theory Model. Blue: Diffusion Model; Green: TAM.
5
Method
Within this chapter it is explained how the research was conducted. This research follows a deductive research approach, collecting quantitative data, to assess the research questions and connect them with the theory of the previous section. To find out the main differences in adoption of online music services, a survey in conjunction with an experiment is used as strategy. According to (Suki, 2011) younger, well-educated, male people are more likely to adopt online
Knowledge Persuasion Decision Confirmation
• Relative Advantage
• Compatibility
19 music. Thus students have been selected as a well-young and educated group. This group has a higher chance to represent feature trends by adopting innovations early. There are two test groups: The first one consists of students from the Netherlands. This test group has no restrictions or blockades to access music via the Internet. The second group consists of students in Germany. Those are facing blockades on popular websites like YouTube or Grooveshark (the latter company stopped its service due to a dispute with GEMA). Thus this test group has a manipulated market. Both groups are tested with a survey in form of a questionnaire about their current usage, perception and desires for future products. Easterby-Smith et al. (2008) suggest that most questions should begin with “who”, “what”, “where” and “how” within a scientific survey. The survey enables researchers to collect large amount of data in an economical way (Saunders, Lewis, Thornhill, 2009). This study has been designed cross-sectional, testing the difference of online music adoption in 2012.
Figure 4: Research model.
The survey is conducted as an online survey, which executes the data collection at the same time in both countries. The questionnaire consists of standardized questions and answers, to facilitate comparison between both countries (Saunders et al., 2009). It also makes it easier to process a larger sample size due to the fact that the amount of time needed for the survey is not connected to the amount of participants. The larger data sample leads to a higher validity of results.
Students in the Netherlands
Students in the Germany
Adoption of OMS in the Netherlands
Adoption of OMS in Germany Blockades
caused by GEMA
20 The questionnaire consists of four different parts. The first part focuses on gaining general information. Previous studies revealed that there is a difference in usage of digital music services between genders and different age groups (Peitz, 2005; Koster 2007). Hence it is important to collect both data sets for a better comparison of those. The question of residence of students is a very delicate one. Many students are not studying in their home country, which is particularly the case at the University of Twente, which is very close to the German border. To avoid bias, there are two questions needed aiming at the current place of residence and the place of residence prior to studying.
The next group of questions identifies the current usage of music in general and the current adoption of online music services. The answers of the students should present the current mix of music sources in their average daily usage. Further questions try to shed some light on the specific adoption of online music services.
The third group of questions directly concerns the core concepts of TAM and the Diffusion Theory Model. It aims at the current thoughts on the persuasion phase, which consists of relative advantage, compatibility and complexity on online music services. The results should help to determine the status of online music services and its rate of adoption. The majority of questions in this section are using a seven-point scale metric, which helps the participants to express their opinion in a more precise way. Together with the second group of questions, it is thus possible to create an overview of the current knowledge and current status of the persuasion process of online music services.
21
5.1
Survey questions
According to the previous chapter, the following questions were asked in the survey:
1. Your Gender: 2. Your age:
3. Where do you currently live at (country)? 4. What is your current profession?
5. Where did you live at before you started studying?
6. Specify per source the amount of hours you listen to music per week:
7. Specify the amount of hours listening to music for each device listed (weekly):
8. How did you obtain the majority of your MP3 files and music CDs (no personal data are saved, so please answer honestly!)?
9. How much money (in €) do you currently spend monthly for obtaining music? 10. Which online-services are you using or did / do you have heard of?
11. Ad-financed online music services have a better selection of songs, than my offline collection (e.g. CD, MP3).
12. Paid online music services have a better selection of songs, than my offline collection (e.g. CD, MP3).
13. I can access music quicker by using ad-financed online music services. 14. I can access music quicker by using paid online music services.
15. I would find ad-financed online music services as easy to use. 16. I would find paid online music services easy to use.
17. Online music services integrate well into my music listening habits. 18. Online music services are too complex in their usage.
22 20. I will use ad-financed online music services in the forthcoming 12 months.
21. I will use pirated music in the forthcoming 12 months.
22. I would prefer more online music service offers which are using the following business model (multiple answers possible)
a. Ad-financed music flat rates b. Paid music flat rates
c. Pay-per-use music services
d. Buy single songs / albums as MP3 or CD
e. Music is a free good, which should be available for free
23. I am willing to pay the following amount of euros per month for music within the forthcoming 12 months.
24. I am currently missing the following features for online music services.
5.2
Using Google data to refine usage questions
Nowadays, there are many online music services available. The current list for online music databases, with the ability to stream music, has 35 entries at Wikipedia (Wikipedia, 2013). The analysis of the usage as well as the familiarity of a service is very interesting, but the available space is not sufficient to report about all services in detail. Hence this large number of services needs to be reduced to the most important ones.
23 these data are sufficient to predict future outcomes of a country’s GDP (Preis, Moat, Stanley & Bishop, 2013).
Google is offering limited public access to its data via Google Trends. This web service allows users to compare up to six different search terms with each other. Google does not reveal the absolute numbers, but offers a relative comparison of those six search terms. Thus it becomes evident if a search term is more important than another, and also how many times larger the number of queries is. Furthermore it is possible to limit this comparison to specific time frames or countries. The data are not only visualized by means of a graph, but can also be exported as CSV file for further analysis.
The data sets of Google also include search queries about online music. Thus it is possible to use the list of online music services of Wikipedia and compare those services to each other, to identify the most important ones while ignoring the less important ones within the study. Particularly the results for each country clearly show remarkable differences and help to narrow down the important services. While Rara for example seems to be a popular service, Google Trend clearly shows that this service has its majority of customers within Brazil and is less interesting for a study conducted in Germany and the Netherlands.
Evidently, before a ranking can be created, it is necessary to understand what the data by Google mean.
24 always data contain one cell which contains a “100”, namely the peak value. According to the market research institute ABI, Spotify is currently the market leader (ABI, 2013). So all online music services which are currently accessible in Germany and Netherlands from the list at Wikipedia are compared with Spotify by Google Trends. The peak of Spotify according to Google Trend was on December 23, 2012. No company was able to surpass this peak value of Spotify, hence all data were gathered in relation to this peak value, making them comparable to each other. The advantage is that now all competitors can be compared to each other within one table of data, instead of having a survey limited to only 6 companies.
The extracted data by Google show the search volume for the searched term per week. To avoid temporary disturbances of the search volume through external factors like advertisement, the time frame which is analyzed has been set to one year. The most recent date at the point of extraction was May 2013, thus the oldest data used were from May 2012. The search volumes of each week were summed up, creating one count for the whole year, for each company. This number has been used to create a ranking and to identify the most frequently used services within Germany, Netherlands as well as worldwide.
25 Thus those global players have not been included within this ranking, but are added afterwards within the survey.
The final list of services which was used in the survey is:
YouTube
Amazon MP3
Spotify free
Spotify Premium
Soundcloud
Grooveshark
Rdio
Simfy
Itunes
Last.fm
Deezer
Napster
Online Radio
5.3
Interpretation of open questions
26
5.4
Reasoning of adoption of TAM and IDM to music services
The original questions of TAM cannot be transferred easily to the field of online music services. In terms of perceived usefulness, TAM aimed at an increase of work performance. In the field of online music services, there is no such performance goal for listening to music in a private or home environment. Van der Heijden (2004) adopted the TAM survey for entertainment purposes and also introduced a new variable “enjoyment” next to “perceived usefulness” and “ease of use”.
Out of the four questions about ease of use, one question of van der Heijden is adoptable to this case: “I find <the system> easy to use”, hence this question is also used in the survey of this study.
Enjoyment is a new construct, which has been introduced by van der Heijden especially for hedonistic systems. Music as part of the entertainment media industry is an archetype of a hedonistic system. But the purpose of an online music service is to give access to entertainment which is enjoyable rather than being the entertainment itself. The amount of time spent to deal with the service should be minimal. Therefore its role is being a tool, which means that no questions about enjoyment are necessary, and that those constructs about enjoyment are part of the perceived usefulness.
27 The work of van der Heijden contains two concepts which can be learned from his questions. Firstly, there is the concept of quickness and easiness of a service. In the case of this study, this means the promptness of access to music. Secondly, there is the concept of improving a service to fulfill a task better. In terms of online music services, this is the ability to deliver the songs the user wants to listen to. Van der Heijden’s other questions are about the support which hedonistic system gives the user the best choice of movies to watch, which is not applicable to the case in this study.
The next field within the integrated model of section 4.3 is an extension of the TAM survey using ideas derived from IDM. Music services need to be compatible to the user’s environment and complement his entertainment. Thus this construct can be easily adopted and implemented within the survey.
Also the concept of complexity fits into the music business. Complex products, which require studies of operating manuals or consultation of support, are conflicting with entertainment; thus it is crucial to a music service to be perceived as not complex.
5.5
Survey
To reach as many people as possible within the same time frame, without a budget for employees conducting the study in persona, the most reasonable approach is an online tool, which is distributed among students.
The amount of students without Internet access can be neglected. All universities in Germany and the Netherlands enable students to go online within their facilities. The student dorms are offering Internet access for free or with huge discounts.
28 2013). Due to its open-source nature, the source code is available, which allows modification in every part of the software whenever needed. This feature was necessary to adopt a unique and professional design, which underlines the importance of this study and should encourage students to fill out the questions.
On top of that, LimeSurvey is a very flexible and feature-packed software, which allows to create a survey with many possibilities to create unique constellations of questions and answers. Even if a specific feature is missing, there are a lot of plugins already developed as well as the possibility to modify the source code. Thus there were no technical limitations in creating the survey caused by the software.
The survey was conducted over 4 weeks and distributed via social networks at University of Twente, Technical University Berlin, University of Applied Science Gelsenkirchen, University of Cologne and University of Maastricht.
The data within the database have been coded via multiple-dichotomy coding (Saunders et al., 2009) and can be easily analyzed by means of Excel or SPSS. A reliability analysis using a Cronbach Alpha is used to test the data set for internal consistency (Lews, Saunders & Thornhill, 2009). This should prove that the questions are understood by the participants in the same way and thus can be seen as reliable.
6
Results
29
is currently a student
lives currently in the Netherlands or Germany,
and also originates from the same country he is currently living in
Participants not matching all of these criteria were discarded, as their views and habits are “contaminated” by their past. A student born and raised in the Netherlands, but enrolled at a German university, is a difficult case for a study aiming at investigating differences between both countries. Therefore such participants are left out of the evaluation.
Out of those 153 participants with matching criteria, 117 come from Germany, while 36 come from the Netherlands. While those numbers differ from each other, they are representative for the total number of students within their countries in relation to each other. In Germany nearly 2.4 million students are currently enrolled, while there are only 666.689 students enrolled in the Netherlands according to recent statistics (Richters, 2012; Bundesamt, 2012).
While there are nearly as many male (56.4%) than female participants in Germany, the number of male participants in Netherlands is clearly dominating with 83.3%.
6.1
Usage of music
The first question about music (Chapter 5.1, Question 6) of the survey is about the media which are used to listen to music. The data have also been visualized in Figure 5. The German students listen to CDs 2.2 hours per week on average, whereas the Dutch students listen merely 1.2 hours per week. While in both groups the CD listening time is rather small, the difference in relation to each other is still very large.
30 students are clearly leading at listening to CDs and online MP3 file services, the opposite is true for free and paid Internet streaming. With over 7.6 hours per week for free music streaming services, the Dutch students clearly surpass their German counterparts (3.7 hours per week). The same is true for paid internet streaming. While even fever hours are spent by German students for paid Internet streaming, the Dutch students hear nearly as much free and paid music (6.8 hours). In total Dutch students listen 34 hours music per week on average, while German students listen merely 23 hours per week. The difference is mostly due to the extensive use of streaming services in the Netherlands – while the usage of sources like local MP3 files is very similar in both countries.
Figure 5: Usage of media types in hours per week, compared between both countries.
The 7th question deals with the devices used to listen to music. Not surprising, the most frequently
used device in both countries is the computer (i.e. PC or laptop, excluding tablets). However, the percentage of the computer as music playing device is slightly larger in the Netherlands. Over 60% of the listening hours are spent at the PC in the Netherlands, in contrast to 54% in Germany. The second place for listening devices is taken by the radio / CD-player in Germany, but by the smartphone / tablet in the Netherlands. According to the data, smartphones are much less
0 5 10 15 20 25 30 35 40
Germany Netherlands
Listening hours per music media type per week
CD Radio Online radio local MP3 files
31 popular as music devices in Germany: merely 1.9 hours music per week is their usage in Germany, compared to 5.4 hours in the Netherlands.
The information provided in the first and second question both result in the same weekly listening time for each country, thus underlining the validity of the data.
[image:32.595.72.532.410.602.2]Question 8 asks for the sources of the music. While over 45% of the German students buy some of their music online, only 14% of the Dutch students are doing this. The German lead continues in the grey zone of music sources, like “copied from a friend”, “ripped from online sources” and “ripped from digital media”. Over 65% of all German participants use music which has been copied from a friend, compared to less than 8% of the Dutch students. The main source for music of Dutch students is clearly the illegal download, which is used by over 80% of all participants, compared to less than 25.5% in Germany. These comparisons can be seen in Figure 6.
Figure 6: Sources of music in Germany and Netherlands and shares of students using them.
The larger share of online MP3 payments is also evident in the next topic (Question 21), which is about money spending on music per month. While the German students spend 6.54 € for CDs and 2.6 € for MP3 files, the Dutch students invest 3.9 € for CDs and 0.3 € for online MP3 files. Particularly the spending for online MP3 services in the Netherlands is very low compared to the spending in Germany. Most songs cost at least 0.89 € at Amazon MP3 or iTunes – which means
0 20 40 60 80 100
bought online copied from a friend ripped from online sources
ripped from physical digital media
downloaded from illegal sources
Share of "yes" in %
32 that on average only every third Dutch student is buying a song every month, while at least two songs are bought by every single German student. While the Germans spend more money on MP3 files and CDs, the Dutch students invest five times more money into online streaming services with (2.09 € / month). But in total, German students spend more money for their listening habits with 9.62 € on average, compared to 6.28 € for the Dutch students. While the German students spend more money for music, they listen to less music, as it has been shown in Figure 5.
6.2
Online service popularity
The 10th question deals with the knowledge about the most important music services of both
student groups. The first company mentioned in the question is YouTube. While 100% of all Dutch participants use YouTube regularly as music service, 4% of the German group claim to not use
YouTube as music source. There were no participants who had never heard of YouTube as possible source for music files. It is the only service which is known to all participants as music service.
Amazon is also a global player, but the majority of Dutch participants (63%) claims that they have never heard of the Amazon MP3 Service, and 0% of the Dutch group are using Amazon’s MP3 file services. In Germany only 29% never heard of the possibility to buy MP3s at Amazon, while 20% are using this service. The largest group (51%) has heard of the service, but is not using it.
33 in 22% of the cases. While the Dutch students either use or at least knowing about Spotify services as mentioned above, 10% of the German participants did not know anything about Spotify.
Soundcloud is a German startup, which is located in Berlin. But in spite of its German roots, the awareness of this service is much higher in the Netherlands. Only 6% of the Dutch students have never heard of it, while 32% of the German group claimed to not know this service.
Grooveshark was available In Germany for a short time only, before the service had to shut down due to legal problems. But the service is still used by 14% of the German students, which is the same amount as in the Netherlands. The amount of people not knowing about this service is higher in Germany (40%) compared than to the Netherlands (28%).
The new music streaming competitor from the USA, Rdio, has no users in the Dutch test group, while it is used by 1.7% users of the German group. In both countries, the majority claims to have never heard of this service (84% Germany, 83% Netherlands).
Simfy is another German startup which is offering its services in Germany only. The obvious result is that over 92% of the Dutch participants have never heard of it. But even in Germany over 41% have never heard of it and only 1.7% use it.
Itunes is known by the majority in both countries, but its usage differs strongly. 26% of the German participants are using the service, while only 6% claim to use it in the Netherlands.
Last.fm is used by 32% of the German participants and 25% of the Dutch students, which is one of the highest results, next to Spotify, Amazon and YouTube. The main difference between both countries can be found in the number of people not knowing about this service, which is 19% in Germany and only 8% in the Netherlands.
34
Deezer is not known to the majority of the German students (85%), and less than 1% are using this service. While being not popular in the Netherlands, too, its usage statistics is there slightly higher, namely 3%.
While Napster is known by the majority in both countries, it is not used by a significant number of users anymore.
[image:35.595.73.524.293.550.2]Online radio is heavily used in both countries: 55% Germany and 44% in the Netherlands. A really small minority of less than 5% does not know about online radio stations in both countries.
Figure 7 Current usage of online music services, share of people who have never heard of specific online music services
Figure 7 illustrates that most online streaming services are used more intensely by the Dutch students in comparison to the German group, but the German students have a higher usage of online MP3 stores. Over 80% of the Dutch students are using streaming services besides YouTube, while only 60% of the German group are using streaming services.
0 10 20 30 40 50 60 70 80 90 100
Current usage of music services
35
6.3
TAM answers
This section presents the answers to the TAM-questions. This section presents the answers to the TAM questions. The results were also tested for internal consistency by means of Cronbach's alpha test. For both countries, alpha values 0.8 were obtained. Hence it can be assumed that the results of the survey are consistent, and that the question were interpreted by the participants in the same way. The first four questions deal with perceived usefulness. The very first question in this question group (question 21) asks about the agreement with the following statement: “Ad-financed online music services have a better repertory of songs than my offline collection”. The majority of the German students agrees with this statement, while only one third disagrees, which can be seen in Figure 8. The Dutch students are more skeptical about the quality of online music databases; the percentages of the people who support the statement and the people who reject it are similar in size.
The next question is about an analogous statement about paid online music services. While there are still as many people who reject the statement in Germany (31%) in comparison to ad-financed music services (31%), the group of rejecters within the Dutch students (39%) is slightly smaller
0 5 10 15 20 25
very unlikely neutral very likely
11 12
9
14
22
14
19
11 11
17
19 19
11 11
[image:36.595.75.525.418.618.2]Germany Netherlands
36 (33%) as shown in Figure 9. In general more people in both countries agree that the paid online music service have a larger repertory of songs, compared to the free services.
The next two questions aim at the perceived usefulness from another point of view: speed of access. While in Germany many students believe that ad-financed online music services allow quicker access to music (48% have a positive attitude) and only a minority is doubting the marketing claims as shown in Figure 10, Dutch students are very conservative. Only one quarter believes in quicker access, more than half of them doubt it.
0 5 10 15 20 25 30
very unlikely neutral very likely
12
9 10
11
16 16
26
11
8
14
25
6
17
19
Germany Netherlands
37 Similar to the first two questions, the perception changes when paid services are considered. In Germany the number of supporters of faster music access decreases a little bit, while the rejecting group grows by 4%. The opposite is happening within the Dutch group: the group of supporters is grows from 27% to 48%, while the neutral and the rejecting parties shrink in size.
The next topic is perceived ease of use. While the majority (62%) of the German students believes that ad-financed online music services are easy to use and only 18% do not agree with this
0 5 10 15 20 25
very unlikely neutral very likely
15
14
8
15
22
14
12 25
14
11
22
8
11
8
Germany Netherlands
0 2 4 6 8 10 12 14 16 18 20
very unlikely neutral very likely
19
14
9
15
13
19
12 17
19
6
11 11
17
19
[image:38.595.72.523.70.270.2]Germany Netherlands
Figure 10: Perceived usefulness: answers to the statement: “I can access music quicker by using ad-financed online music services”.
[image:38.595.71.525.444.645.2]38 statement, the Dutch students have a different view. Only 33% of them agree on the statement about ease of use, while 31% are neutral on the topic and 36% reject it.
The German students consider the quality of paid online music services similar as that of the financed online music services. But the total number of supporters is smaller compared to the ad-financed version, and the number of rejecters is larger. While only 5% believe that ad-ad-financed online music services are not easy to use, the percentage is 9% on paid services. The opposite is true for the group of Dutch students. The share of Dutch students believing in a more easy-to-use paid service compared to the previous question is larger, although though it still does not reach the same high levels as in Germany. But the total number of Dutch students rejecting the statement is smaller compared to Germany.
0 5 10 15 20 25 30 35
very unlikely neutral very likely
5
9
4
21 20 23
19 17
6
14
31
8
17
8
[image:39.595.77.525.161.363.2]Germany Netherlands
39 In Germany 49% agree that online music services are fitting into their music habits. This figure is topped slightly by the Dutch students with 56%, which can be seen in Figure 14. But it should be noted that the amount of people in the Netherlands who clicked “very likely” is 25%, and thus much higher than the 15% in Germany. The amount of students rejecting the statement is a third in both countries.
The complexity is not seen as a problem in Germany or the Netherlands. In both countries the numbers of supporters of the statement “online music services are too complex” are very low. In case of the Dutch students, the two options with the highest support for too high complexity were
0 5 10 15 20 25 30 35
very unlikely neutral very likely
9
12
7
16 19
21
17
6
0
17
33
8
17 19
Germany Netherlands
0 5 10 15 20 25
very unlikely neutral very likely
15 14
7
16 18 16
15 14
11 11
8
14
17
25
[image:40.595.72.525.69.266.2]Germany Netherlands
Figure 13: Illustrates the share of students, who agree that paid online music services are easy to use.
[image:40.595.73.533.440.639.2]40 not chosen once, in case of the German students only the highest option was not chosen as it is illustrated in Figure 15. The majority of students rejected the thesis (81% Germany, 84% in the Netherlands).
6.4
Perception of future usage of music services
Question 19 asks for the usage of paid online music services within the forthcoming 12 months. More than half of the participants decided that it would be very unlikely that they would pay for an online service. Also the numbers of people who would pay for an online music service are very similar. But there is one difference; While there Dutch students answer “very likely” only, the German students are distributed over the two top answers evenly and are not as convinced as their Dutch neighbors.
The following Question 20 asks for the usage of ad-financed music services in the future. While the number of students in Germany who are very likely to use ad-financed music services in the forthcoming 12 months is more than doubled, the number of Dutch students to adopt ad-financed music services remains the same. But in general there are more people willing to adopt online music services in the future, if it is a free service, compared to the previous question about paid services.
0 5 10 15 20 25 30 35 40 45
very unlikely neutral very likely
40
30
11 12
3 3
0 44
33
6 8 8
0 0
[image:41.595.73.525.163.355.2]Germany Netherlands
41 Question 21 asks whether pirated music is going to be used. While slightly more people in Germany plan to use pirated music than legally acquired music, the majority of Dutch students prefers pirated music in the next 12 months with over 86%, as it can be seen in Figure 16. Only 11% of the Dutch group plan not to use music from illegal sources, compared to 47% in Germany. 27% of the German group state that it is very unlikely for them to use pirated music and only 8% agree on this in the Netherlands.
The next four questions ask about preferred business models. The Dutch students do not like the idea of pay-per-use music services at all; only 5% think positively about it. In Germany this idea is also not very popular, but there are in general more people with a positive attitude, even though only 2% out of 18% positive answers clicked on “very likely”. The most frequently demanded service offers for the German students are clearly stores which offer MP3s — over 48% of the German students support this idea. In contrast to this only 17% of the Dutch students would prefer more offers in this area, and the number of students who clicked on “very unlikely” was as high as on pay-per-use music services. The idea of music flat rates, paid or ad-financed, are similar popular within the group of Dutch students, while the German students clearly prefer more ad-financed music flat rates — 47% positive count for ad-ad-financed and 24% for paid music flat rates.
0 10 20 30 40 50 60 70
very unlikely very likely
27
12
8
15
9 9
21
8
3 0 3
11 8
64
[image:42.595.72.529.249.448.2]Germany Netherlands
42 It is also worth mentioning that the amount of supporters for ad-financed music flat rates is two times higher than in the Netherlands, but significantly lower for paid music flat rates.
To summarize, the Dutch students dislike the idea of more pay-per-use music services as well as more stores to buy MP3s, while liking the idea of more music flat rate offers. The German students prefer the idea of MP3 stores and ad-financed music flat rates.
The answers to Question 23 confirm that within the next 12 months the German students are willing to pay more for their music than Dutch students. The German student is willing to pay 26 € on average per month, while the Dutch student is willing to pay merely less than half of it, namely 11 €. This discrepancy between the willingness to pay is even higher than the results from question 9 (cf. Sec. 6.1). This means that the current difference in spending for music is lower than the planned difference in the forthcoming twelve months.
The last question asks which services or features the students consider missing; the answer is expected as an arbitrary text. The grouped answers can be found in chapter 10A.4 within the Appendix. The most frequently mentioned missing feature within the German group is “easy mobile sharing”, which is mentioned four times in total. Another often mentioned topic is the blocking of music by GEMA, which even seemed to provoke anger in one case. Different views are found with regard to pricing. On one hand lower prices are demanded, on the other hand a fair distribution of the money is requested. Some participants explicitly mentioned that there should be a fair share of the money for the artists. Other features desired by German students are standard functions like shuffle and looping songs.
43 has been mentioned more than once and even though there were fewer Dutch students compared to German students, the answers in the open fields were fewer and shorter.
7
Discussion
Within the next two sections, the views of German and Dutch students are analyzed within the scope of the integrated TAM/IDM-Model from Section 4.3.
7.1
Differences between both countries
To elaborate the differences in the adoption of online music services between German and Dutch students, three research sub-questions have been defined in Section 2. Those subquestions are now answered in detail.
The first sub-question is “What is the actual state of digital music services adoption in Germany and the Netherlands?”. Over 75% of the listening time of the German students is taken up by offline media, compared to merely 57% in the Netherlands. This is a first indication that there is a fundamental difference in listening habits and especially in the adoption of Internet services for music listening.
Especially the area of paid internet streaming has a lower adoption rate of 6.3% in Germany (Netherlands 19.8%). The comparison of listening hours reveals that the total number of listening hours per media source is very similar for physical media, but the Dutch students are listening to music 10 hours per week more than to their neighbors. A large portion of those extra hours is given to free and paid internet streaming. This already suggests that the adoption of online music services is higher in the Netherlands, but there are more data which can be analyzed.
44 devices are the second most important music-playing devices for music in the Netherlands, while being only on the fourth place in Germany. This is another indication that online music services are currently not playing a huge role in Germany.
The sources of the offline libraries of music files in both countries are very different. The German students obviously avoid illegal sources, fearing to get caught and to have to pay high fines. The majority copies music from friends – which is not necessarily less illegal, but much harder to prosecute. The exchange of music files via a USB-stick for example cannot be prosecuted without observation, whereas the whole Internet traffic can be automatically monitored. But there is also a very high share of German students which claim to buy the majority of their music (45%). In Germany the least popular method to acquire music are illegal sources. The opposite is the case in the Netherlands: the students do not fear harsh fees and prosecution, and therefore their main source for music files are illegal ones. Only 14% claim to use an online store to buy their MP3 files. The report of the IFPI (2013) suggests that 32% of all Internet users are using unlicensed sources regularly to listen to music. Within this study the German students are slightly below this percentage (26%), while the number of Dutch students exceeds the percentage by a large amount (81%).
The high share of illegal sources for music files can also be seen in the average money spent for music per month – 9.71 € in Germany compared to 6.28 € in the Netherlands. But the money in the Netherlands is spent for physical media as well as streaming services, whereas in Germany the share of money for streaming services is negligible.
45 usage of those services: German users are using online stores as often as streaming services, while the Dutch have very high usage figures on streaming services and nearly no users for MP3 stores like iTunes.
The percentage of German students using online music services (excluding YouTube) is 60%, compared to 81% in the Netherlands. Thus, the answer to the first sub-question is that the adoption rate of online music services is significantly lower in Germany. The students in Germany still rely on the old distribution models of buying single files rather than using music as a service. Evidently the draconic laws helped to preserve the old business models and slowed down the success of new Internet-based distribution models, whereas in the Netherlands the high rate of piracy lowered the revenues of physical media. But it also boosted the growth rate of revenues of music streaming services which is currently the highest in Europe (IFPI, 2013).
The facts that the adoption process has not been finished, yet, and that not everyone is using online music services, point to the second subquestion: “How satisfied are customers with current music services?“. This question can be answered with help of the questions related to the integrated TAM/IDM model.
46 services mean less advertisement and thus the access to music is faster. On the other hand German students, among whom have nearly no users of paid online music services do see the payment process as an obstacle.
The trend of an optimistic attitude of German students towards online music services continues with perceived ease-of-use. The majority believes that those services – regardless of being ad-financed or paid – are easy to use. And similar to the question about speed of access, the number of students who doubt this increases slightly in case of paid services. The image of the ease-of-use of online music services in the Netherlands is different. Only one third believes that ad-financed online music services are easy to use. The advertisement seems to increase the difficulty by blocking elements or placing distracting elements within the service, while only 23% believe that paid online music services are not easy to use.
Similar to perceived usefulness, the perceived ease-of-use is seen much more positive in Germany. But also the trend of a more cautious approach to paid services can be seen again.
Compatibility is also seen in a positive light. Most Dutch and German students do not see any major problems to integrate online music services in their lifes. Complexity of online music services is not seen as any obstacle to adopt music, too; the vast majority in both countries does not see those services as complex.
ease-of-47
use, which can already be seen in the current usage figures – there are almost no German students using them.
The last subquestion sheds some light on the decision of students on online music services: “How will music services develop in the future?”. While there are currently huge differences in the adoption rates of online music services, those differences will diminish in the future, if the students predicted their future usage correctly. 31% of the students in both countries selected within the survey the options that they are likely using paid online music services within the next 12 months. Even though there were fewer German students seeing the advantages in usefulness
and ease-of-use, the group of supporters was still slightly larger than in the Netherlands. Therefore it is no surprise that the German group of paid online music service users will catch up.
In terms of ad-financed online music, German students plan to surpass their Dutch neighbors. This development also is in agreement with the previously gathered data about their current perception.
While the Dutch students already integrated online music from unlicensed and licensed sources into their music habits, the German students are going to catch up in terms of licensed online music services. But the lenient laws on unlicensed access to music is demanding its tribute. Over 80% of the Dutch students claim to use pirated music within the next 12 months, whereas the percentage of German students is merely 38%. This could also explain the lower figures in
perceived usefulness and ease-of-use: online music services have to compete with unlicensed music.