Linked Data adoption and application within financial
business processes
Academic supervisor: Dr. Ir. Erwin Folmer Second academic supervisor: Dr.Ir. Erwin Hofman
Company supervisor: Jasper Roes M.Sc. Consultant Technical Sciences BIS
Author:
2 Problem statement ... 2
3 Research aim, goals and research questions. ... 2
3.1 Research aim and aggregated research structure. ... 2
3.2 Research goals and questions. ... 3
4 Research methods. ... 5
4.1 Systematic literature review. ... 5
4.1.1 The top journals and search engines selection. ... 5
4.1.2 Keywords used for the search queries. ... 9
4.1.3 Search process. ... 10
4.1.4 Overview of selected studies. ... 10
4.2 Design science. ... 12
5 Introduction to the master thesis assignment. ... 13
5.1 Introduction to the financial domain. ... 14
5.2 Introduction to Linked Data. ... 15
5.3 Introduction to adoption and the most imposed adoption models and theories ... 17
6 Results from the systematic literature review. ... 22
6.1 Linked Data and the Web of Data (Web 3.0). ... 22
6.2 Open linked data and its magnitude. ... 26
6.3 Linked data within the financial domain. ... 29
7 Summary of the advantages of LD. ... 36
8 Summary of disadvantages associated with LD. ... 43
9 Adoption of Linked Data. ... 48
10 Business reporting and Linked Data – a case study. ... 52
10.1 XBRL basics and terminology. ... 52
10.2 XBRL – the status quo. Benefits and challenges. ... 54
10.3 Resolving the XBRL challenges with LD. ... 57
10.4 The XBRL case within the developed conceptual model. ... 59
11 Insights from the interviews with financial experts. ... 61
Figure 2: Research aim, main research question, research goals and research sub-questions.
Visualization ... 5
Figure 3: Quorum flowchart of selected studies. ... 10
Figure 4: Research model... 13
Figure 5: The views on data (Folmer and Krukkert, 2015) ... 15
Figure 6: An RDF triple (Klyne and Carroll, 2014). ... 16
Figure 7: Basic concept underlying user acceptance models (Venkatesh et al., 2003). ... 17
Figure 8: Technology Acceptance Model (TAM) (Fishbein and Ajzen, 1975). ... 18
Figure 9: Extension of the TAM model by network externalities (Song et al., 2009). ... 20
Figure 10: The Marbles LD Browser (Bizer, 2003) ... 25
Figure 11: The Linking Open Data Cloud (Schmachtenberg et al., 2014a) ... 27
Figure 12: OFFDM: Ontology-based Framework in support of Financial Decision-Making (Du and Zhou, 2012) ... 31
Figure 13: Ontology of income statement (Du and Zhou, 2012). ... 32
Figure 14: BESST for stress testing (Hu et al., 2014). ... 35
Figure 15: The ATCT framework (Meijer et al., 2014) ... 38
Figure 16: Model of technology diffusion (Zmud and Apple, 1989). ... 48
Figure 17: TAM (Fishbein and Ajzen, 1975; Song et al., 2009). ... 48
Figure 18: Model on LD adoption. ... 51
Figure 19: Conceptual model of OXFD (Chowdhuri et al., 2014). ... 55
Figure 20: The model on LD adoption, applied to the XBRL case. ... 60
Figure 21: High level (aggregated) time planning, incl. five milestones ... VII Figure 22: Disaggregated time planning ... VIII Figure 23: Multi-item measurement scale for perceived Ease of Use (Davis, 1989) ... XII Figure 24: : Multi-item measurement scale for perceived Usefulness (Davis, 1989) ... XII List of tables: Table 1: Overview of the top 25 CS/IS journals and their coverage across search engines (Folmer, 2012). 6 Table 2: Overview of the top 25 Management journals and their coverage across search engines. ... 7
Table 3: Overview of the top 28 Financial journals (ASA importance and quality rank) and their coverage across search engines. ... 9
Table 4: Keyword and related words selection... 9
Table 5: Used query expressions ... 10
Table 6: Overview of the selected studies ... 12
Table 7: Datasets by topical domain (Schmachtenberg et al., 2014) ... 28
Table 8: Classification schema of data quality problems (Du and Zhou, 2012). ... 30
Table 9: Summary of the advantages for LD application within (financial) business processes ... 43
1
1
Management summary.
2
2
Problem statement
TNO has expertise and understanding on LD and of LD technologies. It consults clients on possible LD solutions within different domain. Furthermore, LD found application in different domains, such as electro technology, energy, aerospace etc. However, its adoption within the financial domain is still very limited. At the same time TNO considers to offer possible LD-based solutions to clients in the financial domain as well. Therefore an understanding of the advantages and disadvantages of LD application for the potential adopter within this domain is needed. Furthermore, it is relevant to identify factors that influence the adoption of LD. On the one side, this could increase the understanding of important factors that play a role in the LD adoption. On the other, it could create incentives among LD technology providers to positively influence those factors, thereby speeding up the process of adoption. Next to that, it could create more understanding of the LD capabilities among potential adopters.
Therefore an overview of advantages and disadvantages of LD application is dynamically modelled to enable application on different case studies and trigger a better informed decision on whether to initiate such within a certain domain and/or business scenario. Furthermore, a conceptual model on LD adoption is created to demonstrate the factors, which have influence on the process and can be possible levers on it. Factors that are specific to financial domain and relevant for LD adoption are included as well. The tangible research aim, goals and research questions will be elaborated on in the next chapter.
3
Research aim, goals and research questions.
3.1 Research aim and aggregated research structure.
As clarified in the previous chapter the necessity is given to research and illustrate (with a model) the adoption potential of LD for improving (financial) business processes and eventually even creating new business opportunities. Therefore the research aim is to showcase this potential by developing a conceptual model for the adoption of LD, apply it on an ongoing case within the financial industry and match it against experts’ opinions to validate respectively adapt the findings.
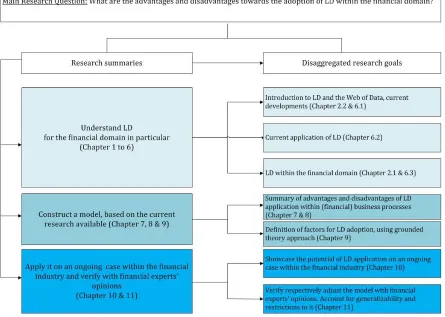
Out of the research aim a main research question was formulated that covers all of the desired research areas. It reads: “What are the advantages and disadvantages towards the adoption of LD within the financial domain?”.
3
[image:8.612.72.517.201.518.2]financial experts’ opinions. An overview of the aforementioned research summaries and the corresponding disaggregated research goals can be found in the figure below.
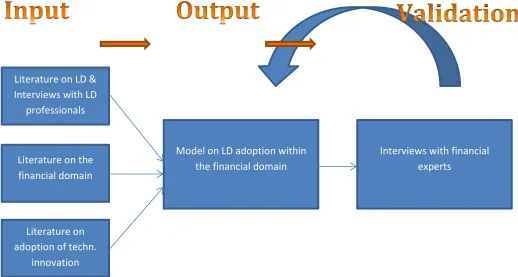
Figure 1: Research structure.
3.2 Research goals and questions.
4
5 Figure 2: Research aim, main research question, research goals and research sub-questions. Visualization
In the next step the corresponding research methods were agreed upon and will be briefly introduced within the next section.
4
Research methods.
4.1 Systematic literature review.
4.1.1 The top journals and search engines selection.
6
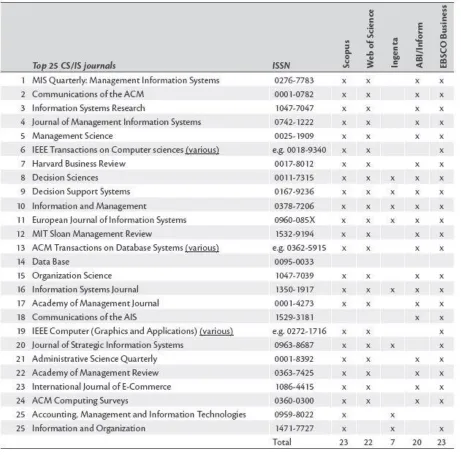
[image:11.612.78.539.213.668.2]In the search all top 25 CS/IS journals and top 25 Management journals were included. An overview of these journal was created by (Schwartz and Russo, 2004). However their coverage by the search engines changed significantly. Therefore the re-examination of the coverage by (Folmer, 2012) was taken over. In this re-examination the search engines INSPEC, ACM DB and Ei Compendex were excluded, since there is no published list of accessible journals (Schwartz and Russo, 2004). The top 25 CS/IS journals and the top 25 management journals, and their respective coverage by search engines as re-examined by (Folmer, 2012) are shown in Table 1 and 2 below.
7 Table 2: Overview of the top 25 Management journals and their coverage across search engines.
Based on the coverage and availability, the decision for usage of Scopus as a main search engine was made. Only the journals that weren’t covered by Scopus, were searched using EBSCO. Three of the journals are not covered by any of the used search engines. Those are shown in the table above. 44 of the journals were covered by Scopus and 41 by EBSCO, whereas the three journals not covered by Scopus were included in EBSCO.
8
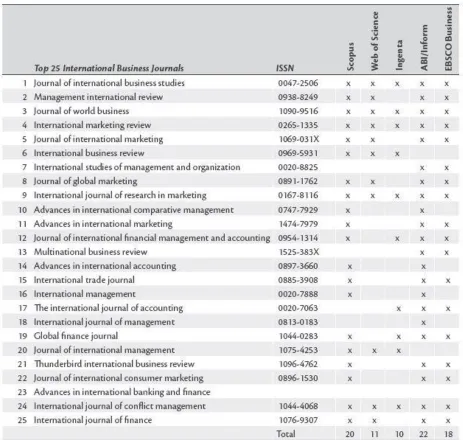
the quality selection. This led to the selection of top 28 financial journals for this master thesis. These journals and their coverage within the chosen search engines was investigated. The results are shown in Table 3 below.
Rank Title ISSN Scopus Total
Docs. (2014)
Total Docs. (5 years)
1 Journal of Finance ISSN
15406261 x 60 671
2 Review of Financial Studies ISSN
14657368 x 79 829
3 Journal of Financial Economics ISSN
0304405X x 105 2397
4 Journal of Financial and
Quantitative Analysis ISSN 00221090 x 47 746
5 Journal of Money, Credit and
Banking ISSN 15384616 x 72 439
6 Journal of Banking and Finance ISSN
03784266 x 352 4348
7 Mathematical Finance ISSN
14679965 x 44 331
8 Journal of Financial
Intermediation ISSN 10960473 x 32 319
9 Journal of Corporate Finance ISSN
09291199 x 144 901
10 Financial Management ISSN
00463892
x 22 546
11 Journal of Empirical Finance ISSN
09275398 x 104 799
12 Journal of International Money
and Finance ISSN 02615606 x 155 1939
13 Journal of Financial Markets ISSN
13864181 x 50 360
14 Financial Analysts Journal ISSN
0015198X
x 22 936
15 Review of Finance ISSN
15723097 x 42 301
16 Journal of Risk and Insurance ISSN
15396975 x 52 393
17 Quantitative Finance ISSN
14697696 x 167 965
18 Journal of Financial Research ISSN
14756803 x 23 213
9
00954918
20 Journal of Business Finance and
Accounting ISSN 0306686X x 40 1139
21 Journal of Futures Markets ISSN
10969934 x 68 517
22 Financial Review ISSN
15406288 x 34 118
23 Finance and Stochastics ISSN
14321122 x 1 9
24 Journal of Derivatives ISSN
10741240 x 14 168
25 Journal of International Financial
Markets, Institutions and Money ISSN 10424431 x 106 755
26 Pacific Basin Finance Journal ISSN 0927538X
x 78 719
27 Journal of Applied Corporate
Finance ISSN 17456622
28 European Financial Management ISSN 1468036
X x 35 372
Table 3: Overview of the top 28 Financial journals (ASA importance and quality rank) and their coverage across search engines.
4.1.2 Keywords used for the search queries.
The keywords used for performing the literature search are of critical value for such research, since they ensure encounter of the most relevant studies and provide the basis for hypotheses and modelling. Therefore they were updated and adjusted iteratively to provide an appropriate number of relevant results, ultimately leading to the following results:
Keyword Linked Data Advantages Finance Semantics
Related advantage financial semantic
disadvantage finances
[image:14.612.68.547.72.351.2]advantageous disadvantageous
Table 4: Keyword and related words selection
Four keywords were selected and included in the search in a broader sense. The overview of the used keywords is shown in the table above. They secure proper coverage of the formulated main research question and research sub-question and ensure that no important aspect relevant for this research is left without consideration.
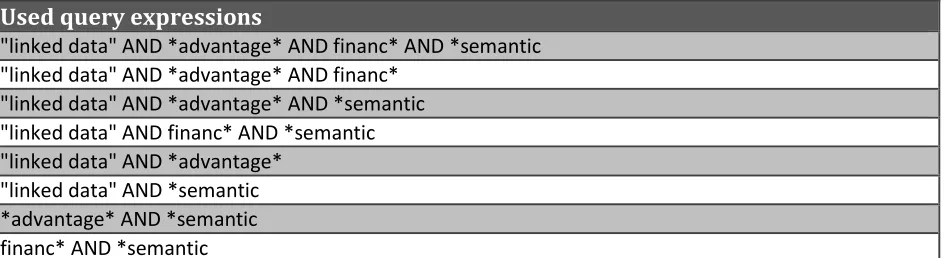
10 Used query expressions
"linked data" AND *advantage* AND financ* AND *semantic "linked data" AND *advantage* AND financ*
"linked data" AND *advantage* AND *semantic "linked data" AND financ* AND *semantic "linked data" AND *advantage*
[image:15.612.72.544.72.201.2]"linked data" AND *semantic *advantage* AND *semantic financ* AND *semantic Table 5: Used query expressions
4.1.3 Search process.
The search was performed within the selected search engines (Scopus & EBSCO), on title, abstract and keywords. Search within the top journals (top 25 CS/IS, top 25 Management and top 28 Financial journals) was conducted by means of the ISSN of those journals and is performed during January and February 2015. The combination of two keywords created a large but manageable selection of papers. A third keyword was added only to those searches that delivered more than 100 results.
4.1.4 Overview of selected studies.
Potentially relevant studies, identified by keyword search
(n=1200)
Selected studies (n=18)
Selection based on titles (n=232)
Selection based on abstract (n=57)
Selection based on scan of the study (n=32)
Use of additional keywords to make the search process more specific
(n=968)
Exclusion of studies not related to LD or Semantics
(n=175)
Exclusion of studies, where the abstract was not based on LD
(n=25)
Exclusion of studies, which were out of scope
(n=14)
[image:15.612.79.508.361.717.2]11
In the following table, an overview of the selected studies according to this procedure, incl. the author(s), title, year publication is provided.
Authors Title Year Publication title Volume Issue
Bizer, C., Heath, T., and Berners-Lee, T.
Linked Data - The Story
So Far 2009 Int. J. Semantic Web Inf. Syst.
Chan, S.W.K.,
Franklin, J. A text-based decision support system for financial sequence prediction
2011 Decision Support
Systems 52 1
Chowdhuri, R., Yoon, V.Y., Redmond, R.T., Etudo, U.O.
Ontology based integration of XBRL filings for financial decision making
2014 Decision Support Systems
68
Chu, P.-C. An object-oriented approach to modeling financial accounting systems
1992 Accounting, Management and Information Technologies
2 1
Currie, R.R., and Pandher, G.S.
Finance journal rankings and tiers: An Active Scholar Assessment methodology
2011 J. Bank. Finance 35
Du, J., Zhou, L. Improving financial data quality using ontologies
2012 Decision Support Systems
54 1
Hitzler, P., and
Janowicz, K. Linked Data, Big Data and the 4th Paradigm 2013 Semantic Web 4
Hu, D., Yan, J., Zhao, J.L., Hua, Z.
Ontology-based scenario modeling and analysis for bank stress testing
2014 Decision Support
Systems 63
Janowicz, K. The Role of Space and Time For Knowledge Organization on the Semantic Web
2010 Semantic Web 1
Meijer, K., Frasincar, F., Hogenboom, F.
A semantic approach for extracting domain taxonomies from text
2014 Decision Support Systems 62 Narock, T., Yoon, V., March, S. A provenance-based approach to semantic web service description and discovery
2014 Decision Support
12
Nebot, V., Berlanga, R.
Building data warehouses with semantic web data
2012 Decision Support Systems
52 4
Nederstigt, L.J., Aanen, S.S., Vandic, D., Frasincar, F.
FLOPPIES: A Framework for Large-Scale Ontology Population of Product Information from Tabular Data in E-commerce Stores
2014 Decision Support Systems
59 1
Papavasileiou, V., Flouris, G., Fundulaki, I., Kotzinos, D., Christophides, V.
High-level change
detection in RDF(S) KBs 2013 ACM Transactions on Database Systems
38 1
Roussinov, D.,
Zhao, J.L. Automatic discovery of similarity relationships through Web mining
2003 Decision Support
Systems 35 1
Steinfield, C.W., Markus, M.L., and Wigand, R.T.
Cooperative Advantage and Vertical Information System Standards: An Automotive Supply Chain Case Study
2011 IEEE
Tummarello, G., Delbru, R., and Oren, E.
Sindice.com: Weaving the Open Linked Data
2007 ISWC'07/ASWC'07 Proceedings of the 6th international The semantic web and 2nd Asian conference on Asian semantic web conference
Zhu, H., Wu, H. Assessing the quality of large-scale data
standards: A case of XBRL GAAP Taxonomy
2014 Decision Support
Systems 59 1
Table 6: Overview of the selected studies
Additionally, a google search and google scholar search was performed, to enrich the study by more practical and most recent developments. Furthermore conferences for LD were visited and the productive talks delivered even more valuable insights from practitioners.
4.2 Design science.
13
research available and then iteratively adjusted using a case study within the financial industry/standards and insights from interviews with financial experts.
The preliminary outline in terms of reporting format and language, lay-out and APA-style conventions can be found in the appendix. Same applies to the time horizon and corresponding planned activities.
5
Introduction to the master thesis assignment.
For this master thesis LD is of interest. The improvements in (financial) business processes that a LD application could trigger and the new business opportunities that could come along with it, are elaborated on in the next chapters. Moreover the disadvantages and difficulties associated with such application, are opposed. From this a conceptual model for the adoption of LD is developed. It captures the potential of LD in terms of both, advantages and disadvantages and eases decision makers in the trade-off whether to apply it or not, depending on their specific business case and/or domain. The model is developed based on the current research on LD available. After it is being conceptualized, it is applied on an ongoing case within the financial industry, i.e. XBRL. Furthermore, it is validated by interviews with financial experts to prove practicability and improve its applicability, as well as capabilities to solve present problems and challenges. Next to that semi-structured interviews with LD professionals were conducted to enrich the understanding of LD and its relevancy for practitioners. Furthermore, they ensured proper usage of terms and understanding of the context as a whole. The corresponding research model is shown below.
Literature on LD & Interviews with LD
professionals
Literature on the financial domain
Literature on adoption of techn.
innovation
Model on LD adoption within the financial domain
[image:18.612.77.595.452.729.2]Interviews with financial experts
14
5.1 Introduction to the financial domain.
SIC1 codes are industry classifications. They are four-digit numerical codes, assigned by the
US government to business establishments. The purpose of SIC codes is to “identify the primary business of the establishment” and facilitate the “collection, presentation and analysis of data” (SICCODE.com, 2015b). This classification covers all economic activities. The economy is thereby divided into 11 divisions, consisting of 83 two-digit major groups, further divided into industry groups and finally disaggregated into industries. The financial (services) domain is a part of SIC 60-67.The division includes establishments from finance, insurance and real estate, whereas finance incorporates “depository institutions, non-depository credit institutions, holding (but not predominantly operating) companies, other investment companies, brokers and dealers in securities and commodity contracts, and security and commodity exchanges” (SICCODE.com, 2015a). Moreover, monetary authorities that perform monetary control belong to the Finance sector. Furthermore, those establishments engage in financial transactions, i.e. transactions that involve the “creation, liquidation, or change in ownership of financial assets” and/or facilitate those transactions (SICCODE.com, 2015a). Those include three types of activities – raising of funds by taking deposits and/or issuing securities, pooling risk by underwriting insurance and annuities, and providing services to facilitate or support financial intermediation, insurance and employee benefit programs.
More importantly, financial industries are “extensive users of electronic means” (SICCODE.com, 2015a). Those are used for verification of financial balances, authorization of transactions, transfer of funds, notifications of individual transactions for banks or credit card issuers, providing daily summaries etc. (SICCODE.com, 2015a). The selected case study in chapter 10 shows this in the context of electronic communication of business and financial data.
The financial industry had undergo many changes. In earlier days institutions were the main players. However currently more and more individual or non-institutional investors are drawn to the financial markets (Chowdhuri et al., 2014). Furthermore they mainly rely on publicly available data sources when making investment decisions and not on financial advisors’ consultations (Ervin, 2004). Therefore the accuracy of traditional data sources and online financial data is essential and yet questionable (Du and Zhou, 2012).
The purpose of financial accounting is to “collect, process, and report information related to financial transactions.” (Chu, 1992) The presented financial picture, including the firm’s financial condition, i.e. assets and liabilities, periodic operational results, transactions with customers and creditors etc. must be objective, consistent and reliable (Chu, 1992). The
1
15
decision of the US SEC2 for all tier-1 public companies to report their financial statements in
XBRL3 aimed at a solution for this (SEV.GOV, 2013). It was expected that the XBRL adoption
will improve accessibility, transparency and efficiency of the dissemination of financial data (Pinsker and Li, 2008). Its benefits are expected to extend to economic stakeholders, both inside and outside of the organization (Baldwin et al., 2006). However XBRL still poses cognitive and technical challenges to investors (Debreceny et al., 2010). LD might offer solutions to (some of) the issues, associated with XBRL.
5.2 Introduction to Linked Data.
[image:20.612.157.422.257.508.2]The concept of LD is somewhat related to two other concepts, namely Open Data and Big Data. The representation of these relations looks as follows:
Figure 5: The views on data (Folmer and Krukkert, 2015)
It shows the main view points on data and their interrelation. Big data is mainly characterized by the three V’s: Volume, Velocity and Variety. The focus of this research work will be on LD. Open data will be somewhat touched upon with Linked Open data, hence LOD. LOD is simply LD associated with no cost of acquiring/ usage due to the presence of an open license, its open format and machine readability. LD is “a data publication methodology that utilizes the semantic web to make data publicly accessible on the Web” (Narock et al., 2014). It enables combination of data from multiple sources that can be queried over by exposing RDF databases on the Internet (Narock et al., 2014).
2
The United States Securities and Exchange Commission
3
16
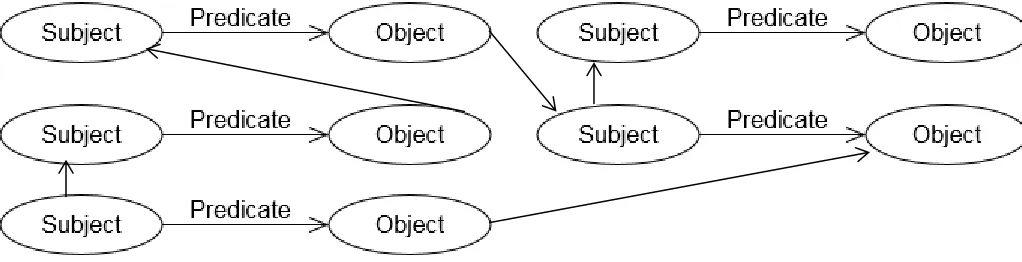
[image:21.612.84.595.150.281.2]Resource description framework (hence RDF) is “a framework for representing information in the Web” (Klyne and Carroll, 2014). LD works with triples – a subject, a predicate and an object. An RDF graph is a set of such triples. This is shown in the figure below.
Figure 6: An RDF triple (Klyne and Carroll, 2014).
SPARQL on the other hand, is an RDF query language, i.e. it facilitates manipulating and querying RDF graphs on the Web or in an RDF store (Keio and Beihang, 2013).
LD promotes four main statements:
The Open world assumption – it poses that for a complete picture information from different/additional sources is needed.
Anybody can say Anything about Any topic (AAA principle), which also can be extended if space and time are being added (Hitzler and Janowicz, 2013) to AAAAA principle. Every party that has information at its disposal is able to share it and/or make it available. Thereby different perspectives come to play. This leads to a higher level of
Variety – information from different sources (public, private, governmental) is available in different forms (illustrations, text documents, web pages, databases etc.) and can be connected (“linked”) using the LD principles. Therefore one is able to
Say more, do more, play more.4 LD allows for assigning context to data, which
enables digital processing and interpretation. This in turn improves business processes and possibly leads to new insights.
Although the research on LD is advanced, the practical implementations within the financial domain appear to be still limited in our opinion. We believe that this is due to its novelty and the lack of clear showcase of its potential for business, in terms of both,
4 “Play more” refers not to actual playing with the data but to higher potential and brighter scope of data
17
advantages and disadvantages. This research gap should be closed with the creation of a model to capture the LD potential.
For this purpose a cooperation with TNO was established, due to its expertise in terms of LD and furthermore the presence of interest in researching its potential within current (financial) business processes. TNO – innovation for life, Netherlands Organization for Applied Scientific Research is an organization for independent research that “connects people and knowledge” (TNO Innovation for life, retrieved from https://www.tno.nl/en/about-tno/mission-and-strategy/). It focuses on five closely related themes “with a prominent place in the national and European innovation agenda”. These are:
Industry Healthy living
Defense, safety & security Urbanization
Energy (TNO Innovation for life, retrieved from https://www.tno.nl/en/focus-area/)
This master thesis assignment is seen as theme overarching since LD find/could find application within each of the five themes. However the business study and expert’s opinions used for validation of the model findings will be within the financial industry. The exact content of this study assignment will be shown in detail within chapter 3.
5.3 Introduction to adoption and the most imposed adoption models and theories
The adoption of LD technology can be considered as adoption of technological (IT) innovation, since it has the “potential to reduce information overload and to enable semantic integration” (Joo, 2011) through its capabilities, such as semantics and machine-processability (Antoniou and Harmelen, 2008). Adoption is stage two within the stage model of technology diffusion. It consist of initiation, adoption and acceptance, adaptation, routinization, and infusion (Zmud and Apple, 1989). In the following, relevant models will be mentioned and briefly introduced, starting with the Technology Acceptance Model (hence TAM).
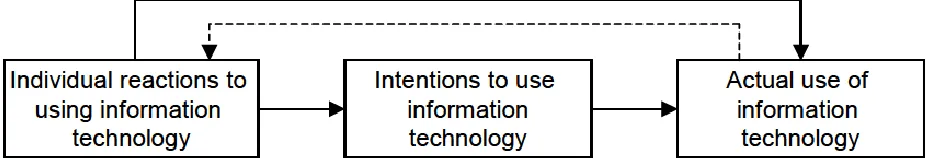
[image:22.612.73.536.598.678.2]The basic concept that underlies user adoption models looks as follows:
18
Some streams of research focus on individual acceptance of technology and focuses on using intention as a dependent variable (Davis et al., 1989). Other aim at implementation success at the organizational level (Leonard-Barton and Deschamps, 1988). Goodhue (1995) focuses on technology fit. However, all those streams, incl. the TAM, are based on the concept, described in the figure above, considering individual reactions to using the technological innovation, intentions to use it, as well as the actual usage.
[image:23.612.77.539.292.554.2]Within this model a potential user’s overall attitude towards using a system is assumed to directly influence the actual usage of this system. In turn, this attitude is a function of perceived usefulness and perceived ease of use. On the other hand, these two beliefs are directly influenced by design features (Davis Jr, 1986). The latter have no direct effect on attitude or behaviour according to this model. Their only effect is thus only indirect through perceived usefulness and perceived ease of use. This is shown in the figure below.
Figure 8: Technology Acceptance Model (TAM) (Fishbein and Ajzen, 1975).
19
performance”, whereas perceived ease of use represents “the degree to which an individual believes that using a particular system would be free of physical and mental effort” (Ajzen and Fishbein, 1977). Multi-item measurement scales for those two variables are developed and validated to enable “better measures for predicting and explaining use” (Davis, 1989). For a complete overview of the measures, please refer to the appendix.
The TAM is founded on the Fishbein model, however there are major differences between the two models, which will be briefly explained in the following. Within the Fishbein model the summed belief-evaluation term is treated as one independent variable. Therefore the regression coefficient shows the overall effect of beliefs on attitude. This could, however, substantially distort the outcomes (Davis Jr, 1986). The TAM, on the other hand, treats each belief separately in the regression equation. Therefore by analysing the coefficients, relative influence of the different beliefs on attitude toward using can be compared. Furthermore, no evaluation term is employed in the TAM, whereas each belief is weighted by its corresponding evaluation term in the Fishbein model (Davis Jr, 1986). Relationships between beliefs are not explicitly specified in the latter and instead assumed to have equal weights and summed together regardless of existing relationships. TAM, on the other hand, poses a causal relationship between perceived ease of use and perceived usefulness. Another difference lies in the elicitation procedure of identifying the salient beliefs. Within the TAM it is a qualitative free-response procedure, whereas Fishbein focuses on specific subjects and questions about the specific system that is being analysed. The gathered beliefs information is then measured, using single-item measurement scales (Fishbein and Ajzen, 1975) and multi-item measurement scales within the TAM (Ajzen and Fishbein, 1977). The variable behavioural intention is omitted in the TAM, since it reflects on a decision, formed through factors that may change over a significant period of time (Davis Jr, 1986).
20
[image:25.612.89.469.296.462.2]perceived availability have direct influence on the perceived ease of use, as well on the perceived usefulness. There are multiple reasons for this. Higher volume of installed base positively reflects on the volume of innovation-related word-of-mouth communication that a potential adopter experiences. This then in turn, directly increases the perceived usefulness and ease of use, by providing knowledge about the innovation (Arndt, 1967). Furthermore the size of installed base influences the probability of acquiring information about innovation usefulness and ease of use by observing prior adopters and potential borrowing to try it (Rogers, 1983). Next to this, the size of installed base signals about the ease of use of an innovation (Song et al., 2009). Furthermore, it creates a perception of a strong user support network, since it is associated with higher number of existing users, available to support a new adopter (Redmond, 1991). Moreover, it is hypothesized that network externalities also have a direct influence on the purchase intent. This is how the TAM is extended (Song et al., 2009) and it looks as follows:
Figure 9: Extension of the TAM model by network externalities (Song et al., 2009).
Many studies researched the robustness of TAM. Adams, Nelson, and Todd (1992), Davis and Venkatesh (1996), Hendrickson, Massey, and Cronan (1993), Sagars and Grover (1993) and Szajna (1994 and 1996) worked on the computer-related usage of the TAM. Additional explanatory variables are examined, such as age (Morris and Venkatesh, 2002), gender (Gefen and Straub, 1997) and culture (Phillips, Calantone and Lee, 1994 and Straub, Keil and Brenner, 1997). The most recent interest of researchers has been moved to the adoption of home computers (Brown and Venkatesh, 2005 and Venkatesh and Brown, 2001) and mobile communication services (Cheong and Park, 2005, Lu, Yao and Yu, 2005, Nysveen, Pederson and Thorbjornsen, 2005 and Wu and Wang, 2005), focusing on the TAM usefulness in this regard. The focus of this work will be on the adoption of LD.
21
and trialability, leading to the five determinants of consumer adoption. Relative advantage is described as the degree, to which an innovation is perceived as better than the previous idea by a particular group of users. It is measured in terms that matter to those users, i.e. economic advantage, social prestige, convenience or satisfaction (Robinson, 2009). It is therefore related to perceived usefulness, whereas compatibility is related to ease of use. However, relative advantage fails to capture the difference between performance benefits and cost savings of an innovation (Song et al., 2009). Therefore, the variations in relative advantage values can only limited be interpreted. Given this, perceived usefulness appears to be more suitable to be used in further analysis within this research. The next determinant, observability, refers to observable results, which lower uncertainty.
Roger’s diffusion of innovations is radically different to most other theories of change because it proclaims change not in people but in the innovations (Robinson, 2009). Another main insight from it is the importance of peer-to-peer conversation and peer networks for innovation’s adoption. Next to that, innovation suppliers need to understand the needs of the different user segments, i.e. innovators, early adopters, early majority, late majority and laggards, as the adoption process varies per segment (Rogers, 2003).
The proposed model for LD adoption within this work is based on the TAM model (Fishbein and Ajzen, 2005) and includes the extension by Song et al. (2009). It looks conceptually as follows:
Initiation Adoption and acceptance
Adaptation Routinization Infusion
Perceived Usefulness:
Positive impact
Negative impact
Perceived Ease of Use:
Positive impact
Negative impact
Attitude toward using:
Positive impact
Negative impact Network externalities:
Perceived installed base
22
6
Results from the systematic literature review.
6.1 Linked Data and the Web of Data (Web 3.0).
Nowadays the amount of digital data grows over more than 50% per year. Therefore any means to structure this data, becomes increasingly relevant (IDC, 2010). Next to that knowledge management and decision-making tasks rely on this data (Meijer et al., 2014). This justifies the necessity of a research work that discovers and illustrates the potential of LD, in terms of advantages and disadvantages, in improving current (financial) business processes and eventually even creating new business opportunities.
LD is a “set of best practices for publishing and connecting structured data on the Web” (Bizer et al., 2009) and its essence consists of semantics and standards. The semantics capture the meaning of the data. The standards allow for interpretation because they imply how the meaning and relations should be set in order to enable digital exchange and processing (Folmer and Verdonk, 2014). This set of best practices has been adopted by a high and constantly increasing number of data providers allowing for the creation of a global data space that contains billions of assertions or the so called Web of Data (Bizer et al., 2009). More elaboration on the number of datasets, triples and its growth rate will be provided in the next section.
The Web of data, also referred to as the Semantic Web or the Web 3.0, is a “global information space”, in which not only the documents but also the data itself is linked (Bizer et al., 2009). It was conceived in 2001 (Berners-Lee et al., 2001). It is a large knowledge-base of sources that delivers (references) information as RDF files or through SPARQL endpoints. The idea behind it is to add machine-understandable, semantic annotation to web-published contents. That way they can be retrieved and effectively processed by humans and machines in a variety of tasks. This is done by attaching semantics to resources, from very simple to very complex annotations depending on the requirements, by using semantic web technologies. They enable a new dimension to data integration by providing a common terminology, standard format for resources (RDF/(S)5 and OWL6),
semantically linked data (Nebot and Berlanga, 2012). The result is more and more (semi)-structured data and knowledge resources, published on the Web, all together creating the Web of Data (Bizer et al., 2009). The main difference between the Web 2.0 and the new Web of data, or Web 3.0 is thus that Web 2.0 mashups work against a fixed set of data sources, whereas the LD applications operate on top of an “unbound, global data space.” This then enables answers from new data sources on the Web, expressed in the AAA principle, “Anybody can say Anything about Any topic”. Furthermore this can be extended if space and time are added (Hitzler and Janowicz, 2013) to AAAAA. Thus every party that has information at its disposal is able to share it and/or make it available with LD. Thereby different perspectives come into play. However from businesses’ perspective this may not
5
RDF/(S): http://www.w3.org/TR/RDF-concepts/
6
23
always be beneficial, as they do not want to “play” but to use relevant data from reliable sources. This will be further elaborated on within the disadvantages section.
LD is not relational data, SQL etc. but graph data. The graphs are decentralized, which means that there isn’t a single knowledge-base of statements but anyone can contribute with statements to the information space of the Web of Data. Shared identifiers (URIs) and shared terms allow for merging of these statements and therefore providing useful services to human and software clients, (Tummarello et al., 2007) This enables new types of applications, which were not possible until now with the Web 2.0. Semantic search is one of the first applications that makes use of and exploits the Web of Data (Nebot and Berlanga, 2012). Search and browsing over RDF data are developed (Cheng et al., 2008) and this enhances conventional information retrieval, since it enables search services centered on entities, relations and knowledge. These new types of applications enabled by the usage of graph (RDF) data can be classified into three categories.
LD Browsers
Traditional Web browsers allow for navigation between HTML pages by following hypertext links. LD browsers however enable browsing within and between data sources by following links expressed as RDF triples. For example an user can browse the description of the new Hobbit movie “The Hobbit: The Battle of the Five Armies” (2014) and then discover that its country of origin is New Zealand/USA. He or she then can follow the link to the country and find more information about the country and possibly a list with actors born there. This navigation is done following RDF links rather than HTML links (Bizer et al., 2009).
A particular example of a LD browser is the Disco Semantic Web browser7. The
encountered documents are browse-able resources themselves and the user can follow them to decide which of them are to be used for his or her specific query (Tummarello et al., 2007). The Marbles LD Browser will be shown on an example in the following (Bizer, 2003).
LD Search engines and Indexes
LD search engines crawl LD from the Web by following RDF links. That way users can query aggregated data from a variety of sources. Two basic categories of these are to be distinguished, namely human-oriented search engines, such as Falcons and application-oriented indexes, such as Watson8 (Bizer et al., 2009).
Domain-specific applications
Domain-specific applications are of main interest for this thesis, since application within the (financial) business domain is being researched. Current domain-specific applications are Revyu for film reviews, based on LD, as well as DBpedia Mobile, which is a location-aware LD browser for exploring cities. As indicated before LD applications merge information from different sources. For example DBpedia Mobile connects information
7
Disco Semantic Web browser: http://www4.wiwiss.fu-berlin.de/rdf_browser/
8
24
from DBpedia, reviews from Revyu and related photos from the Flickr photo-sharing API (Bizer et al., 2009). The biomedical domain is as well active, if not one of the most active, in effort to export database semantics to data representation formats (RDF), following open standards that explicitly state the content semantics. For a long time ontologies and languages, such as RDF and OWL are being used there (Nebot and Berlanga, 2012). An increasing number of scientific communities use Semantic Web ontologies to share and interpret data within and across research domains (Papavassiliou et al., 2009). Many initiatives characterize these efforts, such as Bio2RDF (Belleau et al., 2008) or Linked Life Data9. Some Semantic Web developments have already been adopted on a large-scale use,
such as the introduction of schema.org10. It is a semantic vocabulary, proposed by the four
major search engines Bing, Google, Yahoo! and Yandex. It is not domain-specific and not an ontology of “everything” but rather a high-level vocabulary on popular Web concepts (Nederstigt et al., 2014). Next to that Google has its own development, i.e. the Knowledge Graph11. It is a project that enhances search results with appropriate semantic metadata.
Those movements are often attributed to the concept of Linked data (Nederstigt et al., 2014).
Linked data operates on the so called “decentralized publication model” (Tummarello et al., 2007). Taking advantage of the new data sources appearing on the Web due to the AAA principle, does not require changes in the application code due to LD. Each application that supports LD can thus automatically make use of them. This contributes connecting different data depositories currently available on the Web into a single global information space. This is arguably the main benefit of LD from users’ perspective and one of the main building blocks of the Semantic Web. Nevertheless there lies also one of the key challenges for the LD principles. Indeed the user has integrated access to data from various distributed and heterogeneous data sources, however he/she has not selected them explicitly (Bizer et al., 2009). The challenges that come along with this will be shown within the disadvantages section.
Let’s first see how this looks like on an existing example. In Figure 4: The Marbles LD browser (Bizer, 2003) below it will be shown how information from different sources is combined when browsing in Marbles (a LD browser) data about Tim Berners-Lee. The colored dots show the different data sources. Here we see about 7 different data sources, which are integrated into a single view to provide the user with as much as possible perspectives and facets of his/her query. The proposed sources are all listed below in order to secure proper selection by the user.
9 Linked Life Data: http://linkedlifedata.com 10
Bing, Google, Yahoo! and Yandex, schema.org: http://bit.ly/196asth2013.
11
25 Figure 10: The Marbles LD Browser (Bizer, 2003)
Another of the main reasons for considering the application of LD within business processes is its machine readability. The original and main goal of the Semantic Web as formulated by (Berners-Lee, 2000, pp.191): “is putting data on the Web in a form that machines can naturally understand, or converting it into that form. This creates what I call a Semantic Web – a web of data that can be processed directly or indirectly by machines”. LD is a means to achieve this goal. The LD principles can lower the data reuse barrier, as well as ease its integration and application (Bizer et al., 2009).
LD is thus data published on the Web, machine readable, with explicitly defined meaning, typed linkages to other external data sets and can be linked to from external data sets (Bizer et al., 2009). There are four main rules to publish data as LD, also called the “LD design principles”. Those are:
Use URIs as names for things
26
When someone looks up an URI, provide useful information, using the standards (RDF, SPARQL)
Include links to other URIs, so that they can discover more things (Berners-Lee, 2006). LD works with RDF (triples) as basic data representation language to prevent syntactic issues. Furthermore it uses vocabularies and ontologies created in formally well-defined language such as OWL to vanish interoperability issues (Hitzler and Janowicz, 2013). Ontology or taxonomy is “a concept hierarchy in which the broader-narrower relations between concepts are stored” (Meijer et al., 2014). It is defined as “an explicit specification of conceptualization” (Gruber, 1993). With “conceptualization” it is meant that ontologies are an abstract model of a given domain of knowledge, e.g. an ontology can be an abstract model of the reality of the financial domain. “Explicit specification” in this definition refers to the specified concepts, their attributes and the defined relationships between them. They are based on classes and instances, where classes model the domain structure and instances belong to classes, modelling the “ground level” objects. In the case of ontologies, two main processes can be distinguished – ontology building and ontology mapping (Ding and Foo, 2002). Ontology building can be done manually, but since it is a very time- and resource-intensive process, semi- and fully-automated approaches have been developed. Furthermore an ontology can be created bottom-up, top-down or using a hybrid approach. The bottom-up usually starts with text documents and moves from specification to generalization. Top-down would start with top level concepts and move from generalization to specification. A hybrid would start with the most important concepts and move to generalization and specification. Ontology mapping likewise is very crucial, since more and more ontologies are created and their re-use becomes essential (Du and Zhou, 2012). Ontology mapping can be done using an one-to-one approach, ontology clustering but also it can also be done as creation as a single-shared ontology. Ontologies are useful not only for information search but also for classification and navigation through data (Berners-Lee et al., 2001). Moreover within a specific domain they play an important role in improving information consistency, reusability, systems interoperability and knowledge sharing. Next to that they can improve information organization, management and understanding (Fensel and Brodie, 2003). Therefore they can be used in decision support systems. However due to the heterogeneity of used vocabularies and ontologies, the context plays a very important role. The context is “largely determined by space and time” (Janowicz, 2010). This will be further elaborated on within the advantages and disadvantages sections.
6.2 Open linked data and its magnitude.
27
[image:32.612.76.538.150.451.2]can somewhat give an indication of the growing importance of LD. This is best illustrated with the so called LOD cloud. It consists of 1014 data sets in total, in eight different domains and the linkage relationships between them (Schmachtenberg et al., 2014). It is shown in the figure below.
Figure 11: The Linking Open Data Cloud (Schmachtenberg et al., 2014a)
28
Datasets by topical domain. Topic Datasets %
Social web 520 51.28%
Government 183 18.05%
Publications 96 9.47%
Life sciences 83 8.19%
User-generated content 48 4.73%
Cross-domain 41 4.04%
Media 22 2.17%
Geographic 21 2.07%
[image:33.612.69.276.72.391.2]Total 1014
Table 7: Datasets by topical domain (Schmachtenberg et al., 2014)
As the reader may notice the Financial (services) domain is not yet present in the overview of datasets per topical domain. This may indicate that LD (LOD) did not yet find application within this domain. However it may also be interpreted in a way that the usage of LD in the financial domain is not done in the form of open data but moreover using LD instead of LOD. Furthermore each of the topical domains has financial aspects involved, in form of accounting, innvestments, fincancing ect.
The size of the Web of Data, in the representation of LOD is further estimated based on the number of RDF triples and the linkages between them by the community in the ESW wiki. In 2009 it consists of 4.7 billion RDF triples, interlinked by around 142 million RDF links (Bizer et al., 2009). The last data available12 is from 2010, where the number of triples
increased up to four times its previous size for about an year, thereby consisting of 19.6 billion RDF triples (W3C, 2010). This is a very up forth growing pace. However it cannot be assumed that this corresponds directly with a continuous growth rate of the LOD cloud, since it is based on one year’s observation. Furthermore, this does not imply a direct correspondence with the growth rate of LD, since only LOD is accounted for. A part of this rapid growth could be for instance accustomed by the creation or converting into LOD of a
29
large dataset in 2010. Furthermore, the growth in number of triples in 2010 could be an exceptional case, thus not an indicator of a constant growth rate. However, it does illustrate that more and more LOD is published and/or more data is converted into LD according to the LD principles mentioned before. This is a certain clue about the growing in importance of LD. The focus of this work lies, however, on LD (and not LOD) within the financial domain.
6.3 Linked data within the financial domain.
Financial decision-making applications can be divided into five categories: stock forecasting, portfolio management, bankruptcy prediction, foreign exchange market and fraud detection (Zhang and Zhou, 2004). All of them depend on the collection of data. Poor data quality can have enormous negative social and economic impact (Wang and Strong, 1996). Poor data quality can also have a variety of issues, the primary of which according to Bansal et al. (1993) are data consistency, data accuracy and data integrity. They are especially applicable to financial data, since it is highly time-variant, non-linear and noisy (Bansal et al., 1993). The noise of financial data includes dynamic noise and observation noise. The dynamic noise is related to distortions in the obtained information, for instance due to changes of the factors after measurement occurred. Observation noise, on the other hand, corresponds with the accuracy of the measurement and includes distortions during the measurement Therefore two lines of distortion can occur – one that results from differences between the real-world system and the view inferred from the information system and another one from differences between the real-world system and the observed view of the real-world system (Wand and Wang, 1996). Furthermore data quality concerns both, objective, i.e. intrinsic to the data and contextual aspects, i.e. vary across users and tasks. The use of LD approaches and ontologies can improve the quality of online financial data and support decision-making in finance and in other domains, in which data is spread across multiple sources with overlap but complementary in content, even if they are different in data format and naming schemes. Du and Zhou (2012) develop an ontology to grasp this potential. The proposed framework has two dimensions – completeness, unambiguity, correctness and meaningfulness13 being the one dimension, based on data
quality problems, and concept and instance, based on the abstraction level in ontologies (Du and Zhou, 2012). This results in six categories of data quality problems: terminological ambiguity, conceptual inaccuracy, missing data, unreliable data, inconsistent representation and incomplete domain. They are shown in the table below.
13 Meaningfulness is left without consideration outside the discussed framework, since meaningfulness of the
30 Table 8: Classification schema of data quality problems (Du and Zhou, 2012).
On the concept level “Incomplete domain” refers to lack of complete knowledge of a certain domain (Wand and Wang, 1996). For instance, financial firms have no inventory but this is not the same as having inventory on the balance sheet equal 0. “Terminological ambiguity” would resolve for instance following problem: Yahoo!Finance uses accounts payable in terms of taxes payable and notes payable, which differs from the definitions within Google Finance and MSN Money Central. Google Finance considers only the taxes payable, whereas MSN Money Central’s definition includes taxes payable, notes payable and reserves. Therefore the developed ontology can help in cases where the same term is used for different concepts. Furthermore it can deal with situations, where different terms are used but refer to the same concept, i.e. sales in Compustat implies the same meaning as revenue in Google Finance. “Conceptual inaccuracy” corresponds with the lack of precision in concept definitions, e.g. revenue on the Income Statement is the sum of revenue of goods and revenue of service. Therefore a revenue in Google Finance can be interpreted as revenue of goods, revenue of service or a combination of both, when sufficient verification
information is missing.
Furthermore on an instance level, data can be missing. Again it is challenging to determine whether the data is actually missing or the corresponding position in the financial statement equals zero. Inconsistent representation of financial data across different sources might be for instance that the same data is represented in units of millions or thousands of USD (Du and Zhou, 2012).
31 Figure 12: OFFDM: Ontology-based Framework in support of Financial Decision-Making (Du and Zhou, 2012)
32 Figure 13: Ontology of income statement (Du and Zhou, 2012).
Data quality is a key factor for decision-making performance. Studies show that 20% of asset managers, investment bankers and hedge fund professionals spend 25% to 50% of their time in data validation efforts, which keeps them from focusing on tasks contributing to the bottom line (Valiante, 2008). Therefore improving automated validation processes can significantly improve decision performance, provided that the data quality will not suffer from it. Moreover financial data need a synergetic semantic alignment of a variety of resources in order to improve its quality, since it has one unique feature – redundancy. Financial data is duplicated across online sources such as Google Finance, Yahoo!Finance, MSN Money Central and Compustat, which contain partially the same financial data but are yet complementary. The data is heterogeneous across the different sources although the financial domain is highly regulated. This illustrates the value-added of the aforementioned framework of Du and Zhou (2012).
33
financial sites. As a support for developing of new ontologies several ontologies within the financial domain can be used:
SUMO14 (Suggested Upper Merged Ontology) – it represents high-level concepts and
relationships between concepts in the financial domain.
LSDIS15 (Large Scale Distributed Information Systems) Finance Ontology – extension
of SUMO.
Finance Ontology16 – written in OWL to represent the knowledge in the financial
services domain incl. the financial statements.
XBRL US GAAP Taxonomies v1.017 – provides concepts from financial statements
and relationships between them (Du and Zhou, 2012) The data instances are official financial statements, encoded in XBRL. They are then submitted to the SEC by publicly traded companies (Zhu and Wu, 2014).
Furthermore an ontology-driven framework for product information can be used likewise in the financial industry for aggregating financial product information from a variety of sources. Due to unawareness of syntactical differences and language dependency, current search engines cannot allow web-wide parametric search (Nederstigt et al., 2014). Therefore it is difficult for customers to identify (financial) product that would best match their needs and often they are forced to make a decision only based on price characteristics. However this is suboptimal to the buyer as well as to the seller (Nederstigt et al., 2014). FLOPPIES would enable the build of a web-wide knowledge base that includes (financial) product attributes and enables product comparisons over a variety of data sources. The sellers don’t need to comply to the same data format when publishing data because the framework is ontology-based and can get product information itself without the need for a template (Nederstigt et al., 2014). This framework can thus enormously ease the comparison over financial products, given their complexity and diversity.
Another application of ontologies and LD can be found in bank stress testing. Bank stress testing relates to modeling and analyzing “exceptional but plausible” risk scenarios (Hu et al., 2014). Such risks can be for instance the 2008 banking crisis, the bankruptcy of Lehman Brothers etc. One of the major reasons for the crisis is that the financial stakeholders failed to model the “exceptional but plausible” scenarios in bank stress testing (Hu et al., 2010). Those events are highly important and beyond normal expectations and predictions and are therefore called “Black Swan” events (Taleb, 2011). There are three major challenges in the prediction of “Black Swan” events:
14
http://seigmakee.cvs.sourceforge.net/viewvc/sigmakee/KBs/FinancialOntology.kif?view=log.
15http://lsdis.cs.uga.edu/projects/meteor-s/wsdl-s/ontologies/LSDIS_FInance.owl. 16
http://www.fadyart.com/ontology.html.
17
34
Current stress testing methods rely on probability-based models and use historical financial data, such as the Value-at-Risk measure (Jorion, 1997). However “Black Swan” events are very rare and usually have no precedents.
It is difficult for stress testing scenario designers to imagine all kinds of possible scenarios, since “Black swan” events are too rare to imagine and there is a groupthink within a profession that is not easy to overcome.
The scenarios must be checked for plausibility. However it is not easy to design plausible stress testing scenarios due to the risk complexities of those events and their interactions.
35 Figure 14: BESST for stress testing (Hu et al., 2014).
36
Another development in the financial industry is proposed by (Chan and Franklin, 2011) for financial sequence prediction. As mentioned before humans are inherently limited in their ability to process information (Simon, 1982). Therefore there is the need for a decision support system to bring to foresee hidden regularities and trends in price movements included in financial news. The proposed system is again based on semantics and can extract knowledge from text, with limited human intervention (Chan and Franklin, 2011). This text-based decision support system (DSS) extracts event sequences from shallow financial text patterns and gives a prediction of the likelihood of the events occurrence using a classifier-based inference engine. It assess incoming, even new and unseen, event sequences in its predictions. Both explicit and implicit information can be accessed depending on the needs of the user. DSS uses a corpus of financial documents, extracts all of the event sequences from the texts and predicts interesting and unseen relationships between them. Traditional financial text mining techniques or knowledge discovery from text (KDT) are based on keywords and their main goal is to fill in values for predefined template slots. DSS on the other hand provides an “automated means of learning shallow event patterns from text” (Chan and Franklin, 2011). For example “shortfall”, “risk of default”, “resignation” would give an indication of possible fall in the company’s stock price, even in a case of reported sound financial figures. Opposed, “merger”, “acquisition”, “alliance” indicate an upward trend (Chan and Franklin, 2011). Furthermore methods exist to automatically discover semantic relationships between concepts (words or phrases). They are based on semantic mining, i.e. discovering of relationships on the bases of the concepts co-occurrence in the same documents/ in the same vicinity of each other within documents. One of them is the empirically proven Web mining approach by (Roussinov and Zhao, 2003) It has been applied for automated summarization of meeting messages. For this method not only the concept co-occurrence is employed but also the context is taken into account within a new developed approach called context sensitive similarity discovery (Roussinov and Zhao, 2003). Nevertheless the experiments confirm that the context is crucial for the consistency of the similarity relationships as indicated in the previous chapters.
7
Summary of the advantages of LD.
37
single global information space. As touched upon in previous sections, this is arguably the main benefit of LD from users’ perspective according to Bizer (2009) and also one of the main building blocks of the Semantic Web.
Not only are data re-use barriers lowered with LD but it also allows for higher efficiency in data re-use. This is due to the new exchange paradigm associated with it. Traditional standards foresee exchanging messages when the relevant event has occurred, e.g. after delivery, an invoice is sent. However with LD no exchange of information takes place but moreover referencing to it. Instead of exchanging data, data is kept by its source and it’s simply linked to when querying for information (Folmer and Krukkert, 2015). This reduces redundancy in information exchange by simply linking it. Furthermore in this way only one stakeholder needs to maintain certain data (a specific dataset). All other stakeholders can simply query the already maintained “up-to-date” data as needed.
38
[image:43.612.86.534.375.570.2]The greatest potential for LD according to Folmer and Krukkert (2015), however, is seen in “specifying semantics formally”. This not only contributes to interoperability improvements but the data semantics can be now used not only for semantic search, but for data integration purposes as well, i.e. linking ontologies and schemas. That way legacy systems remain unaltered, while different standards are overcome by (semi-) automated generation of transformation schema’s. However the creation of an ontology is a difficult and time consuming process, since it requires a massive amount of knowledge and time to organize a high number of concepts properly. Therefore as mentioned before there are automated and semi-automated approaches. Meijer et al. (2014) propose ATCT, Automatic Taxonomy Construction from Text, which is a framework for the automatic building of a domain taxonomy from text corpora. The taxonomy is built in four steps. First, from a corpus of documents, terms are extracted. These can be articles on a certain theme, documents from different data sources, or company’s internal documents. Then the most relevant of those terms for the specific domain are selected using a filtering approach. In the third step the selected terms are disambiguated and concepts are generated. In the final step relations between the concepts are set. This is done with a subsumption technique, which uses the concept co-occurrence in a text (Meijer et al., 2014). This process is shown in the figure below.
Figure 15: The ATCT framework (Meijer et al., 2014)
39
and understanding (Fensel and Brodie, 2003). The aforementioned taxonomy, ATCT can be used for summarizing information from different data sources, for support recommendation systems, for faceted search applications (Vandic et al., 2012) or for filtering, enriching and improving the quality of data used in support systems (Meijer et al., 2014).
As mentioned earlier current search engines are keyword-based and fail to work with syntactical differences. Furthermore they are language-dependent. Using semantics (and LD) helps in overcoming these issues. Next to that LD could also cope with (slightly) different semantics in communication and different versioning. Therefore it enables better reuse of existing data (Folmer and Krukkert, 2015). A recent development is FLOPPIES, which is a Framework for Large-scale Ontology Population of Product Information in E-commerce Stores. It is ontology-driven framework that uses the tabular data on Web store product pages and creates a structured knowledge base of product information. The proposed ontology is OntoProduct and it is mapped to the GoodRelations ontology for e-commerce. Linking to already existing ontologies or ontology mapping is really advantageous and essential, as explained in the previous sections. Since product information is formalized in the ontology, better product comparisons can be carried out and more advanced recommendation applications can be build. Furthermore there is no more need for the Web stores to provide data in a certain format. Search engines will be able to pull this information from the Web stores themselves. This information can be then easily aggregated over a variety of sources of product information (Nederstigt et al., 2014). Thereby the information heterogeneity problem will be solved, which would lead to massive improvements in business information exchange (Ng et al., 2000). Furthermore the product retrieval capabilities of the consumers will increase due to the more intelligent product search engines. The engines will provide more reliable rankings, since they can reason about product attributes’ values and how they relate to each other. For instance, if “HSPDA” is faster than “3G” and “3G” is faster than “GPRS”, a semantic search engine will be able to derive from that that “HSPDA” is faster than “GPRS”. The created knowledge database is understandable not only for humans but also for machines, which enables (semi-)automatic reasoning (Nederstigt et al., 2014). FLOPPIES can be applied to different products, also in gathering financial product information. For instance, if company A has a higher profit margin than company B and company B – higher than company C, then a semantic search engine can reason that company A has a higher profit margin than company C.