The local adsorption geometry of benzenethiolate on Cu(100)
F. Allegretti1, F. Bussolotti2&, D.P. Woodruff1, V.R. Dhanak3, M. Beccari4, V. Di
Castro4, M.G. Betti2, C. Mariani2,
1Department of Physics, University of Warwick, Coventry CV4 7AL, UK 2Dipartimento di Fisica, CNISM, CNIS, Università di Roma “La Sapienza”, Piazzale
Aldo Moro 2, I-00185 Roma, Italy
3Physics Department andSurface Science Research Centre, Liverpool University, Liverpool L69 3BX, UK
and STFC Daresbury Laboratory, Warrington WA4 4AD, UK
4Dipartimento di Chimica, Università di Roma “La Sapienza”, Piazzale Aldo Moro 2, I-00185 Roma, Italy
Abstract
The local adsorption geometry of benzenethiolate in the ordered c(2x6) phase on Cu(100) has been investigated by a combination of S K-edge near-edge X-ray absorption fine structure (NEXAFS), normal incidence X-ray standing waves (NIXSW) and S 1s scanned-energy mode photoelectron diffraction (PhD). NEXAFS and PhD show that the molecular plane is tilted from the surface normal by 2015°, while NIXSW clearly identifies the S headgroup as occupying the four-fold coordinated hollow sites. PhD shows the S atoms lies 1.340.04 Å above the outermost Cu atomic layer, leading to a Cu-S bondlength of 2.250.02 Å. The combination of the PhD and NIXSW results shows the Cu surface layer has an outward relaxation of 0.150.06 Å. Possible origins for this large adsorbate-induced relaxation are discussed.
Now at Institute of Physics, Surface and Interface Physics, Karl-Franzens University Graz, A-8010 Graz,
Austria
Corresponding author: D.P. Woodruff, Tel.: +44-247-652-3378; Fax: +44-247-669-2016
E-mail address: D.P.Woodruff@warwick.ac.uk
& Now at Japan Advanced Institute of Science and Technology (JAIST), School of Material Science,
1. Introduction
There has been considerable interest for many years in the self-assembled monolayers (SAMs) formed on noble metal surfaces by organic thiolate (RS-) molecular species created at the surface by S-H deprotonation of the thiol (RSH) or S-S bond scission of the disulfide (RS-SR). Much of this work, notably on gold surfaces, is based on deposition of the thiolates from solution, although there is also a body of work based on deposition from the gas phase under ultra-high vacuum (UHV) conditions. The resulting thiolate SAMs have actual and potential technological applications in chemical and biochemical sensing, wetting, lubrication, corrosion inhibition and molecular electronics [1, 2, 3, 4]. Despite the many experimental and theoretical investigations [1], there have been very few quantitative structural studies of the thiolate-metal interface that is a key element in gaining a detailed understanding of the adsorption and self-assembly mechanisms. In particular, the ordering of the thiolates on the surface is determined by the balance of site-specificity in the adsorption and the intermolecular interactions within the layer. The simplest model systems are the alkylthiolates (CH3(CH2)nS-), and these have been the subject of most of the structural studies so far (see, e.g. [5]), although the structure of the archetypal Au(111)/alkylthiolate SAM interface is proving highly controversial [6, 7, 8]. A slightly higher degree of complexity is achieved by adding an aromatic phenyl ring to the thiol backbone, as in the aromatic thiolates, the simplest example of which is benzenethiolate, C6H5S- (also referred to as phenylthiolate). In particular, not only does this introduce the possibility of modified intermolecular interactions in a SAM in which the molecules ‘stand up’ on the surface (with the molecular plane tilted out of the surface plane), but also of modified molecule-substrate interaction if the molecule ‘lies down’ (molecular plane near-parallel to the surface), in both cases due to the influence of the -bonding electrons of the phenyl ring.
Ni(100) [18], Mo(110) [19, 20], Rh(111) [21], are available in the literature, for which the motivation is more related to desulfurization catalysis. On all of these surfaces there is clear evidence for deprotonation of the thiol to produce the thiolate; on the transition metal surfaces this typically occurs even by adsorption at ~100 K, with further decomposition or reaction occurring below room temperature, but on the noble metal surfaces the thiolate appears to be stable at room temperature. While there are few truly quantitative determinations of the molecular orientation in these studies, selection rules in valence state photoemission or in vibrational spectroscopy provide qualitative information, and in most cases - at least at the highest coverages of the chemisorbed thiolate - the evidence is that the molecule ‘stands up’. On Mo(110), C K-edge NEXAFS (near-edge X-ray absorption fine structure) indicates the molecular plane is tilted from the surface normal by 23º [19], while on Ni(100) S K-edge NEXAFS indicates that the S-C bond (which lies in the phenyl plane in the free molecule) is ‘nearly normal to the surface’ [18]. On the Au surfaces, on the other hand, a lying-down geometry appears to be favored even at the highest coverage achievable by UHV dosing: on Au(110) this conclusion is inferred only from the maximum achievable coverage, and estimates of the van der Waals radius of the molecule [16], but on Au(111) this conclusion comes from electronic and vibrational spectroscopy [15]. On Cu(110), it appears that the benzenethiolate may lie flat at low coverage but stands up at high coverages [12]. This same behavior may be inferred for Cu(111): an early photoemission investigation of a saturation coverage at room temperature concludes that the molecules stand up [9], while a very recent STM (scanning tunneling microscopy) investigation at 15 K shows clear evidence for a lying-down species at low coverage [10]. Indeed, this STM study indicates that at cryogenic temperatures the highest achievable coverage may correspond to a lying-down state, but it is probable that further adsorption to higher coverage is kinetically hindered at this low temperature.
Here we present the results of an investigation of the local adsorption geometry of benzenethiolate on Cu(100) using a combination of S K-edge NEXAFS [22], to provide direct information on the S-C bond tilt angle, together with NIXSW (normal incidence X-ray standing waves) [23, 24] and PhD (scanned-energy mode photoelectron diffraction) [25, 26], to determine the local adsorption site and bondlengths. The interaction of benzenethiol with Cu(100) has been previously characterized by valence state photoemission and LEED (low energy electron diffraction) [14]. In particular, this investigation identified a low-coverage c(4x4) ordered phase and a high-coverage c(2x6) phase that are thought to correspond, respectively, to lying-down and standing-up molecular orientations. Note that because the Cu(100) surface is 4-fold symmetric, the surface in the c(2x6) phase comprises two rotational domains of this 2-fold symmetric structure. In the present structural investigation we focus on the Cu(100)c(2x6)-benzenethiolate saturation phase.
2. Experimental Details and Methodology
The experiments were carried out on beamline 4.2 on the Synchrotron Radiation Source (SRS) at Daresbury Laboratory, now operated by the STFC (Science and Technologies Facilities Council). This beamline [ 27 ] is fitted with a double-crystal (Ge(111)) monochromator, and a surface science end-station chamber, equipped with facilities for
in situ sample preparation and characterization by LEED and XPS (including a standard
dual anode X-ray source). A PSP Vacuum Technology concentric hemispherical analyzer, with the entrance lens at 42° to the incident photon beam and equipped with a five-channeltron detector was used to measure the energy distribution curves (EDCs) of photoemitted electrons at fixed pass energy.
The Cu(100) single crystal substrate (99.999% purity) was cleaned in situ by repeated
the molecule to dissociate. Checks of these synchrotron-radiation XP spectra following NEXAFS and PhD measurements showed no evidence of radiation damage resulting from the incident monochromated synchrotron radiation.
S K-edge NEXAFS spectra were acquired in Auger yield mode, by monitoring the intensity of the S KLL (~2100 eV) peak as a function of photon energy. Incident flux normalization was performed by dividing the signal by the drain current measured on an Al foil positioned between the monochromator and the sample.
The NIXSW technique [23, 24] exploits the X-ray standing wavefield established at a Bragg reflection from a crystal as a result of the interference between the incident and backscattered waves, the nodal planes of this wavefield lying parallel to the Bragg scattering planes of the substrate with separation equal to that of the scattering planes. Scanning the photon energy through the Bragg condition changes the phase of the X-ray standing wavefield, shifting the position of the nodal planes perpendicular to the scatterer planes. Because this standing wavefield extends well beyond the crystal surface, adsorbate atoms are immersed in it, and the X-ray absorption at an adsorbate atom depends on its location relative to the standing wavefield nodal planes. A measurement of this adsorbate atom X-ray absorption as a function of the photon energy, when scanned through the Bragg peak, thus provides a means of determining the layer spacing of the adsorbed atom relative to the scattering planes. The use of normal incidence to the scatterer planes renders the experiment rather insensitive to crystal mosaicity. A particular valuable NIXSW measurement may be conducted normal to the crystal surface, as this provides the adsorbate atom layer spacing perpendicular to the surface. In addition, for a surface having higher than two-fold rotational symmetry, a second NIXSW measurement from just one additional set of scatterer planes (not parallel to the surface) allows one to triangulate the atomic position, thus fully determining the lateral registry of the adsorbate with respect to the underlying surface.
geometry was optimized for each Bragg reflection by adjusting the position of the reflected X-ray beam until it passed back down the beamline and hit an annular phosphorescent screen, through the center of which the incident beam entered the chamber. The S absorption profile was measured by monitoring the S 1s photoemission, the photon energy being stepped in 0.1-0.2 eV increments over a range of about 25 eV through the Bragg condition. At each photon energy the S 1s EDC was recorded together with the secondary electron background emission at a kinetic energy around 10 eV higher to provide a separate off-peak signal characteristic of the NIXSW absorption in the underlying bulk crystal. As a further check of the integrity of this background signal as a monitor of the substrate absorption, some similar NIXSW measurements were made which included simultaneous measurement of the substrate Cu 2p3/2 EDCs. The total electron yield was also recorded during these measurements. Normalization to the incident photon flux was accomplished by measuring the drain current at an Al foil positioned between the monochromator and the sample. To extract the NIXSW absorption profiles the intensities of the individual EDCs were integrated after background subtraction, and normalized to the average value far away from the Bragg condition.
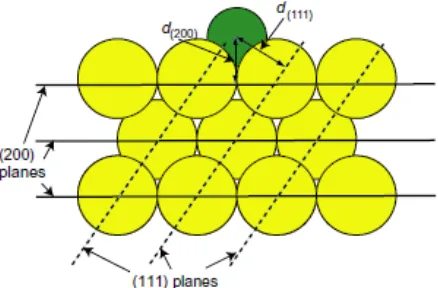
the S 1s peak areas. The key experimental differences are that in PhD it is the direction of the photoelectron emission, rather than the photon incidence, that is significant, and both the photon energy range and the size of the photon energy steps used in PhD are much larger than in NIXSW. Specifically, a photon energy range of 300 eV with steps of 2 eV were used to the PhD measurements in just two emission directions, normal emission, and at a polar emission angle of 50º in the [001] azimuth. This off-normal emission direction corresponds to that which would lead to 180º backscattering from a nearest-neighbour Cu atoms of a S atom adsorbed in a four-fold coordinated hollow site 1.5 Å above the surface (see Fig. 1). The integrated areas of the S 1s peaks in each of the individual EDCs were then plotted as a function of photoelectron energy and each final PhD modulation spectrum was obtained by subtraction of, and normalization by, a smooth spline function representing the non-diffractive intensity and instrumental factors. These PhD modulation spectra were used in the structure analysis described below.
In general, for a complete structure determination using PhD, it is important to measure such data in a wider range of emission directions in order to achieve a unique structure determination. In the present investigation our objective is narrower. The NIXSW measurements provide identification of the S bonding site on the Cu(100) surface in a very direct way and, as we show below, identify this to be the four-fold coordinated hollow site. However, NIXSW measures the location of this S atom relative to the extended lattice of the crystalline substrate in which the standing wavefield is established, and not the location of the S relative to the outermost layer Cu atoms which may be relaxed inwards or outwards relative to the bulk. For a known adsorption site a small subset of PhD spectra, recorded in directions corresponding to near-neighbor backscattering (~180º) geometries, provide a means to determine these near-neighbor distances precisely.
3. Results
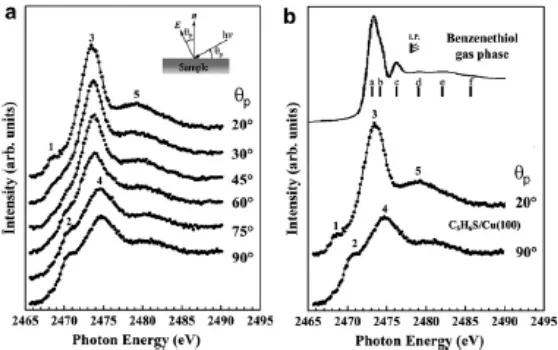
Fig. 2a shows a series of S K-edge NEXAFS spectra for the Cu(100)c(26)-C6H5S surface, recorded at different values of the grazing angle, p. As is usual in NEXAFS, this incidence angle is defined between the direction of the incoming linearly polarized X-ray radiation and the surface plane, rather than the surface normal (the experimental geometry is schematically sketched in the inset). Note that this definition means that p is also the angle between the polarization vector of the incident radiation (E in the figure)
and the surface normal. Also shown in Fig. 2b is a comparison of two of these spectra, recorded at normal incidence (p=90º) and at the most grazing incidence (p=20º), with the equivalent spectrum recorded from gas-phase molecular benzenethiol by Dezarnaud
et al. [ 31 ]. Much the most dominant feature in the thiolate spectra, with a strong
dependence on the direction of the polarization vector, is that labeled (3) in Fig. 2; this can clearly be correlated with peak (a) in the gas-phase spectrum that has been identified as a *(S-C) resonance. This same attribution has been given to an analogous dominant feature in S K-edge NEXAFS from benzenethiolate on Ni(100) [18], as well as in alkylthiolate species on Cu surfaces [32, 33]. Notice that a *(S-C) resonance will have its maximum peak intensity when the polarization vector of the incident radiation is aligned along the S-C bond direction. The fact that this feature is most intense in Fig. 2a at the most grazing incidence geometry clearly indicates that the S-C bond must stand up on the surface, well out of the surface plane.
This *(S-C) resonance is clearly identified as an intramolecular scattering resonance of known symmetry and is thus the only feature that can definitely assist us in determining the surface molecular orientation. We may, however, comment briefly on a few other features of the spectra. First, the absence of the gas-phase spectral peak (c) from the adsorbed thiolate is consistent with the fact that this feature was attributed to a *(S-H) in the intact thiol. Secondly, we note that the ‘pre-edge’ feature labeled (1) in the adsorbate thiolate spectra is probably attributable to the presence of a small amount of coadsorbed atomic S also seen in the XPS spectra, as noted above. Thirdly, it is clear that peak (4), seen at normal incidence, is distinct from peak (3), with an energy difference of 1.8 eV. We should stress that the spectra of Fig. 2 cannot be accounted for by a smaller number
and peaks (3) and (4), are equivalent); while the absolute photon energy scale is not fully calibrated, the reproducibility was excellent and the recorded spectra did not depend on the order of data collection. The detailed origin of peak (4), and indeed of the remaining features in the spectra from the surface phase, is unclear. In the gas-phase spectrum of the intact thiol the additional features in this energy range are attributed to Rydberg states and double ionisation [31], but both of these are likely to differ in energy, even if they are present, for the adsorbed species. Substrate scattering will certainly lead to structure(s) in this energy range (this is, in effect, low-energy SEXAFS) and is probably more important, but there is no simple qualitative way of evaluating these effects; it is notable, though, that similar effects have been seen in other NEXAFS spectra for thiolates on Cu surfaces. The fact that peaks (3) and (4) do have different origins, however, is important in trying to quantify the determination of the S-C bond orientation on the surface through analysis of the polarization angle dependence of the intensity of the *(S-C) resonance.
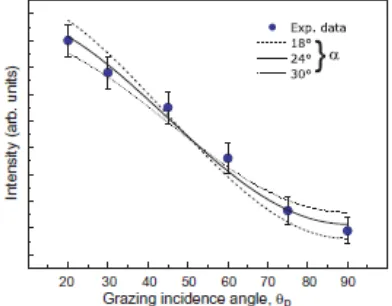
The intensity variation of the *(S-C) resonance with the grazing incidence angle may then be modeled for different values of the angle, , between the surface normal and the S-C bond direction according to the equation given by Stöhr and Outka [19], namely: (1 0.5(3 cos2 1)(3 cos2 1)) (1 )sin2
3 p 2
P P
I C
(1)
where C is a constant and P is the degree of linear polarization, given as 0.85 for this
beamline [27]. A least-squares fit of the experimental data to this equation (Fig. 4) leads to an optimum value of the S-C bond tilt angle, , of 24º. Also shown in this figure are the curves generated by equation (1) for alternative values of 18º and 30º . On the basis of Fig. 4 we may therefore conclude that the S-C tilt angle away from the surface normal is 24±6º. We should stress, however, that the experimental points shown in Fig. 4 are sensitive to the exact assumptions (number of peaks, peak position and width, relative ratio of the step heights) underlying the fitting of the NEXAFS spectra such as those shown in Fig. 3. This will certainly introduce a systematic error into the determination of the tilt angle, in addition to the random errors reflected in the scatter of data points in Fig. 4. It seems appropriate, therefore, to be more conservative and revise our estimate of the precision to be, at best, ±10º, a value more typically cited in other NEXAFS studies involving near-perpendicular molecular orientations.
3.2 NIXSW
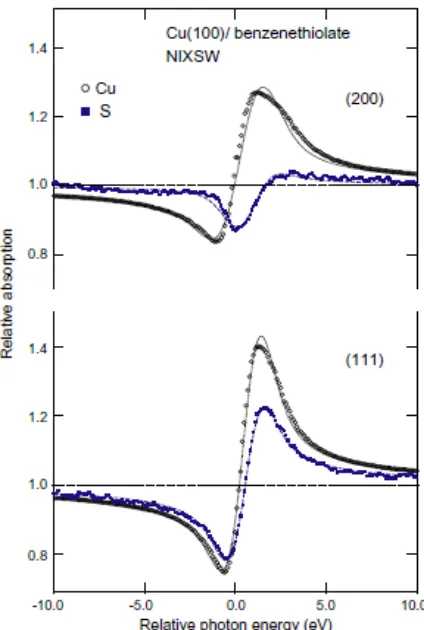
The NIXSW absorption profiles obtained by monitoring the S 1s photoemission signals as the photon energy was stepped through the (200) and (111) reflection conditions are shown in Fig. 5; also shown are the absorption profiles of the Cu substrate. These experimental NIXSW profiles were analyzed using the XSWfit automated fitting procedure [35]. NIXSW analysis provides two structural parameters [23, 24, 36]: the coherent position dH (where H specifies the Miller indices of the scatterer planes) and the coherent fraction fco. In the simplest case of an absorber occupying a single well-defined site, dH is equal to the perpendicular distance of this site from the scattering planes, while
to the finite resolution of the monochromator) and the absolute energy of the Bragg reflection EB. These parameters were determined by fitting the substrate standing wave profile and were then fixed for the analysis of the adsorbate absorption profiles, which were therefore fitted by only adjusting the adsorbate structural parameters.
Also shown in Fig. 5 are the theoretical curves for the best-fit values of the structural parameters given in Table 1. These functional fits, based on monitoring 1s photoemission signals, include the contribution of non-dipole effects in the angular dependence of the photoemission leading to a forward-backward asymmetry parameter Q and a small offset
in the coherent fraction due to a phase factor introduced by these non-dipole effects. The values of these correction terms have been determined in previous calibration experiments for the Cu(111) and (200) NIXSW energies [37]; for S 1s photoemission at these energies the Q values for both the (111) and (200) conditions are essentially zero,
but nevertheless there is a phase factor correction to the coherent positions of 0.04 Å. One measurement of the S absorption profile monitoring the S KLL Auger electron emission at ~2100 eV, which is not influenced by these effects in the photoelectron angular distribution, provided an independent check on the weak influence of this asymmetry in the S 1s photoemission data.
An important feature of the results of Table 1 is that the coherent fraction values for both (200) and (111) NIXSW conditions are high (>0.8) and similar to the values for the copper substrate, implying that the S atoms are located in, or close to, a single high-symmetry adsorption site. Under these conditions this site can be identified by simple triangulation. Specifically, if the height of the absorber atom above the (200) scatterer planes is z(200), then one can calculate the height above the (111) scatterer planes, z(111) for the two highest-symmetry sites to be:
atop: z(111)=z(200) sin 35.26° = z(200) /3 (2a)
hollow: z(111)=(z(200) + D(200)) sin 35.26° = 0.5 D(111) + (z(200) /3) (2b)
Fig. 6 shows this triangulation for the hollow site.
symmetry operation) which correspond respectively to these atop and hollow values of
z(111), and the summation over these two sites in XSW actually leads to a coherent fraction of zero, and thus no meaningful value of the coherent position [38]. Because an XSW experiment only determines an absorber location relative to the nearest extended substrate scatter plane (Fig. 6), the general relationship between the coherent position for a single adsorption site and its associated height above an actual scatterer plane (on an ideal-terminated bulk crystal) is given by zH = dH + nDH, where n is an integer. The true
value of n can generally be established quite easily, as only one value leads to physically
plausible adsorption bondlengths. Table 1 shows the consequences of assuming that n=0
for both NIXSW conditions. Clearly, the experimental data are consistent with the S atoms occupying the four-fold coordinated hollow site on the surface at a height above the outermost Cu layer of an unrelaxed substrate of 1.49 Å, corresponding to a S-Cu bondlength of 2.32 Å. Notice that if we assume z(111) = d(111) + D(111) (taking n=1 in this case), the triangulated predictions for the atop and hollow site are inverted in Table 1, implying that the structure corresponds to atop site adsorption, but with a S-Cu bondlength of an implausibly large value of 3.30 Å. This formal ambiguity in the triangulation arises because in the hollow site an adsorbed atom is in an atop site relative to the second substrate layer, but at a height that is one substrate layer spacing higher.
Clearly, the NIXSW results show that the S atom of benzenethiol does occupy the hollow site on Cu(100), at a height of 1.490.05 Å above the nearest extended (200) substrate scattering plane. The exact S-Cu bondlength, however, cannot be obtained from the NIXSW data without information concerning the relaxation of the interlayer spacings of the underlying Cu(100) surface. In this respect, the PhD measurements provide valuable complementary information.
3.3. PhD
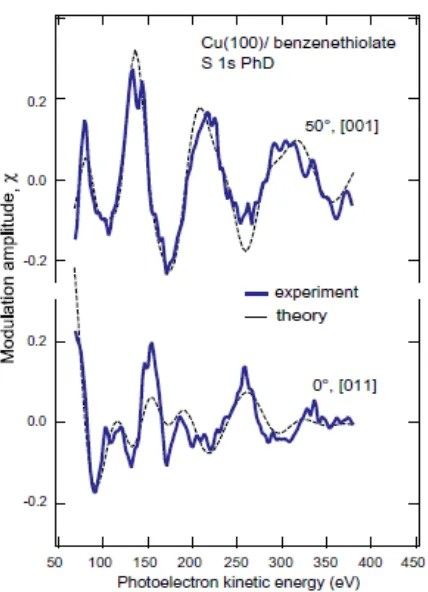
are shown in Fig. 7. While two spectra are generally insufficient to allow a unique surface structure determination in the absence of other information, here they form a valuable complement to the NIXSW results in that whereas NIXSW is sensitive to the location of the S atom relative to the underlying bulk crystal, PhD is most sensitive to the location of the near-neighbor atoms. In particular, the 50°, [001]-azimuth emission geometry was chosen to correspond approximately to the direction of a S-Cu nearest-neighbor bond direction for the hollow adsorption site identified by NIXSW. In this geometry, corresponding to approximately 180° backscattering from this nearest-neighbor Cu atom, the PhD spectrum is expected to be dominated by the scattering of this atom, leading to strong modulations with a single dominant period (in electron momentum) that allow precise determination of the S-Cu bondlength. Fig. 7 shows clearly that this emission geometry does have these anticipated characteristics. By contrast, the normal emission spectrum shows more fine structure and may be expected to show additional sensitivity to the location of sub-surface atoms, and thus to the surface relaxation.
To extract detailed information from these experimental spectra we have applied the standard methods of PhD data analysis, performing multiple scattering simulations for a range of trial geometries to achieve the best fit to the experimental spectra. In the present case, however, only geometries based on hollow site adsorption were investigated. The calculations were performed with computer codes developed by Fritzsche [39, 40, 41] that are based on the expansion of the final state wave-function into a sum over all scattering pathways that the electron can take from the emitter atom to the detector outside the sample. The quality of agreement between the theoretical and experimental modulation amplitudes is quantified by the use of an objective reliability factor (R-factor)
defined [25, 26] such that a value of 0 corresponds to perfect agreement and a value of 1 to uncorrelated data. Different model structures were initially tested on a grid-search of structural parameters, but this structural optimization to locate the minimum R-factor was
Rmin, following an approach developed by Pendry for LEED [42]. All parameter values giving structures with R-factors less than Rmin+ Var(Rmin) are regarded as falling within one standard deviation of the ‘best fit’ structure [43]. We should stress that the PhD technique is primarily a probe of the local adsorption structure. In general, the technique
is dominated by the role of electron scattering from the (strongly-backscattering) substrate atoms, allowing one to determine the molecule-substrate registry and near-neighbour bondlengths. Intramolecular scattering does play some role, and can provide a sensitivity to molecular orientation, but the low atomic number elements that make up the molecule are weak scatterers. Intermolecular scattering, on the other hand, rarely is significant, so the technique has little or no sensitivity to the long-range ordering of the molecular layer, or indeed, whether or not this layer is long-range ordered. An implicit assumption in most PhD studies, however, is that only a single local site is occupied. Alternative situations can be investigated, but here we focus on this single-site model. The validity of this assumption will be addressed in Section 4.
Initially calculations were conducted with only a single isolated S (emitter) atom on the Cu(100) surface, ignoring the effects of intramolecular scattering and intermolecular scattering. Comparing the results of these isolated-atom calculations with the experimental spectra of Fig. 7, for different heights of the S emitter atom above the outermost Cu layer, and for different relaxations of the outermost two Cu layers, yielded lowest values of the combined R-factor for the two spectra of around 0.40, a figure that
reflects only modest agreement. However, these calculations gave R-factors for the 50°
emission spectrum as low as 0.12, but values for the normal emission spectrum of more than 0.81. Evidently, these calculations describe the near-180° nearest-neighbor backscattering geometry at 50° polar emission angle well, but give a very poor description of the normal emission spectrum in which a single Cu backscattering atom no longer dominates.
all the C-C distances are 1.40 Å [ 44 , 45 ]; the H atoms were not included in the calculations as these are extremely weak scatterers. As in the single-atom calculations, models were explored involving different heights of the molecule above the outermost surface layer, and different surface relaxations, but in addition different molecular orientations were explored. In these calculations the orientation of the molecule was defined by a set of three Euler angles, (, , ), as used in earlier PhD studies of planar molecular adsorbates [46, 47 , 48 ]. The Euler angles relate the Cartesian coordinate systems fixed relative to the surface (xI,yI,zI) and relative to the molecule (xM,yM,zM), the three rotation angles being performed in sequence about zI, xMand zM, as described in Ref. [48]. The case of ===0 describes the situation in which the molecule is fully upright with its molecular plane in the [011] azimuth, and if =0, then and
correspond to the azimuthal twist and polar angle tilt of the molecular plane, respectively. Non-zero values of allow one to define more complex situations; in the present situation was initially assumed to be zero on the basis that this describes retention of some element of molecule/substrate symmetry, and subsequent calculations allowing this parameter to go free led to near-zero optimal values.
Including this intramolecular scattering led to a pronounced improvement in the description of the normal emission PhD modulation spectrum, and substantial lowering of the R-factors for both PhD spectra to values of 0.07 (50° spectrum) and 0.21 (0°
spectrum) with an overall R-factor of 0.10. The excellent fit implied by these low values
is clearly seen in the theory-experiment comparison shown in Fig. 7. The optimal values of the Euler angles and their estimated precision, based on the variance of the R-factor,
were found to be =30(+25/-30)°, =1010°, and =-330°. Fig. 8 shows two views of the adsorbate structure corresponding to this best-fit geometry. The poor precision in
respectively). The tilt angle of =1010° appears more significant and is consistent with the NEXAFS value of 2410°; we will discuss this more fully in the following section.
As may be expected, the PhD calculations show far greater sensitivity to the location of the S emitter atom relative to the near-neighbor Cu backscattering atoms. A consistent result is that the S atom lies 1.340.04 Å above the outermost layer of Cu atoms. Notice that this value may be compared with the NIXSW value of the height of the S atom above the nearest extended bulk scatterer plane of 1.490.05 Å. At first sight, these two values appear to be incompatible, but it is important to recognize that PhD measured the local S-Cu interlayer spacing, whereas NIXSW measures the location of the S atom relative to the nearest extended bulk scatterer plane (Fig. 6). These two results can therefore be reconciled if there is a net outward relaxation of the outermost Cu surface layers of 0.150.06 Å. The PhD simulations provide some explicit support for this view, with an optimum value of this outward relaxation of ~0.14 Å, although the precision in the outermost interlayer spacings is marginal, being 0.09 Å for the outermost layer spacing
z12 (expanded by 0.09 Å relative to the bulk value) and substantially worse (0.20 Å) for
the second-to-third layer spacing z23 (expanded by 0.05 Å). These precision values reflect
the dominance of the scattering contributions of the nearest-neighbor outermost layer Cu atoms, followed by the next-nearest-neighbor second layer Cu atom, together with the relatively large variance due to the use of only two experimental PhD spectra.
4. General Discussion and Conclusions
constrained – notably the assumption that all intramolecular bondlengths and bond orientations are identical to those of the free molecule. In the case of the NEXAFS result, on the other hand, we have already stressed that for complex spectra comprising several overlapping structures the resulting tilt angle is sensitive to the exact method of extracting the polarization-angle dependence of the intensity of the S-C -resonance from the experimental spectra, leading to probable systematic errors. In view of this, we may regard the level of agreement between the two techniques as satisfactory, the combined measurements indicating a molecular tilt angle of approximately 2015°. This value is in good agreement with the results of an independent NEXAFS investigation at the C K-edge [49], which indicate that the aryl ring of the molecule is tilted by 20° from the surface normal.
The NIXSW results clearly identify the S adsorption site as in the four-fold coordinated hollow site, a conclusion strongly supported by the excellent agreement achieved in the PhD simulations for this site. The PhD results identify the S-Cu nearest-neighbor interlayer spacing as 1.340.04 Å, implying a Cu-S bondlengths of 2.250.02 Å. In addition, however, and combined with the NIXSW results, it appears that the outermost Cu surface layers are relaxed outwards by a net value of 0.150.06 Å. Such a large adsorbate-induced relaxation of any metal surface is certainly not usual, and may be a consequence of the long-range ordering in this system (see below). In this regard it is interesting to compare our present results with those of NIXSW investigations of related molecules on Cu(100). In particular, an earlier study of methylthiolate adsorption yielded a value of d(200) of 1.37 0.05 Å [50], while a more recent investigation of the adsorption of 2-mercaptobenzoxazole (MBO, C7H5NOS) yielded a value for this same parameter of 1.33 0.05 Å [29]. Comparison of the raw S (200) NIXSW absorption profiles in these two publications with the data of Fig. 5 shows very clearly that the present data do reflect a significantly different value of d(200); specifically, while this profile in Fig. 5 shows the
methylthiolate and MBO.
In trying to understand the origin of the larger outward relaxation of the Cu(100) surface in the presence of benzenethiolate, rather than these two earlier studies of methylthiolate and MBO, a key factor may be the nature of the long-range ordering. In the case of MBO a simple (2x2) ordered phase is formed at saturation coverage, consistent with a coverage of 0.25 ML with one molecule per surface unit mesh. In this case the implicit assumption of the NIXSW interpretation that there is only a single local site occupied is appropriate, and there is no evidence of any kind of reconstruction of the Cu(100) surface in such a simply-related surface phase. In the case of methylthiolate on Cu(100) it appears that modest exposures (~5x10⁻⁶ mbar·s) such as that used in the NIXSW investigation of this surface, lead to a coverage of ~0.25 ML [51], consistent with a (2x2) ordering seen in scanning tunneling microscopy (STM [52]). However, the STM study also revealed that at high exposures a c(2x6) phase is formed, thus adopting the same periodicity as that of the benzenethiolate structure investigated here. In view of this, some of the other findings of this earlier study appear to be of considerable relevance to the interpretation of the present work.
of methylthiolate on Cu(100) [52] found that only small islands of a c(2x2) overlayer structure could be formed, co-existing with clusters of apparent vacancies, a result broadly consistent with this expectation, the defected regions presumably allowing local strain and thus stress relief. Indeed, this same investigation [52] showed that on Cu(410), a surface comprising narrow (100) terraces separated by surface steps, a local c(2x2) overlayer does form, but on such a narrow terrace, stress relief perpendicular to the steps
can easily be accommodated by strain at the down-step terrace edges. However, at sufficiently high adsorbate exposures on the (100) surface, the STM images show a transformation into a heavily defected c(2x6) phase. The rationale suggested for this longer-range periodicity is that at sufficiently high coverage stress relief is achieved by a periodic buckling of the surface, leading to the 'x6' component of the c(2x6) ordering. As the c(2x6) phase is formed from a surface already containing regions of local c(2x2) ordering, the implied thiolate coverage for the true ordered c(2x6) phase is 0.5 ML, corresponding to three thiolate species per surface unit mesh.
In fact a c(2x6) periodicity has also been observed by STM (and LEED) in an investigation of hexanethiolate on Cu(100) in which the S adsorption site was also identified as the four-fold coordinated hollow by S K-edge SEXAFS [32]. In this study the coverage was also estimated through XPS measurements to be 0.300.03 ML, apparently corresponding to 2 molecules per primitive surface unit mesh (coverage 0.33 ML); the authors propose a structural model with local c(2x2) ordering, but with every third <100> row of molecules missing to produce the c(2x6) unit mesh. This provides a rationale for the c(2x6) unit mesh without recourse to the buckling suggested in the study of the methylthiolate overlayer, while the authors argue that the higher (0.5 ML) coverage of the methylthiolate overlayer is precluded for hexanethiolate by the lateral dimensions of the alkyl chain.
long-range order is c(2x2), with all molecules in identical local sites, but with rumpling the c(2x6) periodicity may be achieved, although formally the molecules are no longer all in identical local sites, but will occur at two or more slightly different heights above the underlying substrate, thus leading - indeed - to a slight asymmetry of the local adsorption sites. Our NIXSW data would show minimal sensitivity to these effects; the value of
d(111) will be the weighted mean of the different heights, and the small range of heights
will lead to a small reduction in the expected value of f(111). For the PhD data, particularly
bearing in mind the small sub-set of spectra used here, the expected modulations from each of the slightly different sites will differ minimally, because the height of the S emitter atom above the nearest-neighbour Cu atoms will remain essentially the same. In effect, at a sufficiently local level, these sites are all equivalent. As the 0.50 ML rumpled structure provides a rationale for the observed surface layer relaxation, whereas the lower coverage 0.33 ML does not, we conclude that the higher-coverage model is more probable.
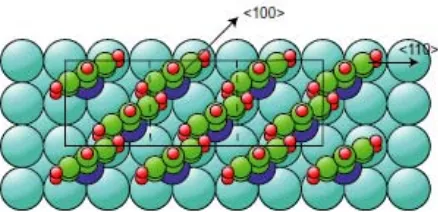
Of course, one important question is whether a coverage of 0.50 ML of benzenethiolate on this surface is sterically possible. Fig. 9 shows a plan view of the model of this ordered structure in which only the lateral c(2x2) periodicity is visible, and not the displacements perpendicular to the surface that would characterize the rumpled c(2x6) phase. In this diagram the molecule is shown in the orientation corresponding to the best-fit geometry of the PhD analysis. As shown, it appears that the molecules are probably too close together, but a modest azimuthal rotation would alleviate this problem. Here we should stress that the azimuthal angle is effectively the parameter of the PhD analysis, for which the value obtained was 30(+25/-30)°, effectively including all possible azimuthal orientations on the 4m-symmetry substrate. What is clear from Fig. 9, however, is that an azimuthal angle of 0° (aligned along a <110> direction) or 45° (aligned along a <100> direction) would both lead to significant steric problems, whereas some intermediate value may be acceptable. In this regard, it is tempting to regard the fact that the best-fit value of does have an intermediate value as significant.
model of the long-range ordering give no direct insight into the nature of the intermolecular interactions that may determine the ordering. Our rationale for the pronounced surface relaxation in terms of a rumpled surface, and the suggestion that this may be driven by adsorbate-induced surface stress, is also only speculation. Clearly it would be of interest to investigate these effects further. Density functional theory (DFT) total energy calculations may provide some important answers, but an experimental investigation of the coverage dependence of the surface relaxation for one or more of these Cu(100)/thiolate systems may also prove to be illuminating.
Acknowledgements
Table 1
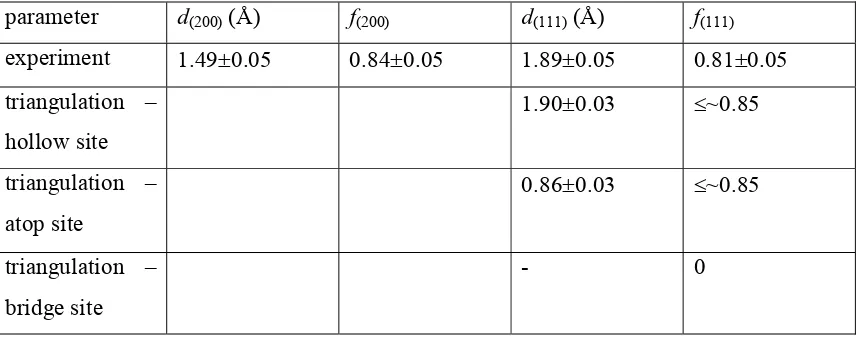
NIXSW structural parameter values for the S atom in Cu(100)/benzenethiolate. Based on the height of 1.490.05 Å for the S atoms above the (200) scatterer planes, implied by the experimental value of d(200), the values of the (111) structural parameters expected from
different high-symmetry adsorption sites are compared with the experimental values.
parameter d(200) (Å) f(200) d(111) (Å) f(111) experiment 1.490.05 0.840.05 1.890.05 0.810.05 triangulation –
hollow site
1.900.03 ~0.85
triangulation – atop site
0.860.03 ~0.85
triangulation – bridge site
Figure Captions
Fig. 1 Schematic diagram showing the experimental geometry for S 1s PhD data
collection from a Cu(100) surface. The smaller adsorbate atom in the four-fold coordinated hollow site describes a possible location of the S atom in the benzenethiolate adsorbate.
Fig. 2 (a) Experimental S K-edge NEXAFS spectra from the Cu(100)c(2x6)-C6H5S
[image:24.595.97.376.446.621.2]Fig. 3 Examples of the curve fitting of the angle-dependent S K-edge NEXAFS spectra
[image:25.595.96.294.106.391.2]from the Cu(100)c(2x6)-C6H5S surface phase (see text for details).
Fig. 4 Normalized *(S-C) resonance intensity (blue dots) from the S K-edge NEXAFS
[image:25.595.94.290.446.599.2]Fig. 5 (2 0 0) and (1 1 1) NIXSW profiles from the Cu(100)c(2x6)-C6H5S surface phase,
Fig. 6 Side view of a Cu(100) surface with S adsorbed in the hollow site, showing the
[image:27.595.95.314.108.252.2]Fig. 7 Experimental S 1s PhD modulations spectra from the Cu(100)/benzenthiolate
surface recorded in two different emission geometries, compared with the results of multiple-scattering simulations for the structural model giving the best fit, as described in the text.
Fig. 8 Plan (top) and perspective views of the best-fit adsorption geometry of
[image:28.595.94.317.513.639.2]Fig. 9 Plan view of a model of the c(2x6)-benzenethiolate phase on Cu(100) based on a
[image:29.595.92.311.106.212.2]References
[1] F. Schreiber, Progr. Surf. Sci. 65 (2000) 151.
[2] G.M. Whitesides, J.P. Mathias, C.T. Seto, Science 254 (1991) 1312. [3] L.H. Dubois, R.G. Nuzzo, Annu. Rev. Phys. Chem. 43 (1992) 437. [4] A. Ulmann, Chem. Rev. 96 (1996) 1533.
[5] D.P. Woodruff, Appl. Surf. Sci. 254(2007)76.
[6] Miao Yu, N. Bovet, C.J. Satterley, S. Bengió, K.R.J. Lovelock, P.K. Milligan, R.G. Jones, D.P. Woodruff,V.R. Dhanak, Phys. Rev. Lett. 97 (2006) 166102.
[7] P. Maksymovych, D.C. Sorescu, J.T. Yates Jr., Phys. Rev. Lett. 97 (2006) 146103. [8] R. Mazzarello, A. Cossaro, A. Verdini, R. Rousseau, L. Casalis, M.F. Danisman, L. Floreano, S. Scandolo, A. Morgante, G. Scoles, Phys. Rev. Lett. 98 (2007) 016102.
[9] P.A. Agron, T.A. Carlson, J. Vac. Sci. Technol. 20 (1982) 815.
[10] K. Wong, K. Kwon, B.V. Rao, A. Liu, L. Bartels, J. Am. Chem. Soc. 126 (2004) 7762.
[11] P.A. Agron, T.A. Carlson, W.B. Dress, G.L. Nyberg, J. Electron Spectrosc. Relat. Phenom. 42 (1987) 313.
[12] W. Shen, G.L. Nyberg, J. Liesegang, Surf. Sci. 298 (1993) 143.
[13] S.E. Anderson, G.L. Nyberg, J. Electron Spectrosc. Relat. Phenom. 52 (1990) 735. [14] V. Di Castro, F. Bussolotti, C. Mariani, Surf. Sci. 598 (2005) 218.
[15] C.M. Whelan, C.J. Barnes, C.G.H. Walker, N.M.D. Brown, Surf. Sci. 425 (1999)
195.
[16] D.M. Jaffey, R.J. Madix, J. Am. Chem. Soc. 116 (1994) 3020.
[17] S.M. Kane, T.S. Rufael, J.L. Gland, D.R. Huntley, D.A. Fischer, J. Phys. Chem. B 101 (1997) 8486.
[18] Y. Takata, T. Yokoyama, S.Yagi, N. Happo, H. Sato, K. Seki, T. Ohta, Y. Kitajima, H. Kuroda, Surf. Sci. 259 (1991) 266.
[23] D.P. Woodruff, Prog. Surf. Sci. 57 (1998) 1.
[24] D.P. Woodruff, Rep. Prog. Phys. 68 (2005) 743.
[25] D.P. Woodruff, A.M. Bradshaw, Rep. Prog. Phys. 57 (1994) 1029. [26] D.P. Woodruff, Surf. Sci. Rep. 62 (2007) 1.
[27] A.W. Robinson, S. D’Addato, V.R. Dhanak, P. Finetti, G. Thornton, Rev. Sci. Instr. 66 (1995) 1762.
[28] C.J. Powell, A. Jablonski, NIST electron effective-attenuation-length database, NIST Standard Reference Database 82, NIST, Gaithersburg, USA, 2003.
[29] F. Allegretti, D.P. Woodruff, V.R. Dhanak, C. Mariani, F. Bussolotti, S. D'Addato, Surf. Sci. 598 (2005) 253.
[30] V. Di Castro, private communication.
[31] C. Dezarnaud, M. Tronc, A.P. Hitchcock, Chem. Phys. 142 (1990) 455.
[32] H. Kondoh, N. Saito, F. Matsui, T. Yokoyama, T. Ohta, H. Kuroda, J. Phys. Chem. B 105 (2001) 12870.
[33] H. Rieley, G.K. Kendall, A. Chan, R.G. Jones, J. Lüdecke, D.P. Woodruff, B.C.C. Cowie, Surf. Sci. 392 (1997) 143.
[34] S.A. Sardar, J.A. Syed, S. Yagi, K. Tanaka, Thin Solid Films 450 (2004) 265.
[35] XSWfit is a procedure, written as an Igor-Pro macro, which automatically fits XSW data. It is based on the formalism originally developed by D.P. Woodruff in Fortran for calculating the XSW profile for a given set of parameters. A copy of the Igor routines can be obtained from R.G. Jones, email: robert.g.jones@nottingham.ac.uk.
[36] J. Zegenhagen, Surf. Sci. Rep. 18 (1993) 199.
[37] J.J. Lee, C.J. Fisher, D.P. Woodruff, M.G. Roper, R.G. Jones, B.C.C Cowie, Surf. Sci. 494 (2001) 166.
[38] D.P. Woodruff, B.C.C. Cowie, A.R.H.F. Ettema, J. Phys.: Condens. Matter 6 (1994) 10633.
[39] V. Fritzsche, J. Phys.: Condens. Matter 2 (1990) 1413. [40] V. Fritzsche, Surf. Sci. 265 (1992) 187.
[41] V. Fritzsche, Surf. Sci. 213 (1989) 648.
[43] N.A. Booth, R. Davis, R. Toomes, D.P. Woodruff, C. Hirschmugl, K.-M. Schindler, O. Schaff, V. Fernandez, A. Theobald, Ph. Hofmann, R. Lindsay, T. Giessel, P. Baumgärtel, A.M. Bradshaw, Surf. Sci. 387 (1997) 152.
[44] B. Rozsondai, G. Schultz, I. Hargittai, J. Mol. Struct. 70 (1981) 309.
[45] G. Schultz, I. Hargittai, M. Kolonits, J. Garbarczyk, J. Mol. Struct. 160 (1987) 267. [46] T. Gieel, O. Schaff, R. Lindsay, R. Terborg, P. Baumgärtel, J.T. Hoeft, M. Polcik, A.M. Bradshaw, A. Koebbel, D.R. Lloyd, D.P. Woodruff, J. Chem. Phys. 110 (1999) 9666.
[47] R. Terborg, M. Polcik, J.T. Hoeft, M. Kittel, M. Pascal, J.H. Kang, C.L.A. Lamont, A.M. Bradshaw, D.P. Woodruff, Surf.Sci. 457 (2000) 1.
[48] F. Allegretti, M. Polcik, D.P. Woodruff, Surf. Sci. 601 (2007) 3611.
[49] M. Beccari, A. Kanjilal, S. Morpurgo, M.G. Betti, C. Mariani, L. Floreano, A. Cossaro, V. Di Castro, unpublished work.
[50] M.S. Kariapper, C.J. Fisher, D.P. Woodruff, B.C.C. Cowie, R.G. Jones, J.Phys.: Condens. Matter 12 (2000)2153.
[51] A. Imanishi, S. Takenaka, T. Yokoyama, Y. Kitajima, T. Ohta, J. Phys. IV France 7 (1997) C2-701.
[52] S.M. Driver, D.P. Woodruff, Surf. Sci. 488 (2001) 207.
[53] G.J. Jackson, D.P. Woodruff, R.G. Jones, N.K. Singh, A.S.Y. Chan, B.C.C. Cowie, V. Formoso, Phys. Rev. Lett.84 (2000) 119.