Image guided surgery and the added value of augmented
reality
Implementation of the Microsoft HoloLens as aid for maxillofacial oncologic resection surgery master thesis Technical Medicine, University of Twente, August 2017
Author: Haye Glas
Master student Technical Medicine Medical imaging & interventions M3 Clinical internship
Members of the thesis committee:
Chairman Prof. dr. ir. C.H. Slump
Medical supervisor Dr. M.J.H. Witjes
Technical supervisors Dr. ir. F. van der Heijden
J. Kraeima, MSc.
Process supervisor Drs. B.J.C.C. Hessink-Sweep
Institutions:
Abstract
Current routine in oral and maxillofacial surgery relies on the use of patient specific virtual planning, which is translated into the OR by the use of 3D printed guides or per-operative navigation. For translation towards the surgical procedure, a workflow is proposed that enables a per-operative visualisation and interaction with the specific planning and navigation data. The surgeon will be able to obtain details of the pre-operative planning that are not available in current workflows. An augmented reality interface is developed which can be used in a range of image-guided surgeries as an addition to current existing verified image guidance systems. A validation study is performed comparing user performance between the augmented reality interface and the gold-standard (Brainlab) (N=12 users). Twelve participants are asked to complete several navigation tasks with both interfaces using a purpose build phantom. Participants were divided into two equal groups, the first group started the task with the augmented view, the second group started using the Brainlab interface. The interface meets satisfaction in terms of user-friendliness, potentially improves accuracy and reduces OR time. First clinical application was performed including per-operative usage in oncologic resection surgery as well as patient education and multi-disciplinary consultations.
TABLE OF CONTENTS
1. Introduction 4
1.1. Surgical navigation 4
1.2. Augmented reality 5
2. System requirements 6
3. System design 8
3.1. Overview 8
3.2. Detailed description 9
3.2.1. OpenIGTLink 9
3.2.2. Volume to surface data 10
3.2.3. Coordinate systems 10
3.2.4. Projection 11
3.2.5. Shaders 12
3.2.6. Input: gestures and voice 13
3.3. Use 14
4. Validation: User performance study 16
4.1. Overview 16
4.2. Materials and methods 17
4.2.1. Phantom 17
4.2.2. Tasks and participants 17
4.2.3. Measurements 18
4.3. Results 19
5. Discussion 22
6. Conclusion 24
7. Future 25
1. Introduction
Medical imaging started in 1895 with Rontgen images and has since evolved into an entity capable of multi-modal, 4D imaging, and obtaining information on a molecular level.1 Understanding complex anatomy and pathology plays a key role in patient treatment, especially with modern imaging techniques where increased information is acquired. Increased image quality is one side of the spectrum, representing medical data visually in an effective and intuitive way is another challenge. Current routine in oral and craniomaxillofacial surgery (CMF) relies on the use of preoperative image data which is then converted into a 3D patient specific surgical planning. 3D visualizations are used daily to plan and predict the outcome of complicated surgery. Using CAD/CAM constructed surgical resection guides, patient specific reconstruction plates and per-operative navigation, the preoperative plan is translated into the operating room. Incorrect positioning of guides leads to deviations from the planed surgery.2 An improved per-operative, decision supportive, visualisation of the pre-determined plan could aid the translation of the surgical plan to the OR.
With the introduction of image guided surgery (IGS), interaction with the data is getting more important. IGS systems offer benefits not only for patient safety and surgical outcome, but they also improve orientation in the surgical field. This helps surgeons to identify anatomical structures, shorten the time needed for surgery and reduce the workload.3 While treatment of maxillofacial patients is using 3D reconstructions since 1983, even today most visualisations used in pre-operative planning and per-operative support are presented on regular 2D monitors.4 In most operating rooms the surgeon may only view patient data on wall-fixed screens, or view information from a distance. Displaying navigation data on nearby 2D screen forces the surgeon to mentally fuse the surgical plan with the current surgical view. This causes the surgeon to divert his sight and attention, which leads to excess surgical time and is error-prone.5 Moreover, interaction with the data requires the surgeon to ask for someone to control the viewer, or to exit the surgical field. The introduction of augmented reality (AR) and head-mounted displays (HMDs) can overcome these issues.
1.1 Surgical navigation
done either using predefined anatomical landmarks or surface based. After registration, the patients head can be mobilized freely without the need to revise the registration because the reference sensor is rigidly attached to the skull. Some of the current limitations and drawbacks of using intraoperative navigation include the ease-of-use, the required space for the navigation system and the difficult hand-eye coordination if the screen is in a different orientation than the surgical field.6–8To overcome some of these drawbacks, mobile screens have been used. Dash by Brainlab uses an Ipod touch as an instrument mounted screen, wrapped in a sterile bag for intraoperative use. Such instrument mounted display decreases operating time and steepens the learning curve associated with surgical navigation.9,10
1.2 Augmented reality
A head-mounted display (HDM) is a device worn on the head or a part of a helmet, with one or two small displays in front of the user. Most HDMs use opaque screens, although some use see-through lenses or screens. See-through screens enable the user to be aware of his surrounding while a virtual image is projected. Combining the real world with the computer-generated image is called augmented reality or mixed reality. HDMs, virtual (VR) and augmented reality (AR) are nowadays most popular in the gaming industry, however some medical applications are being explored. Medical VR applications mostly include simulation and training, but can also be used for treatment. VR simulations allow the surgeon to rehearse a procedure using patient-specific imaging. VR can provide surgeons with a sense of familiarity during an operation and shorten the time it takes to orient oneself in the surgical field, reducing operating time, error rate and improving accuracy.11,12 While a VR environment provides a complete immersive experience, AR provides a surgeon with direct spatial perception of the real word, overlaying the virtual images onto the anatomy of the patient.13 Some surgical microscopes use imaging data to augment the viewing area of the microscope. However, those systems are expensive, cumbersome to manoeuvre and not as universal to be suitable for every intervention.14,15Translucent displays between the workspace and the surgeon is another way for augmenting the view. These systems need tracking of the surgeon’s eyes in order to align the augmented visualization with the real world. Another drawback of such a translucent display is the problem of not providing a common focal plane, forcing the surgeon to focus on either the virtual images or the patient.16 Projection directly onto the patient overcomes this, but still the surgeon’s eyes have to be tracked for 3D augmented visualisations.14,17,18Video-based solutions consisting of miniature monitor and video cameras have also been explored, but suffer from parallax effects and reduced visual quality of the real world scene. 19
A workflow is proposed that enables a per-operative interaction with 3D patient specific planning and navigation data during oncologic resection of CMF patients. The Microsoft HoloLens HMD is used for augmenting the surgeons view during surgery with the preoperatively made surgical plan. To support surgeons during medical interventions, a system is developed to visualise image data near the patient and in spatial correlation to the patient. The goal of the system is to aid the surgeon in translating the 3D surgical plan to the patient by increased visual feedback, improving eye-hand coordination. The surgeon will be able to obtain details of the pre-operative plan that in current workflows are not available. The system is validated by comparison with the current workflow. The AR interface meets satisfaction in terms of user friendliness, potentially improve accuracy and reduce OR time. The system can be used in a range of image-guided surgeries, without the need to replace existing verified image guidance systems.
2. System requirements
In the current workflow of oncologic resection surgery, a surgical plan is made based on preoperative imaging. Typically cone-beam CT (CBCT) data is used for segmenting bone structures, where MRI data is used for tumour segmentation. Hereafter resection margins and optionally a reconstruction is planned. In the operating room the surgical plan is downloaded onto the navigation system, where after the surgeon performs a registration between patient and the preoperative data. To visualize the surgical plan and navigation data in 3D and without special restrictions, a stereoscopic HMD is needed. The medical data must be streamed or downloaded from the navigation system onto the HMD. The size of a typical CBCT used for 3D virtual planning is around 300MB and has a voxel size of 0.4 x 0.4 x 0.4 mm. Surface models reconstructed from the surgical plan must contain the same level of detail, around 800 vertices/mm2. In total system must be capable of rendering a million vertices while maintaining a minimum frame rate of 30 fps, preferably 60 fps for spatial stable visualisations.25 For per-operative visualisation of the navigation data, the commercially available navigation system Brainlab is used for tracking the patient and instruments. Instrument tracking must be updated every frame and have a low latency to provide a real-time experience.
Translucent screens allow the surgeon to view the virtual content as well as the work area. Resolution of the screens must be comparable to currently used 2D screens and be sufficient for the surgeon to obtain small details of the medical data. To be a natural extension of the surgeon’s senses it has to be light and comfortable to wear for at least 30 minutes. Moreover, the HMD should be untethered to ensure freedom of movement of the surgeon. The HMD should know its orientation in the room to be able to render content wherever the surgeon prefers. The HMD should allow voice and gesture input for the surgeon to interact with the virtual contend while maintaining the sterile field. The HoloLens is one of the newest augmented reality HMD’s. It has stereoscopic translucent screens and uses spatial mapping of its surrounding to estimate its orientation. The HoloLens features multiple microphones that can be used for voice input and sensors that recognize gestures.
Table 1. Summary of the key design requirements HMD
Stereoscopic displays 720p
Comfortable to wear >30 min
Not limit freedom of movement untethered
Sufficient battery life >2 hrs
Interaction while maintaining sterile voice/gesture sensors
Interface
Load surgical plan DICOM, >300MB
Convert DICOM to surface mesh 700 vertices/cm^2
Total setup time <10 min
Instrument tracking >60 Hz, latency <50 ms
Stereoscopic rendering >30 fps, 1,000,000 vertices
Navigation performance
User performance non-inferior to current workflow in means of: Accuracy Following trajectorys
Reaching landmarks
Duration navigation tasks
3.
System design
This section describes the design of the system and how the hardware is combined to visualise 3D patient data. The system includes software implementation that connects the navigation hardware with the HoloLens. The system includes an interface in which patient specific data can be picked from the 3D planning directory. The patient- and navigation data is then visualised on the HoloLens. Hereafter easy to use interaction commands should enable the surgeon as end user to interact with the 3D virtual planning content.
3.1 Overview
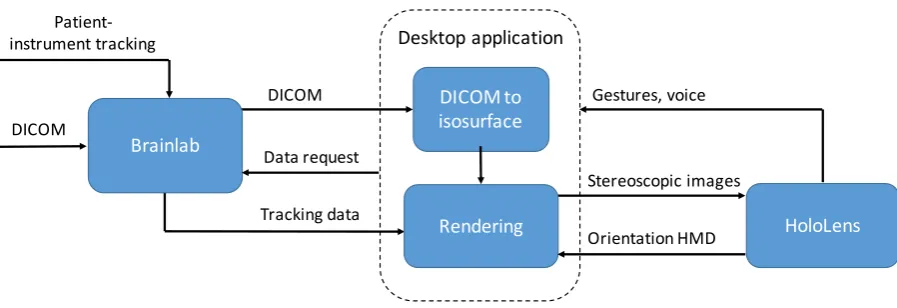
The system will function parallel to the existing workflow. It visualises information of the navigation hardware on the HMD instead of the conventional 2D screen. In the current workflow, the commercially available navigation system Brainlab is used. This navigation system is validated and routinely used in hospitals around the world. Brainlab uses a stereoscopic infrared sensitive camera to track the patient as well as some instruments used by the surgeon. Figure 1 shows an overview of the current workflow and the additional HMD. Basically, the designed system has to handle 3 tasks, retrieve the surgical plan and navigation data from the navigation hardware, process images, and present them to the surgeon. Meanwhile user input should enable interaction with the virtual content. An overview of the hardware components is seen in figure 2. To enable communication between Brainlab and the HoloLens a desktop computer is used. The desktop computer receives the premade surgical plan as well as tracking data of the surgical tools. Optionally raw volumetric image data can be send from Brainlab to the desktop computer. Stereoscopic rendering is done on the desktop computer and streamed to the HoloLens through Wi-Fi. Additionally, input from the HoloLens is streamed back to the desktop application and processed there. A more detailed description is seen in figure 3.
Figure 1. Overview of the current workflow (blue) and additional HMD (light blue).
Patient imaging
(CT / MRI) Surgical plan
Navigation
(Brainlab)
Conventional 2D screen
Stereoscopic HMD Per-operative Pre-operative
Surgeon
Surgical plan
Tracking data Patient-instrument tracking
3.2 Detailed Description
3.2.1 OpenIGTLink
[image:9.595.92.490.79.238.2]OpenIGTLink is an open-source network protocol for image-guided therapy (IGT) specifically developed for standardization of communication between medical equipment in the operating room. Integrating the OpenIGTLink protocol enables transfer of image and tracking data from the navigation system to the HoloLens during a clinical case. The protocol is able to transfer tracking data up to 1024 fps with sub-millisecond latency, Image data can be streamed up to 32 fps. OpenIGTLink supports several types of data messages, for example a single position can be obtained or a stream of affine transformation matrices. As image data is only needed ones, DICOM data is downloaded when the application starts. Hereafter each predefined volume of the surgical plan is downloaded as well. Tracking data is requested and received per rendered frame. Implementation of OpenIGTLink can be done in several ways. For C/C++ applications either the low-level C code or the OpenIGTLink Library can be used. The
[image:9.595.74.523.366.520.2]Figure 3. Block diagram of the system showing the data streams. Left: the Brainlab navigation hardware using OpenIGTLink. Middle: Desktop application used to process volume- and tracking data and render images for the HoloLens.
Figure 2. Overview of the design. On the left the conventional Brainlab navigation system. On the right, the surgeon wearing the HoloLens. In the middle, a desktop computer running the application. All hardware communicates using a dedicated router.
HoloLens
DICOM DICOM to
isosurface
Rendering
Desktop application
Tracking data
Gestures, voice
Stereoscopic images
Brainlab Data request
Orientation HMD DICOM
simple C code contains structures for image and transform message headers as well as supporting functions to create message packets. Using the OpenIGTLink Library a TCP/IP socket communication is already implemented. This is not only the most convenient way of implementation, but also the safest due to the included cyclic redundancy check (CRC).24 The main benefit of a TCP/IP connection is that multiple devices can be connected, each communicating individually.
Brainlab enables communication using OpenIGTLink, named ‘Research Link’.24 OpenIGTLink is an optional feature on the Brainlab systems, and is not part of our current Brainlab licence. After consultation with Brainlab they kindly granted us access to the correct licenses for the duration of this research project.
Connection between the desktop computer and the HoloLens is also using a TCP/IP socket connection. Microsoft released a Holographic Remoting Player application that must be installed on the HoloLens OS in order to establish a connection.25 With this application we can stream holographic content from a desktop computer to the HoloLens in real-time. To reduce the number of wireless hops and ensure the best possible performance we connected the PC with an Ethernet cable to a dedicated ac802.11 Wi-Fi router. A typical remoting connection is reported to have as low as 50 ms of latency.25 The desktop application receives an input data stream from the HoloLens, renders the stereoscopic images, and streams these frames back to the HoloLens to be displayed. Data from the HoloLens to the computer include position estimation of the HoloLens itself as well as voice and gesture input.
3.2.2 Volume to surface data
3D image data is downloaded from Brainlab to the desktop application where it is converted into surface objects using the open source Visualisation Toolkit (VTK). The volume data consist of MRI or CT data and pre-operative defined objects from the planning-software (Iplan Cranial, Brainlab AG, Munich). Volume data is converted into surface objects for ease of rendering. Volumetric visualisation provides more information, but is computational more expensive. The volume data is segmented based on voxel intensity using a marching-cubes algorithm.26A isovalue is specified to reconstruct a surface based on the skin of the patient. Alternatively, the isovalue can be adjusted to reconstruct other structures like bone tissue. The isosurface polygon data consists of vertices, indices (triangles) and vertex normal vectors. Subsequently this polygon data is visualised on the HoloLens using DirectX11. As VTK uses a counter-clockwise vertex order for polygons, and DirectX a clockwise vertex order, the y- and z- components of the indices is switched.
3.2.3 Coordinate systems
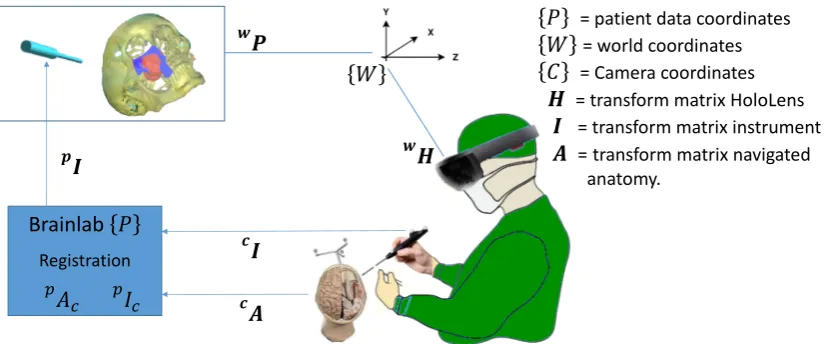
coordinate system. The content of the scene transforms relative to this world coordinate system. This approach is most convenient for rendering world locked content, without a fixed relationship to the position of the patient. To enable rendering of the content superimposed on the patient, the coordinate systems of the HoloLens and the navigation system have to be linked. Currently the two devices are unaware of each other’s orientation, as seen in figure 4.
If registration of the patient with the image data is performed, Brainlab defines the coordinate system of the first image set as the patient coordinate system. All object and tracking-data obtained through OpenIGTLink are specified in this patient coordinate system, which is measured in millimetres. While the HoloLens uses a coordinate system measured in meters, for correct visualisation all objects and transformations are scaled.
3.2.4 Projection matrix
In order to project a 3D scene onto a 2D plane a projection matrix is used. Two of the most common projection methods are orthographic- and perspective projection.27 Orthographic projection leaves the x- and y- coordinate of a point unchanged, while setting the z-coordinate to zero. In real live, objects that are further away appear smaller. For realistic 3D perception of objects, a perspective projection matrix is used. Using a perspective projection, parallel lines from an object are generally not parallel after projection. The stereoscopic displays will further improve depth perception. In order for each eye to perceive a correct visualisation, the interpupillary distance (IPD) can be set individually on the HoloLens and a second projection and view matrix is used based on this IPD. The HoloLens continually tracks the position and orientation of the user’s head relative to its surrounding. When an application prepares a frame to be rendered, the system predicts where the user’s head will be at the moment this frame will be displayed. Because this prediction is based on the latency of the render pipeline, a high frame rate will improve hologram stability. The HoloLens calculates the view and projection transforms for each frame based on this prediction. If these system-supplied transforms are not used, the hologram will not stay aligned with the real world.
!
"
!# Brainlab $
Registration %&
' %(' *"
+,
+
-.
$ = patient data coordinates
. = world coordinates
/ = Camera coordinates
- = transform matrix HoloLens
" = transform matrix instrument
[image:11.595.81.498.268.440.2]# = transform matrix navigated anatomy.
3.2.5 Shaders
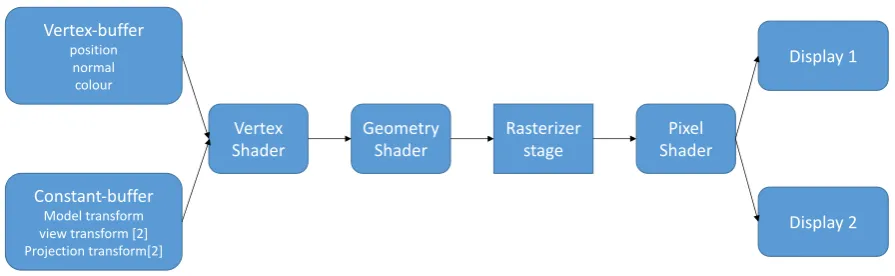
In order to be able to see realistic 3D holograms stereoscopic rendering is needed. Not only stereoscopic rendering is needed to have a depth perception, lighting is as well. Without reflection of light objects appear flat, e.g. a ball is seen as a sphere. Shaders are small, low-level programs that are compiled and run at specific stages in the graphics pipeline. The DirectX rendering pipeline uses the High-Level Shading Language to create C like programmable shaders. In this application one of the simplest versions of a graphics pipeline is used, figure 5 shows a block-diagram of this pipeline. This pipeline consists of a vertex, geometry and a pixel shader. In the future, this pipeline can be expanded to support features like transparency and more advanced lighting.
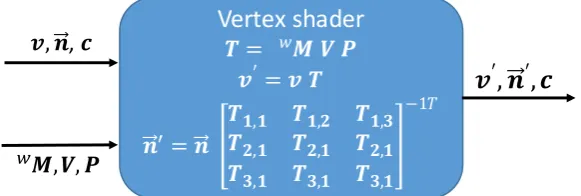
[image:12.595.79.527.274.412.2]Vertex shaders are executed for each vertex in a scene. Vertex shaders are used to transform the object into world coordinates, correct for perspective view and project the object onto the screen. The vertex shader uses a constant- and vertex-buffer as input. The vertex-buffer contains information about the geometry of the virtual objects like 3D vertex positions, per-vertex normal and colour data. The constant-buffer provides the model, view and projection matrices. Every frame the constant buffer is updated with a new model transformation matrix, which is then multiplied in the vertex shader. For correct transformation of a vertex normal, only the rotation component of the transformation matrix is used. To be able to render content in stereo, the view and projection constant buffer consists of an array of two matrices, one for each display. As the vertex shader is executed for each vertex, the output data structure is equal to the input, only the positions and normal vectors are transformed into the view coordinate system. The input, output and transformations of the vertex shader are seen in figure 6.
Figure 5. Overview of the DirectX11 Rendering pipeline. Only the rasterizer stage is nonprogrammable using the HLSL language.
Geometry
Shader ShaderPixel
Vertex-buffer position
normal colour
Constant-buffer Model transform view transform [2] Projection transform[2]
Vertex Shader
Display 2 Display 1
The geometry shader is a pass-through shader, only used for indexing for stereoscopic rendering. The rasterization stage decides which pixels cover the geometry of the meshes and computes interpolated per-vertex data for each pixel. The rasterizer stage then invokes a pixel shader once for each pixel. A pixel shader enables shading techniques such as textures, per-pixel lighting and post-processing. Different kind of light reflection makes objects visible. Ambient or diffuse illumination has no specific source or direction, it will act like a filter on the colour of the object. Directional or specular light does have a direction, and therefore can be reflected by objects, providing a basic perception of depth. Because we did not use a constant-buffer for any light information, a static directional light source is defined in the pixel shader, needed for Blinn-Phong shading. 28,29 Shading is implemented following equation 1.
𝐸 = 𝑅 𝐼&+ 𝑅 cos 𝑖 + 𝑤(𝑖) cos (𝑠)0 𝐼1 (1)
Where 𝐸 is the intensity of light reflected from the surface onto the camera, 𝑅 is the reflection coefficient of the surface (0 ≤ 𝑅 ≤ 1), 𝐼& is the intensity of the diffuse incident light, 𝑤 is the specular reflection coefficient specific for each material, 𝑖 is the angle between the incident light and the surface normal, 𝑛 is a fudge factor that can be arbitrary adjusted, 𝑠 is the angle between the camera and the light reflection direction, 𝐼1 is the intensity of the specular incident light.
3.2.6 Input: gestures and voice
Traditionally interaction with a computer is done with a mouse and keyboard. With the HoloLens, gaze tracking can be used as cursor. The position and orientation of the device is used for ray casting. When the ray-cast collides with a virtual object, a circularly cursor is drawn. When the ray-cast does not collide with any objects, it is still shown to the user as a small spot light. This enables the user to maintain track of its gaze, and thus orientate oneself easier in the scene. The HoloLens currently recognises two gestures, of which one can be used for development of applications. The supported gesture is an ‘air-tap’ gesture. The air-tap is used in two ways. When the air-tap is performed quickly it acts as a mouse click used to invoke a response. When the air-tap is hold, it functions as a manipulation gesture. While the manipulation gesture is active, translation of the hand is tracked. Both hands are recognized by the HoloLens, and can be used simultaneously for manipulation gestures. However, we choose to develop the interface in such manner that only one hand is required. This
Vertex shader
! = $% & '
(′ = ( !
*′ = *
!+,+ !+,- !+,. !-,+ !-,+ !-,+ !.,+ !.,+ !.,+
−11 (, *, 2
$,&, ' 3
[image:13.595.166.457.89.187.2](
′, *
′, 2
Figure 6. Input and output of the vertex shader. Where vector 𝒗 = [𝒙, 𝒚, 𝒛, 𝟏] is the vertex position, 𝒏??⃗ = [𝒙, 𝒚, 𝒛] the vertex normal vector, ⬚C𝑴 the 4 x 4 model
prevents that hand tracking is lost when they are crossed in front of the HoloLens. Moreover, during surgery the surgeon can use one hand for operating and one for interaction. The manipulation gesture is used for translation, rotation and scaling of the holograms. To change the position of the hologram, the user has to gaze at the hologram itself while starting a manipulation gesture. Translation of the hologram is done in the world coordinate system and follows the direction of the manipulation gesture. That means that the hologram will not only follow the gestures, but also the position of the user. This enables the user to grab a hologram, walk to the desired location and then perform final position adjustments. Besides hand gestures, voice commands can be used to control the scene. Voice commands are mainly used for functions that cannot be integrated in an intuitive way in the visualisation. Moreover, voice commands prevent the surgeon’s hands from having to leave the working area. Coarse changes in rotation and scaling can be done with commands such as: “make bigger” or “Rotate left”. Every voice command consists of two or more syllables and similar sounding commands are avoided. This is done to ensure every voice command is interpreted unambiguously. Because the HoloLens features directional microphones, background noise is filtered and only voice commands from the user are recognized.
3.3 Use
4.
Validation: User performance study
4.1 Overview
[image:16.595.175.420.293.542.2]A validation was performed by comparing user performance using the traditional navigation interface and the augmented reality interface. Participants are asked to perform some basic navigation tasks resembling a clinical setting. The primary outcome is accuracy of the navigation, the task completion time and tool-path length. The time and path length provide a measure of operation time and potential tissue damage. The secondary outcome is the user satisfaction. A questionnaire about the interface; its performance, workability and change in workflow is used. A summary of the key design requirements is found in table 2.
Table 2. Summary of the key design requirements, where the ‘Navigation performance’ is the primary outcome.
HMD
Stereoscopic displays 720p Comfortable to wear >30 min Not limit freedom of movement untethered Sufficient battery life >2 hrs
Interaction while maintaining sterile voice/gesture sensors
Interface
Load surgical plan DICOM, >300MB Convert DICOM to surface mesh 700 vertices/cm^2 Total setup time <10 min
Instrument tracking >60 Hz, latency <50 ms Stereoscopic rendering >30 fps, 1,000,000 vertices
Navigation performance
User performance non-inferior to current workflow in means of: Accuracy Following trajectorys
Reaching landmarks
4.2 Materials and method
4.2.1 Phantom
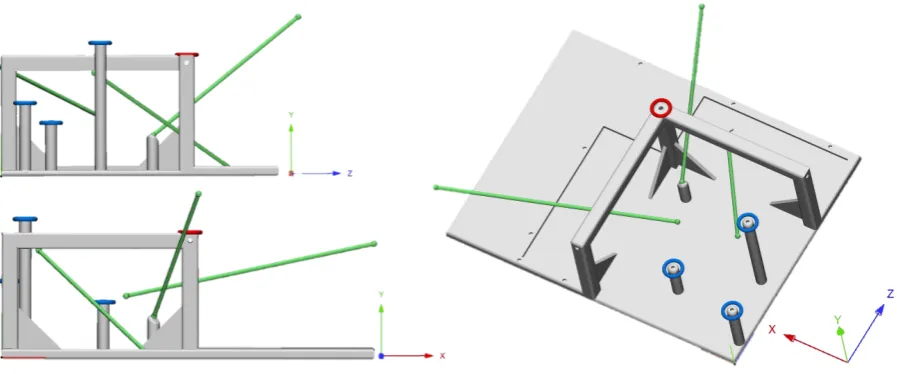
[image:17.595.75.524.373.560.2]A 3D printed phantom was designed and is used as a navigation test object. The phantom is designed such that it does not represent any anatomical structures, to exclude an anatomical experience bias of senior surgeons. It ensures that all participants are equally familiar with the shape of the object and participants cannot orient themselves on prescience. The phantom is 3D printed where after a CBCT scan is made. The navigation reference star is securely mounted onto the phantom using a surgical screw. The phantom has cylindrical holes where the Brainlab pointer can be inserted. After scanning the phantom, the scan is uploaded into planning software Iplan Cranial (Brainlab AG, Munich) where landmarks and trajectories are defined. Figure 8 shows the phantom, trajectories and landmarks.Three landmarks are placed at corresponding physical landmarks on the phantom, where six other landmarks are free-floating or placed such that the user doesn’t receive physical feedback when the landmark is reached. Three trajectories are defined by connecting the free-floating landmarks.The free-floating landmarks and trajectories enforce the user to use the navigation system in order to reach the desired destination instead of relying on the physical geometry of the phantom. The trajectories are defined such that the participant had to navigate a linear path in different directions nonparallel to one of the phantom or CBCT axis.
Figure 8. Phantom and ‘surgical plan’. Grey: 3D printed phantom. Blue: physical landmarks. Green: floating landmarks with connecting trajectories.
4.2.2 Task and participants
Twelve participants are asked to complete several navigation tasks with both the Brainlab interface and the augmented visualisation. The participants are divided into two equal groups, the first group started the test with the augmented view, the second group started using the Brainlab interface. Participants had different levels of experience with the navigation system, some use it daily while other have never used it. Participants are aged between 23 and 57 years.
or trajectory is started from a fixed instrument position in the middle of the phantom. When the participant thought to have reached a landmark, a voice command is used to record the current position of the navigation pointer. After acoustic feedback confirmed the position was recorded, the participant was allowed to continue. When the landmark was reached or the trajectory completed, the instrument was brought back to its initial position before a new task was started. Before measurements where recorded, each test person was allowed to practice for 5-10 minutes with the navigation system as well as with the HoloLens. Participants were asked to perform the test as precise and fast as possible. There was no obligatory order for the tasks. Participants were allowed to adjust the view of the Brainlab screen as well as the orientation of the hologram in between navigation tasks.
4.2.3 Measurements
During the test positions and orientation of the instrument is recorded as well as the time it takes to complete the task. Three-dimensional coordinates of the tool tip were recorded every frame, approximately 60 times per second. The length of the toolpath is calculated using the Euclidian distance between consecutive positions. The moment the participant indicated he had reached a landmark, the Euclidian distance between the tip of the navigation instrument and the landmark is used as a measure of accuracy.
The perpendicular distance between the tool-path and the planned trajectory is calculated following equation 2. This is done for every instrument position recorded along the trajectory.
𝑑 = 𝒍HI𝒍J × 𝒑I𝒍J
𝒍HI𝒍J (2)
where 𝑑 = distance in mm, 𝒍M= 𝑥, 𝑦, 𝑧 and 𝒍Q= 𝑥, 𝑦, 𝑧 representing the start and endpoint of the planned trajectory. 𝒑 = 𝑥, 𝑦, 𝑧 represents the current position of the tip of the instrument. Consecutively the root-mean-square (RMS) deviation for every trajectory is calculated using equation 3.
𝑅𝑀𝑆 = &JHT&HHT⋯T&VH
0 (3)
Where 𝑑 = distance in mm, 𝑛 = number of recorder points along the trajectory.
4.3 Results
Overall completion time using the HoloLens was a factor 1.71 shorter compared to the conventional Brainlab interface (P = 0.034). Three participants where faster or equally fast using Brainlab. Navigating the trajectories was a factor 1.89 faster using the HoloLens (P < 0.01) while navigating the landmarks was a factor 1.74 faster (P = 0.025).
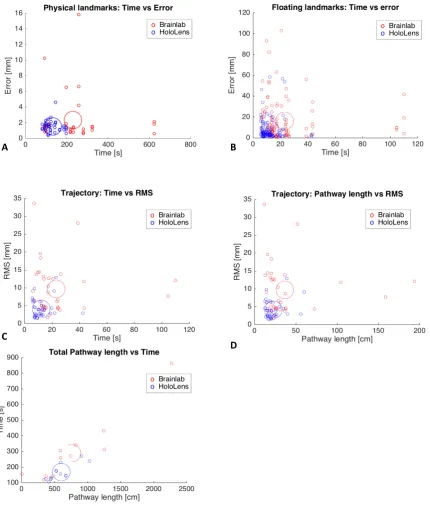
Accuracy of reaching the landmarks was significantly better using the HoloLens for the floating landmarks (P < 0.001), but not for the physical landmarks (P = 0.087). Deviation from the planned trajectories was smaller using the HoloLens (P<0.001). There was no significant difference in the loss of tracking (P = 0.21). Figure 9 shows the accuracy and time results of the separate tasks. Figure 10 shows scatter plots of time, toolpath and accuracy for different tasks.
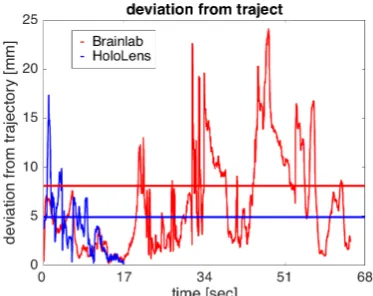
[image:19.595.44.558.370.554.2]The total pathway length was not significant different between both interfaces (P = 0.20), but following the trajectories the pathway was shorter using the HoloLens (P = 0.035). A visual comparison of the combined toolpaths from all participants navigating one of the trajectories is shown in figure 11. The spread of the toolpaths using the Brainlab interface is larger compared to the HoloLens interface. Figure 12 shows a graph of the orthogonal distance of the instrument to a trajectory of one participant.
Figure 9. Left: The mean, standard deviation and 95% confidence interval of the separate navigation tasks using the two systems. Right: Boxplot of the results, the circles indicate mean values.
* = significant Mean [s] sd [s] lower CI [s] upper CI [s]
Brainlab 23.1 22.7 15.4 30.8
HoloLens 12.2 6.9 9.8 14.5
Brainlab 229.9 153.8 126.6 333.3
HoloLens 131.8 36.4 108.7 155
Brainlab 288.5 207.3 156.8 420.2
HoloLens 168.4 51.5 135.7 201.2
Mean [mm] sd [mm] lower CI [mm] upper CI [mm]
Brainlab 2.33 2.9 1.38 3.27
HoloLens 1.52 0.74 1.27 1.76
Brainlab 2.33 2.9 1.38 3.27
HoloLens 1.52 0.74 1.27 1.76
Brainlab 9.67 7.01 7.3 12.04
HoloLens 4.09 2.5 3.25 4.92
Mean [%] sd [%] lower CI [%] upper CI [mm]
Brainlab 1.40 2.61 0.00 3.06
HoloLens 0.47 0.96 0.00 1.09
Tracking lost Trajectory time*
Landmark time*
Overall time*
Accuracy floating landmarks*
A B
C
E
[image:20.595.87.518.95.602.2]D
Figure 11. Visual comparison of toolpaths of all participants following one trajectory. Green: planned trajectory. Red: toolpaths using Brainlab. Blue: toolpaths using the HoloLens
[image:21.595.207.394.443.591.2]Twelve participants completed the questionnaire. Despite participants where relative unfamiliar with VR/AR and gesture based interaction, they found the tasks more difficult to perform using the traditional interface compared to the hologram. On a scale of 1 – 5 on how difficult it was to perform the tasks 66.7% answered with a 2 or less using the hologram, where using the traditional interface scored 4 or higher. Results of the VAS-scored questions are seen in table 3.
5. Discussion
In recent years, augmented reality used for medical applications has gained popularity and new applications are explored. As current use of image guided surgery still has some drawbacks like the lack of ease-of-use and difficult eye-hand coordination we believed augmented reality could overcome some of these limitations and potentially improve surgery.6–8We developed a single technique that can be used in a range of image-guided surgeries, without the need to replace existing verified image guidance systems.
The augmented reality visualisation improves accuracy for navigating tasks while reducing time. The navigation tasks included following trajectories and reaching physical and free-floating landmarks. The reason why there was no significant difference in accuracy for the physical landmarks is because the participants navigated until they received haptic feedback through the pointer which indicated they had reached the destination. Some of the participants did not rely on the navigation system for reaching the physical landmarks. After a while participants knew where to go and did not use conventional- or holographic interface. Although accuracy was not improved for these physical landmarks, participants needed less time to reach them using the HoloLens. The free-floating landmarks give a better representation of navigating soft tissue in a clinical setting. Using the HoloLens, the overall pathway length of the instrument was not shorter compared to the Brainlab interface, however it was shorter during navigation of the trajectories. Looking at figures 9 and 10 it looks like the participants where more certain of the instrument position using the HoloLens, and they spend less time searching for directions. Combined with a smaller deviation from the trajectory the HoloLens provides a better hand-eye coordination, potentially leading to less tissue damage. Despite the participants where relatively unknown with VR/AR and gesture based applications, they found performing the tasks easier using the HoloLens. Intuitiveness of interaction commands was rated above average while real-time experience was rated the highest. Even though there was not a significant difference between the time tracking was lost, some participants showed a decrease of 8.5% using the augmented reality interface. When tracking of the instrument or the patient is lost during surgery, the surgeon shifts his focus from the patient to the navigation hardware.
mean VAS-Score (1-5)
Difficulty performing tasks using Brainlab 3.25
Difficulty performing tasks using HoloLens 2.2
Intuitiveness voice commands 3.6
Intuitiveness gestures 3.05
Real-time experience 3.8
Familiarity with VR/AR 2.5
Familiarity with gesture based interaction 2.05
Strengths and weaknesses
Familiarization with an anatomical structure was prevented by using an artificially shaped phantom. However, the phantom is rectangle and scanned such that the shape was aligned with the sagittal, transversal and coronal axis, which could aid in orientation and eye-hand coordination using the Brainlab interface. In a clinical setting the navigated scene will almost never have any rectangle shapes, but the surgeon might be more familiar in the scene due to prescience of the human anatomy. Moreover, the navigation screens where located ideally during the test, namely straight ahead in front of the user. In a clinical setting this will not always be feasible. Using virtual landmarks and trajectories made it mandatory to rely solely on the navigation system, preventing visual feedback of the phantom. Whenever possible a surgeon will try to use this visual feedback and knowledge of the anatomy to orient oneself, however this is not always possible. Sometimes the anatomy has changed compared with the preoperative imaging or a position needs to be identified which is placed in an empty space, e.g. after tumour resection.
Pathway length was calculated by the sum of Euclidean distances between two consecutive positions. However, using this method will add noise from the system to the pathway length. Even when the instrument is not moved at all, the noise will effect a positive pathway length. While we did not measure pathway length during stationary periods, it may still influence the outcome. In future work the contribution of noise can be minimalized by resampling the data or a curve can be fitted to estimate the pathway length.
Participants had complete freedom to orient the phantom as well as the visualisations the way they thought was best suitable. The only limitation was visibility of the tracking array attached to the phantom. Although the majority of the participants did not adjust any of the Brainlab views in between navigation tasks, they liked the fact how easy they could physically move around the hologram, viewing it from different angles. Despite some participants stated they used the 3D reconstruction combined with the 2D representation of the image date, they made the largest error in depth perception based on the 3D visualisation. We did not change the settings for the interpupillary distance on the HoloLens in between tests. However, for clinical use it is recommended to use these individual settings for an improved depth perception and more stable visualisations. Undeterred by the need for a ‘double-hop’ network connection, real-time visualisation and tool tracking has been rated as very good during the tests. During the tests, visualisation rendered at an average of 58 fps.
participants found it counterintuitive that the hologram was not perfectly superimposed onto the phantom. Even after a practise session they occasionally tried to navigate the instrument onto the hologram instead of the phantom. One participant who uses the navigation system on a daily basis stated that he found the Brainlab interface easier to use, mainly because he is used to look at the raw 2D image slices. However, his test results showed he was equally fast and more accurate using the HoloLens.
Positioning holograms currently depends on the spatial perception of the HoloLens. The dynamic surrounding in the OR will cause updates in the spatial perception of the HoloLens, which can change the spatial relation between the holograms and patient. Tracking the HMD with the navigation system and rendering from an attached reference frame will overcome this drift of holograms.
The HoloLens is capable of mapping its surrounding, however the resolution of this spatial mesh is not sufficient to recognize facial morphology or other objects suitable for navigation. Tracking of optical markers with the front RGB camera is another option. Badiali et al. developed a localiser-free see-through display used during orthognathic procedures.13 They used additional markers fixed to the patient for visual tracking. Such fiducial markers need to be used in a sterile field, and large enough for the HoloLens’s 2MP camera to be accurately detected. Tests with different kind of markers showed that the needed size of such markers is impractical for use in the OR. Using an already validated and approved navigation system prevents the need to reinvent the tracking of patient and tools. Moreover, this approach does not interfere with current workflows.
A workflow was developed for per-operative visualisation and interaction with patient specific surgical planning data using the Microsoft HoloLens. Usage of the augmented reality interface is validated by end-users. Gold-standard comparison revealed that the proposed workflow is potentially time-saving and more accurate. The developed interface is tested and validated, first clinical applications are currently performed.
6. Conclusion
7. Future
The final step in truly translating the surgical plan onto the patient includes visualisations superimposed onto the patient. Doing so might further reduce the associated workload of the surgeon, improve hand-eye coordination and steepening of the learning curve associated with surgical navigation. To implement perfectly aligned visualisations the spatial relationship between the cameras of the navigation system and the HMD needs to be known. Tracking the HMD using the navigation system will allow the use of a single coordinate system, as shown in figure 13. Tracking of the HoloLens will counteract drift and unstable holograms. The spatial perception of the HoloLens has become redundant and objects can be rendered using an attached reference frame. Superimposing the surgical plan and navigation data enables more intuitive and user-friendly feedback. The instrument itself does not need to be visualised, and visualisation could be reduced to small directional indicators.
Additional feedback should be implanted to improve depth perception and spatial relation between the instrument and navigated objects. Wegner et al. developed a surgical navigation system using audio feedback. 31 Such feedback mechanism can be used combined with the spatial sound options of the HoloLens, providing an additional aid in depth cue.
Surgeons who are used to work with raw 2D image slices should be able to view this data using the HoloLens. 2D images slices can be produced orthogonal to the viewing angle of the surgeon or navigated instrument. In the current application volume data is converted into surface models for efficient visualisation. The hardware of the HoloLens is currently insufficient for high resolution volume rendering, an example is seen in figure 14. Using our system where rendering is done on a separate computer enables more computing power for volumetric rendering. Future work should include augmentation with volumetric images directly onto patients, not limiting visualisation to the surgical plan and enabling preoperative image-based decision making. Volumetric data contains more information compared to surface models, thus the challenge arises of only providing the needed information at the correct time. Combining multiple headsets will enable multiple users to simultaneously view image data, improving communication between surgeons.
!"
!#
!" ! $
!%
Brainlab Registration
&'
' = patient data coordinates
( = Camera coordinates
% = transform matrix HoloLens
" = transform matrix instrument
[image:25.595.151.463.265.460.2]# = transform matrix navigated anatomy.
8. References
1. Bradley WG. History of Medical Imaging. Proc Am Philos Soc. 2008;152(3):349-361.
2. Schepers RH, Raghoebar GM, Vissink A, et al. Accuracy of fibula reconstruction using patient-specific CAD/CAM reconstruction plates and dental implants: A new modality for functional reconstruction of mandibular defects. J Cranio-Maxillofacial Surg. 2015;43(5):649-657. doi:10.1016/j.jcms.2015.03.015.
3. Luz M, Manzey D, Arbeits- F, Organisationspsychologie I-. Impact of image-guided surgery on surgeons ’ performance : a literature review. 2016;4:229-263.
4. Hemmy DC, David DJ, Herman GT. Three-Dimensional Reconstruction of Craniofacial Deformity Using Computed Tomography. Neurosurgery. 1893;16(5):534-541. doi:10.1227/00006123-198311000-00009.
5. Hansen C, Wieferich J, Ritter F, Peitgen CRH. Illustrative visualization of 3D planning models for augmented reality in liver surgery. 2010:133-141. doi:10.1007/s11548-009-0365-3.
6. Mezger U, Jendrewski C, Bartels M. Navigation in surgery. 2013:501-514. doi:10.1007/s00423-013-1059-4.
7. Blakeney WG, Khan RJ, Wall SJ. Computer-Assisted Techniques Versus Conventional Guides for Component Alignment in Total Knee Arthroplasty. J Bone Jt Surgery-American Vol. 2011;93(15):1377-1384. doi:10.2106/JBJS.I.01321.
8. Lehnen K, Giesinger K, Warschkow R, Porter M, Koch E, Kuster MS. Clinical outcome using a ligament referencing technique in CAS versus conventional technique. Knee Surgery, Sport Traumatol Arthrosc. 2011;19(6):887-892. doi:10.1007/s00167-010-1264-4.
9. Schnurr C, Eysel P, Konig DP. Displays mounted on cutting blocks reduce the learning curve in navigated total knee arthroplasty. Comput Aided Surg. 2011;16(5):249-256. doi:10.3109/10929088.2011.603750.
10. Choi H, Park Y, Lee S, et al. A portable surgical navigation device to display resection planes for bone tumor surgery. Minim Invasive Ther Allied Technol. 2017;0(0):1-10. doi:10.1080/13645706.2016.1274766.
11. Pelargos PE, Nagasawa DT, Lagman C, et al. Utilizing virtual and augmented reality for educational and clinical enhancements in neurosurgery. J Clin Neurosci. 2016;35((in press)):1-4. doi:10.1016/j.jocn.2016.09.002.
12. Nagendran M, Gurusamy K, Aggarwal R, Loizidou M, Davidson B. Virtual reality training for surgical trainees in laparoscopic surgery (Review). Cochrane Database Syst Rev. 2013;(8). doi:10.1002/14651858.CD006575.pub3.www.cochranelibrary.com. 13. Badiali G, Ferrari V, Cutolo F, et al. Augmented reality as an aid in maxillofacial surgery: Validation of a wearable system allowing
maxillary repositioning. J Cranio-Maxillofacial Surg. 2014;42(8):1970-1976. doi:10.1016/j.jcms.2014.09.001.
14. Figi M, Huber K, Hummel J, Hallel R, Homolka P, Watzinger F. Calibration of projection parameters in the Varioscope AR , a head-mounted display for augmented reality visualization in image-guided therapy. 2001;4319:471-480.
15. King AP, Edwards PJ, Maurer Jr. CR, et al. Stereo Augmented Reality in the Surgical Microscope. Presence Teleoperators Virtual Environ. 2000;9(4):360-368.
16. Schnaider M, Schwald B, Seibert H, Weller T. A medical augmented reality system for minimal-invasive interventions. Stud Health Technol Inform. 2003:312-314.
17. Gerig G, Prastawa M, Lin W, Gilmore JH. Assessing Early Brain Development in Neonates by Segmentation of High-Resolution 3T MRI. Medical Image Computing and Computer assisted Interventions. 2003;979-980. doi:10.1007/978-3-540-39903-2.
18. Sterten GD, Chib VS, Tamburo RJ. Tomographic reflection to merge ultrasound images with direct vision. Proc - Appl Imag Pattern Recognit Work. 2000;2000-Janua:200-205. doi:10.1109/AIPRW.2000.953626.
19. Birkfellner W, Figl M, Huber K, et al. A head-mounted operating binocular for augmented reality visualization in medicine - Design and initial evaluation. IEEE Trans Med Imaging. 2002;21(8):991-997. doi:10.1109/TMI.2002.803099.
20. Mischkowski RA, Zinser M, Kübler A, Seifert U, Zöller JE. Clinical and experimental evaluation of an augmented reality system in cranio-maxillofacial surgery. Int Congr Ser. 2005;1281:565-570. doi:10.1016/j.ics.2005.03.277.
21. Khor WS, Baker B, Amin K, Chan A, Patel K, Wong J. Augmented and virtual reality in surgery — the digital surgical environment : applications , limitations and legal pitfalls. 2016;4(23):1-10. doi:10.21037/atm.2016.12.23.
22. Zinser MJ, Mischkowski RA, Dreiseidler T, Thamm OC, Rothamel D, Zöller JE. Computer-assisted orthognathic surgery: Waferless maxillary positioning, versatility, and accuracy of an image-guided visualisation display. Br J Oral Maxillofac Surg. 2013;51(8):827-833. doi:10.1016/j.bjoms.2013.06.014.
23. Levit L, Balogh E, Nass S, Ganz PA. Delivering High-Quality Cancer Care : Charting a New Course for a System in Crisis Challenges of an Aging Population. Board on Health Care Services. 2013.
24. Tokuda J, Fischer GS, Papademetris X, et al. OpenIGTLink: an open network protocol for image-guided therapy environment. Int J Med Robot. 2009;5(4):423-434. doi:10.1002/rcs.274.OpenIGTLink.
25. Microsoft. Holographic Remoting player. https://developer.microsoft.com/en-us/windows/mixed-reality/holographic_remoting_player. Accessed July 19, 2017.
26. Lorensen WE, Cline HE. Marching Cubes: a high resolution 3D surface construction algorithm. Comput Graph (ACM). 1987;21(4):163-169.
27. Möller T, Haines E. Real-time rendering. AK Peters, Ltd. ISBN: 1-56881-101-2; 2002.
28. Blinn JF. Models of light reflection for computer synthesized pictures. In ACM SIGGRAPH Computer Graphics. 1977;11(2):192-198. 29. Heidrich W, Seidel H-P. Realistic, hardware-accelerated shading and lighting. Proc 26th Annu Conf Comput Graph Interact Tech -
SIGGRAPH ’99. 1999:171-178. doi:10.1145/311535.311554.