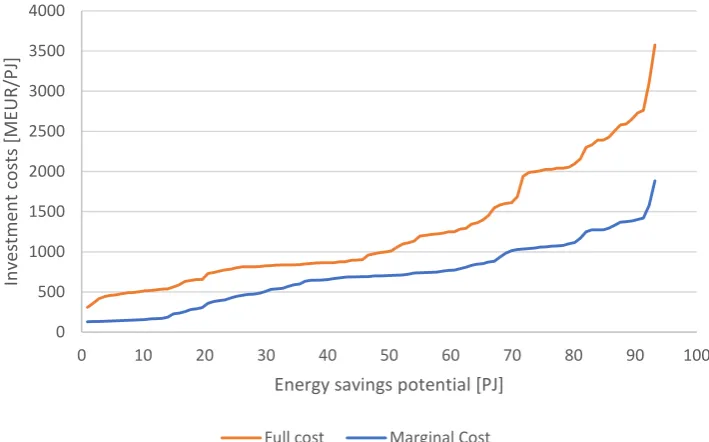
Construction of energy savings cost curves: An application for Denmark
Full text
Figure


Related documents
The joint error of the inductance measurement results (when using bridge methods) depends on the following factors: the accuracy of the standards used as the bridge elements,
This pape r discuss the Spur Gear model made by Agave tequilana ,black fiber, E -glass fiber and carbon fiber with isopolymer composite material and to evaluate
The results also showed that poor cod- ing directly affected morbidity estimates at the practice level implying that high coding quality is a necessary pre- requisite when
In prior research, I noticed a lack of work that explored how trans people created and used multiple accounts and networks on social media in order to explore and present
In Tabelle 4.6 (S. 45) wurden noch einmal einige klinische Charakteristika der MS- Patienten mit den drei häufigsten Mutationen gesondert betrachtet und mitein- ander verglichen. Da
Likewise, if adrenergic blocking agents as adrenolytic drugs are given to rats so, locomotor activity of rats will decrease.In the present study,results
1980 1985 1990 1995 2000 2005 2010 2015 2020 2025
ternational degree students in four higher education institutions in Turku: Åbo Akademi University, the University of Turku, Turku University of Applied Sciences and Novia
