Munich Personal RePEc Archive
Assessing Ghana’s Trade
Competitiveness: A Computation of
Multilateral Real Exchange Rate Index
Akosah, Nana and Mireku, Providence and
Omane-Adjepong, Maurice
Wits Business School, University of the Witwatersrand and Bank of
Ghana, Bank of Ghana
December 2017
1 | P a g e
Assessing
Ghana’
s Trade Competitiveness: A Computation of
Multilateral Real Exchange Rate Index
NANA KWAME AKOSAH*
a& b, PROVIDENCE BOATENG MIREKU
bAND
MAURICE OMANE-ADJEPONG
aa Wits Business School, University of the Witwatersrand, 2 St David's Place, Parktown, Wits
2050, Johannesburg, South Africa
b Research Department, Bank of Ghana, Box 2674, Accra, Ghana
*Corresponding author’s emails: [email protected]; [email protected];
Abstract
We assess Ghana’s trade competitiveness against its major trading partners. In doing so, we compute the real effective exchange rate (REER) index using total trade weighted for the period 2006-2012. The paper further evaluates the volatility of REER and the extent to which variations are ascribed to either the relative price or nominal exchange rate. The findings indicate annual appreciation of the REER in 2001, 2003-2006, 2008, 2010-2011 and 2015-2016. In contrast, real depreciation was recorded for the periods 2002, 2007, 2009 and
2012-2014. These developments in the REER largely mirrored trends in Ghana’s trade balance and
supports the notion that real depreciation (appreciation) improves (worsens) trade balance (trade competitiveness). We further observed a strong positive pass-through of nominal exchange rate to real exchange rate, while the impact from price differentials was relatively small. This finding suggests that despite the perceived moderate pass-through of nominal depreciation to domestic prices, dynamics in the nominal exchange rate remain critical for
Ghana’s trade competitiveness. Consequently, this paper assigns higher priority to nominal exchange rate stability to attain the desired level of real exchange rate alongside moderating volatilities in other macroeconomic variables.
Key Words: Effective Exchange Rate, Price Differentials, Trade Competitiveness, Ghana.
2 | P a g e
1. Introduction
The exchange rate is an important determinant of the economic health of particularly
developing economies. For instance, effective exchange rate serves as a metric of trade
competitiveness for domestic producers in relation to their most significant trading partners.
But to attain an objective and informed view, effective exchange rate has to manifest the
contemporary adjustments in the structure of foreign trade as a result of the globalisation
process. In view of this, exchange rate policies are among the most observed, analysed and
deployed economic measures. However, analysis of the impact of policy variables on the real
exchange rate is sensitive to the type of real exchange rate index chosen. This is because there
are several ways of measuring real exchange rate and the choice of index depends on the
objective of study. Edwards (1989) further argued that the choice of price index is equally
crucial for the computation of real exchange rates. It is therefore necessary to apply the price
index which is more suitable for a particular policy objective.
Over the years, volatility in foreign exchange market has remained topical in academic,
political and policy discourses in Ghana. This is largely hinges on the fact that the Ghanaian
cedi has been among the weakest currencies in the world in recent years. Major recurrent policy
question has been whether the continuous nominal depreciation has correspondingly resulted
in real depreciation? A related question is whether the incessant depreciation really benefits
Ghana’s external trade in the midst of the narrow and predominantly primary export base?
More importantly, whether the perennial depreciation has also considerably enhanced Ghana’s
trade competitiveness?
Like many developing economies, studies on the measurements of real exchange rate for
Ghana had relied extensively on bilateral trade and nominal exchange rate (mostly between the
Ghana and the USA) and in some cases, on the three core countries of the USA, European
Union (EU) and United Kingdom (UK). Notable studies include International Monetary Fund
(IMF) (2000-2016), Opoku-Afari (2004) and Sackey (2001). For instance, in analysis the effect
of foreign aid on REER, Sackey (2001) used bilateral nominal exchange rate in the
measurement of real exchange rate for the period 1962-1996. However, Opoku-Afari (2004)
computed annual multilateral real exchange rate (MRER), also known as real effective
exchange rate (henceforth REER), for Ghana using nine (9) trading partners over the period
1961-2001. As aforesaid, international trade pattern has changed dramatically amid the rapid
pace of globalization as well as gradual transformation of global economies. We emphasised
therefore that the previous studies have aged and hence, do not to encapsulate the recent
3 | P a g e
has altered significantly over the years with China, South Africa, United Arab Emirates and
Nigeria emerging as prominent trade partners.
Against this background, this paper constructs a more contemporary and comprehensive
REER index that captures the recent dynamics of Ghana’s major trading partners, as a gauge
for trade competitiveness. In addition, we investigate the extent to which volatilities in REER
are influenced by either the relative price or nominal exchange rate. We further examine the
evolution of our computed REER and trade balance in the quest to ascertaining the impact of
exchange rate developments on Ghana’s external trade. In terms of contribution, this paper
constructs a more encompassing monthly and CPI-based REER index for Ghana using 18
major trading partners. Consequently, our computed index would reflect the contemporary
developments in Ghana’s external trade and hence, the findings will remit key implications for policy decisions in Ghana and other economies with similar macro-dynamics.
The rest of this paper is organized as follows: Section II presents the proposed measure of
REER index and data. Section III presents the empirical results and reference, while Section
IV provides the conclusion and policy suggestions.
2. Methodology and Data Sources
2.1 Proposed methodology for Ghana’s REER index
The choice of the method and weighting system employed depends on the choice of the home
country’s policy objective. Some of these domestic policy objectives could range from the
impact of exchange rate changes on the balance of payments, international competitiveness,
and to domestic price stability. In this paper, we are primarily concerned with the relative trade
competitiveness of Ghana and price stability objective.
In compiling the REER, we first identified the relevant trading partners1 for Ghana
using bilateral weighting system. The choice of bilateral weighting system was based on the
fact that it incorporates total foreign trade and also draws on information about price responses.
The weights of the relevant trading partners are thus obtained as followed:
𝛹
𝑗=
∑ (𝑋
𝑋
𝑗+ 𝑀
𝑗 𝑗+ 𝑀
𝑗)
𝑛𝑗=1
(1)
where X and M denote export and import respectively of the home country. The inclusion of
imports provides a way of evaluating the potential impact of exchange rate on domestic price
1In this case, a certain balance between sufficient coverage of foreign trade and efficiency has
4 | P a g e
stability objective. In line with Opoku-Afari (2004), we also applied geometric method of
weighting for our computation of REER as it overcomes shortcomings often associated with
arithmetic approach. This contrasts with the work of Sackey (2001) which used the arithmetic
mean method of weighting.
Similarly, the choice of base year is relevant in the REER computation. This paper chose
2006 as the base year (2006=100)2, mainly to capture recent developments such as the rebasing
of the national accounts.
Against this background, this paper computes REER for Ghana using equation 2:
𝑅𝐸𝐸𝑅 = ∏ (
𝑆
𝑁𝐸𝐸𝑅𝑖𝑗𝑃
𝑃
𝑖𝑖𝑗∗
)
𝛹𝑖𝑗(2)
𝑛
𝑖,𝑗=1
where, SNEER denotes the Nominal Effective Exchange Rate (NEER), define as the average
change of a home country’s exchange rate against all the trading currencies at time
𝑖
. Thus, inthis paper, nominal exchange rate is measured as units of foreign currency of country 𝑗 per unit
of domestic currency;
𝑃
𝑖 measures the domestic price level at time 𝑖; 𝑃𝑖𝑗∗ is the price level incountry 𝑗 at time 𝑖; and Ψij is the trade weight assigned to each exchange rate of domestic
currency against foreign currency (j) at time 𝑖. The use of consumer price index is purely based
of easily availability of data.
Although our approach is similar to that of IMF’s annual compilations of REER index
for member countries and that of Opoku-Afari (2004), we provide a high frequency (monthly)
MRER index for Ghana which is germane for timely monetary policy decision. In addition, our
index is more comprehensive as it involves larger number of trading partners.
2.2 Dataset
We apply several estimation techniques to investigate the relative weight of nominal exchange
rate and price differentials on the evolution of real exchange rate. This is to ensure a more
robust estimation outcome. The main techniques applied in this paper included the Exponential
General Auto-Regressive Conditional Heteroskedastic (EGARCH)3 model, Simple and
Markow Regime Switching methods, Threshold OLS regression and OLS with breakpoints.
2
We have used monthly data spanning 2000 to 2016 for our computation, hence the base year index of the REER are averages of the values for the twelve months of that year (Base Year=2006 =100).
5 | P a g e
The choice of different techniques is to ascertain the possible evidence of non-linearity or
threshold effects in the link between real exchange rate and its components.
Dataset for this study was sourced from several areas. For instance, the trade weights were
computed from historical Balance of Payments Database within the Statistics Department of
the Bank of Ghana for the period 2006-2012. Nominal exchange rates in the respective national
currency per US dollar (US$) were obtained from the International Financial Statistics (IFS)
of the International Monetary Fund (IMF). Monthly average of the nominal exchange rates was
used. Similarly, the consumer price indices for the 18-trading partner countries were obtained
from IFS of the IMF. Overall, this study computes a monthly REER index for Ghana over the
period 2000M01 to 2016M12. In contrast, annual datasets were used by Opoku-Afari (2004)
and Sackey (2001).
3. Empirical Results and Inferences
3.1 Ghana’s Major Trading Partners and Their Respective Weights
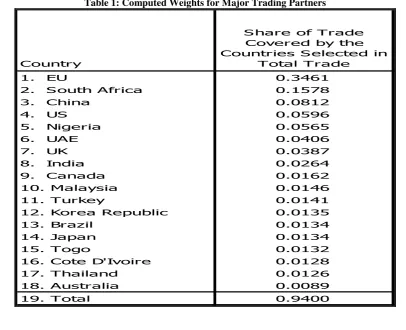
Table 1 displays the relative weights of relevant trading partners for the construction of the
REER index for Ghana. In all, we identified 18 major trading partners, representing 94 per cent
[image:6.595.92.499.448.778.2]of total trade for Ghana over the period 2006-2012.
Table 1: Computed Weights for Major Trading Partners
Country
S hare of Trade Covered by the Countries S elected in
Total Trade
1. EU 0.3461
2. S outh Africa 0.1578
3. China 0.0812
4. US 0.0596
5. Nigeria 0.0565
6. UAE 0.0406
7. UK 0.0387
8. India 0.0264
9. Canada 0.0162
10. Malaysia 0.0146
11. Turkey 0.0141
12. Korea Republic 0.0135
13. Brazil 0.0134
14. Japan 0.0134
15. Togo 0.0132
16. Cote D'Ivoire 0.0128
17. Thailand 0.0126
18. Australia 0.0089
6 | P a g e
The EU which comprised 9 countries4 had the highest trade weight, followed sequentially by
South Africa, China, USA, Nigeria, United Arab Emirates (UAE) and UK, while Australia had
the least trade weight. This suggests that the estimation of REER index based on either the
three core currencies (namely, the US dollar, the pound and the Euro) or the bilateral (only US
dollar) may not be representative enough as it omits the significant roles of some countries
especially China, South Africa and Nigeria in Ghana’s trade dynamics.
3.2 Derived REER Index for Ghana
Having identified the major trading partners and their respective weights, we proceed to
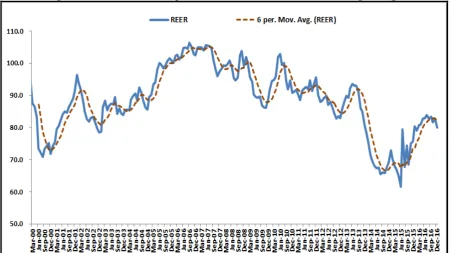
compute the REER index using 2006 as the base year. Figure 2 displays the evolution of our
[image:7.595.73.525.306.559.2]computed REER for Ghana for the period 2000M01 to 2016M12.
Figure 2: Evolution of the Proposed REER Index and its 6-Month Moving Average
It is apparent that the REER has experienced significant volatility over the sample
period. In particular, the index reveals considerable real depreciation below its 6-month moving
averages over the period 2000, 2002, 2009, 2012, 2013Q3-2014Q2 and 2015Q2, suggesting an
undervaluation and hence an improvement in Ghana’s trade competitiveness. It is also evident
that the real depreciations are often followed or preceded by real appreciation, implying that
the currency tends to correct itself towards an equilibrium level.
4
7 | P a g e
We examine the degree of volatilities in the REER by computing annual percentage
changes using equation (2);
∆𝑅𝐸𝐸𝑅𝑡= (𝑅𝐸𝐸𝑅𝑅𝐸𝐸𝑅𝑡−𝑅𝐸𝐸𝑅𝑡−12𝑡−12)∗ 100, (2)
where ∆𝑅𝐸𝐸𝑅𝑡 denotes change in REER index, with positive values connoting appreciation,
while negative values imply depreciation of the cedi. To identify extreme volatility periods, we
further computed a threshold band based on 95% confidence level, as shown in equation (3)
below:
𝑇𝐿𝑟𝑒𝑒𝑟 = 𝜇𝑟𝑒𝑒𝑟 ± 2 ∗ 𝜎𝑟𝑒𝑒𝑟 (3)
where 𝑇𝐿𝑟𝑒𝑒𝑟 denotes a threshold level of REER; 𝜇𝑟𝑒𝑒𝑟 is the mean REER; and 𝜎𝑟𝑒𝑒𝑟 is standard
deviation of the REER. The paper thus associates depreciation below the critical lower bound
as over-depreciation, and also associates an appreciation exceeding the critical upper bound as
over-appreciation. However, equation (3) makes sense only when the distribution of the REER
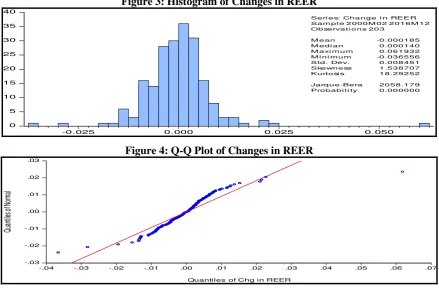
index is approximately normally distributed. Figure 3 clearly demonstrates that the changes in
REER index are non-normally distributed and this is corroborated by the quantile-quantile
(Q-Q) plot in Figure 4. Besides, the boxplot in Figure 5 also clearly shows evidence of positive
[image:8.595.78.518.419.707.2]and negative outliers, epitomising excessive volatilities in the REER index.
Figure 3: Histogram of Changes in REER
0 5 10 15 20 25 30 35 40
-0.025 0.000 0.025 0.050
Seri e s: Chan ge i n REER Sam pl e 2 000M 02 20 16M 12 Observati ons 20 3
M ean -0.000185
M edi an 0.000140
M axi m um 0.061932
M i ni m um -0.036556
Std. Dev. 0.008451
Skewness 1.538707
Kurtosi s 18.29252
Jarque-Bera 2058.179
Probabi l i ty 0.000000
Figure 4: Q-Q Plot of Changes in REER
-.03 -.02 -.01 .00 .01 .02 .03
-.04 -.03 -.02 -.01 .00 .01 .02 .03 .04 .05 .06 .07 Quantiles of Chg in REER
8 | P a g e
Figure 5: Boxplot for Change in REER (Y-o-Y)
-.04 -.03 -.02 -.01 .00 .01 .02 .03 .04 .05 .06 .07
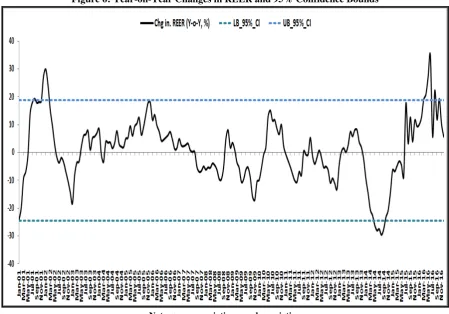
In this paper, therefore, an excessive change in the REER index is defined as any percentage
change in REER lying outside the lower or upper band of the threshold level based on empirical
bootstrap with 100000 replicates over the period January 2001 to December 2016. Figure 6
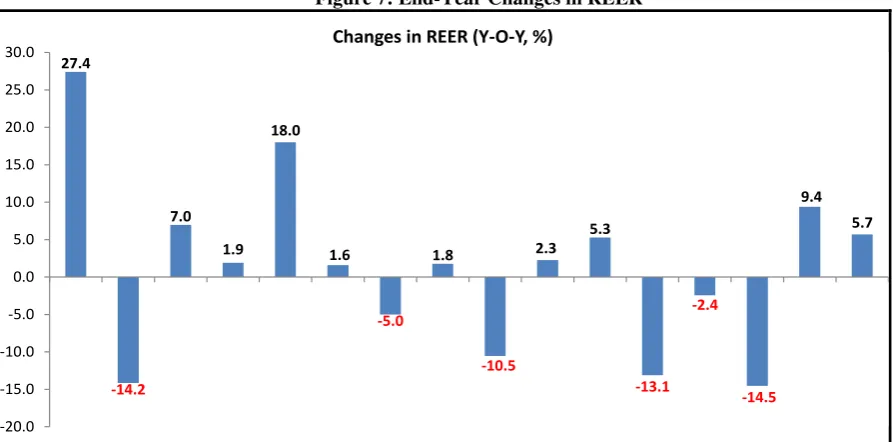
displays the movements of changes in the REER index and critical threshold bands since 2001
(also Figure 7 presents annual changes in REER). Clearly, the result reflects periods of
excessive real depreciation and appreciation of the cedi, consistent with the result from the
Boxplot.
Figure 6: Year-on-Year Changes in REER and 95% Confidence Bounds
[image:9.595.72.522.416.730.2]9 | P a g e
Figure 7: End-Year Changes in REER
Specifically, the event analysis revealed that the REER recorded significant depreciation (25%)
during the early 2001 (over-depreciation), but recovered sharply to record over 27.4%
appreciation by the end of the year, exceeding the critical upper bound. This however triggered
a sharp depreciation of about 14.2% by the end of 2002. Thereafter, the REER index generally
appreciated between the period 2003 and 2006, largely attributable to the inflows related to the
adoption of Heavily Indebted Poor Countries’ (HIPC) initiative accompanied by the
multilateral debt relief.
Real correction ensued during the second half of 2006. This continued throughout 2007
and worsened during the first three quarters of 2008 but subsequently followed by a sharp
recovery in the last quarter of 2008. The general real depreciation in 2007 and 2008 could be
attributable to the excessive fiscal expenditure related to the Golden Jubilee celebration (2007),
hosting of African Cup of nation and election cycle (2008). The recovery was short-lived as
the cedi sharply depreciated in real terms in 2009 amid loss of confidence on the back of
subdued economic growth.
Sharp recovery subsequently followed with the cedi appreciating at the end of 2010 and
2011, on the back of large foreign exchange inflows following the commencement of crude oil
production and exports in 2011.
Large real depreciation ensued between 2012 and 2014 with some respite in 2013, largely
attributable to the lingering macroeconomic vulnerabilities resulting from the fiscal excesses
during the 2012 elections. This reflected in double-digits twin (current and fiscal) deficits in
27.4
-14.2 7.0
1.9 18.0
1.6
-5.0 1.8
-10.5 2.3
5.3
-13.1 -2.4
-14.5 9.4
5.7
-20.0 -15.0 -10.0 -5.0 0.0 5.0 10.0 15.0 20.0 25.0 30.0
2001 2002 2003 2004 2005 2006 2007 2008 2009 2010 2011 2012 2013 2014 2015 2016
10 | P a g e
2012. In particular, the over-depreciation observed during the third quarter of 2014 was
underpinned by poor macroeconomic fundamentals and speculative activities on the foreign
exchange market.
The cedi thereafter strengthened substantially in real terms in 2015 and 2016. This
relative was largely attributable to the tighter fiscal and monetary policies that ensued following
the IMF’s support and conditionality since the last quarter of 2014 as well as the expected large
inflows from cocoa syndicated loans and the floatation of Eurobond in the second half of 2015.
As exhibited in figure 6, the cedi was over-appreciated during the second quarter of 2016 but
thereafter experienced a general downward correction.
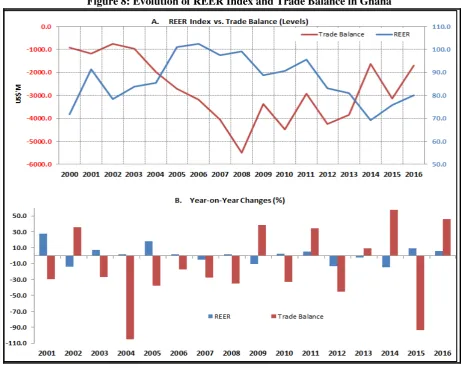
In addition, an examination of Figure 8 clearly demonstrates that the developments in
REER index are somewhat mirrored in the dynamics of Ghana’s trade balance. With the
exception of 2007 and 2011, we observe that periods of real depreciation (appreciation) are
largely associated with improvement (worsening) in the trade balance. The divergence from
this observation especially in 2011 may be attributed to additional export earnings from the
[image:11.595.76.538.388.771.2]commencement of crude oil production during the year.
11 | P a g e
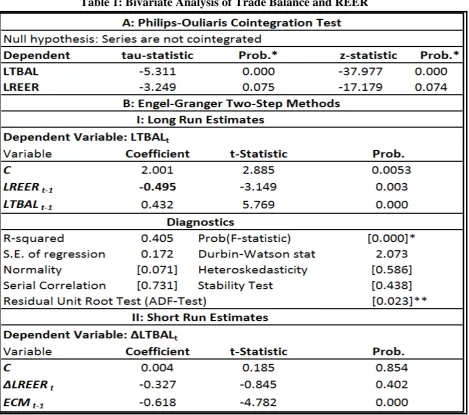
Further empirical analysis based on bivariate Philips-Ouliaris cointegration and Engel-Granger
two-step cointegration methods (in Table 1) shows evidence of a long run relationship between
real exchange rate and Ghana’s trade balance. Particularly, we observe a significant negative
link between real exchange rate and Ghana’s trade balance in the long run, while the short run
link is also negative but statistically insignificant. The result clearly reinforces that real
appreciation (depreciation) tends to deteriorate (augment) Ghana’s trade balance (or
[image:12.595.73.543.222.637.2]competitiveness) in the long run.
Table 1: Bivariate Analysis of Trade Balance and REER
Note: [ ] denotes p-values; * & ** represent 1% and 5% significance levels respectively. Regression covered the period 2000Q1-2016Q4
3.3. Relative Impact of Nominal Exchange Rate and Price Differentials on REER
Real exchange rate is derived as the nominal exchange rate adjusted by the relative prices.
However, the extent of contribution from each component to the variations in REER remains
12 | P a g e
the relative impact of nominal exchange rate and price differentials on REER in the Ghanaian
context, using several approaches. This analysis is deemed essential for policy decision
especially within the inflation targeting framework pursued by the central bank.
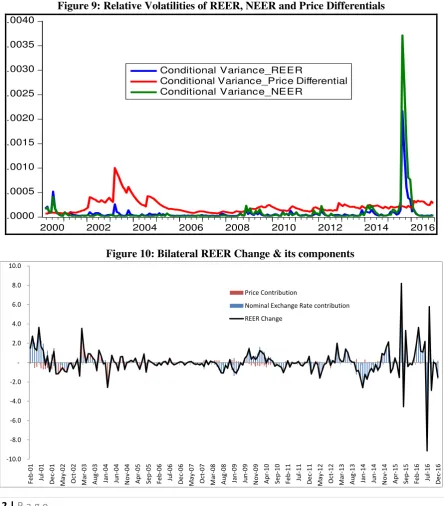
First, we qualitatively scrutinise the evolution of relative conditional volatilities based
on exponential GARCH (1, 1) estimation as displayed in Figure 9. We observed that, since
2008, the volatility in REER has largely been driven by volatility in the nominal effective
exchange rate (NEER). In contrast, relative price contribution to changes in REER seems to be
strongly evident during the pre-2008 period. Besides, the relative contribution to the variations
in our computed REER index is consistent with analysis based on the bilateral REER (see
[image:13.595.76.521.280.787.2]Figure 10).
Figure 9: Relative Volatilities of REER, NEER and Price Differentials
.0000 .0005 .0010 .0015 .0020 .0025 .0030 .0035 .0040
2000 2002 2004 2006 2008 2010 2012 2014 2016
Conditional Variance_REER
Conditional Variance_Price Differential Conditional Variance_NEER
Figure 10: Bilateral REER Change & its components
-10.0 -8.0 -6.0 -4.0 -2.0 2.0 4.0 6.0 8.0 10.0 Fe b -01 Ju l-01 De c-0 1 Ma y -0 2 O ct -02 Ma r-03 Au g-03 Jan -04 Ju n -04 N o v -04 Ap r-05 Se p -05 Fe b -06 Ju l-06 De c-0 6 May -0 7 O ct -07 Ma r-08 Au g-08 Jan -09 Ju n -09 N o v -09 Ap r-10 Se p -10 Fe b -11 Ju l-11 De c-1 1 Ma y -1 2 O ct -12 Mar-13 Au g-13 Jan -14 Ju n -14 N o v -14 Ap r-15 Se p -15 Fe b -16 Ju l-16 De c-1 6 Price Contribution
13 | P a g e
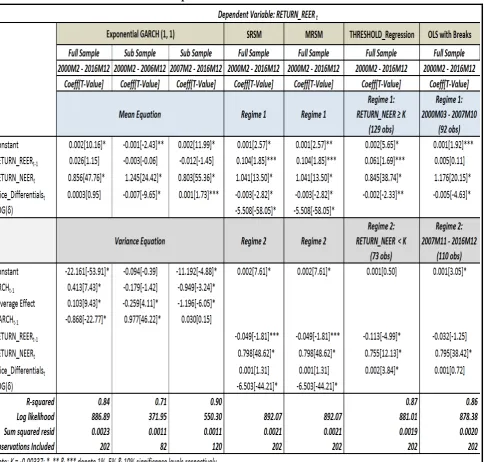
Secondly, we empirically establish the extent to which the evolution of the REER in Ghana
has been propelled by relative adjustments in the nominal exchange rate (NEER) and price
differentials (gaps) using both linear and non-linear estimation techniques. Table 3 presents the
estimation results from Exponential GARCH (1, 1), Simple Regime Switching (SRSM),
Markow Regime Switching (MRSM), Threshold regression and OLS regression with
breakpoint techniques. Our empirical results in Table 3 clearly illustrate that real exchange rate
changes in Ghana are predominantly influenced by changes in the nominal exchange rate.
Consistently, the direction of impact of nominal exchange rate developments on real exchange
rate remains positive and highly significant in all the models. In terms of magnitude, 1%
nominal depreciation (or appreciation) leads to an average real depreciation (or appreciation)
ranging between 0.75% and 0.87%. This suggests a very high pass-through of nominal
exchange rate change to real exchange rate.
In contrast, the results show that the effect of price differentials on real exchange rate
variation is generally minimal irrespective of the estimation techniques applied for the sample
period. In addition, direction of impact of price differential on real exchange rate is less obvious
as it changes sign depending on the regime or period (see Table 1).
For instance, the empirical results (see SRSM, MRSM, Threshold regression and OLS with
breaks estimation in Table 1) suggest that 1% increase (decrease) in price differential leads to
a real depreciation (or appreciation) of about 0.004% in regime 1. On the other hand, we
identified that a 1% increase (decrease) in price differential leads to a real appreciation (or
depreciation) of about 0.001% in regime 2. Our empirical results therefore point to the need to
maintain stability in nominal exchange rate in order to achieve the desired level of real
14 | P a g e
Table 3: Relative Impacts of NEER and Price differentials on REER
4. Conclusion
We assessed Ghana’s trade competitiveness against its major trading partners by computing
multilateral real exchange rate index for the period 2000-2016, based on total trade weights
and CPI index. The paper further appraised the volatility of real exchange rate and analysed
the extent to which the latter is ascribed to variations in either relative price or nominal
exchange rate between Ghana and the trading partners. Our results have significant policy
15 | P a g e
We observed a general annual appreciation of the REER during 2001, 2003-2006, 2008,
2010-2011 and 2015-2016, while real depreciations were recorded for 2002, 2007, 2009 and
2012-2014. It was also noted that developments in REER were largely mirrored by trends in
Ghana’s trade balance; reinforcing the notion that real depreciation (appreciation) generally improves (worsens) trade balance. In addition, the empirical results clearly illustrate that real
exchange rate changes in Ghana are predominantly influenced by changes in the nominal
exchange rate. This finding presupposes that despite the perceived modest pass through of
exchange rate depreciation to domestic prices, the dynamics in nominal exchange rate remains
very critical for Ghana’s trade competitiveness.
Consequently, this paper assigns higher priority to nominal exchange rate stability to
help inure the desired level of real exchange rate while simultaneously moderating volatilities
in other macroeconomic indicators.
Reference
Akosah, N. K. (2014). Volatility and Asymmetry of the USD/GHS Exchange Rate: Monetary
Policy Implications in Ghana. Ghanaian Journal of Economics, Vol. 2,
154-173.
Bollerslev, T., (1986). Generalized Autoregressive Conditional Heteroskedasticity. Journal of Econometrica, Vol. 31, 307-327.
Edwards, S., (1989). Real Exchange Rates, Devaluation, and Adjustment. Cambridge, Mass: MIT Press.
International Monetary Fund (IMF) (2000-2016), Direction of Trade Statistics Yearbook, International Monetary Fund, Washington.
Nelson, D. B., (1991). Conditional Heteroskedasticity in Asset Returns: A New Approach. Econometrica, Vol. 59, 347-370.
Opoku-Afari, M (2004). Measuring the Real Effective Exchange Rate (REER) in Ghana. Centre for Research in Economic Development and International Trade, University of Nottingham Research Paper, No. 04/11.
Sackey, A., (2001). External Aid and Real Exchange Rates in Ghana. AERC, Nairobi, Kenya.
Zakonian, J. M., (1990). Threshold Heteroskedastic Model. Journal of Economic Dynamics