3D Visualization of UMTS/WLAN Integration Using
OPNET Modeler
Sankaranarayanan Radha Ramyah
Anna University, Chennai, India Email: [email protected]
Received May 4, 2012; revised August 13, 2012; accepted September 6,2012
ABSTRACT
The primary design goal for this project is to interwork WLAN with UMTS and visualizing in 3D network, so that it can be utilized as an alternate radio access network for defense system. Simulations and modeling have become a very important part of the process when designing communication networks. Only a real network, with real hardware will provide real results. General Dynamics C4 Systems has been working collaboratively multiple routing protocol interac- tion. 3D Network Visualizer (3DNV) functionality lets you create three-dimensional animations based on topology in- formation, node relationships, performance statistics, and terrain data. The OPNET Modeler is one of the most powerful simulation tools regarding communications. It is especially useful on R&D (research and development) areas for de- velopers of communication devices and protocols. The network model must have a terrain database specified. The nodes to be animated must be mapped to specific shapes (called entities in 3DNV) using a 3DNV mapping library. Fur- thermore, a 3D visualization of the entire network has been developed, representing both real and simulated nodes, in- cluding effects on their communications. The other purpose of this paper is to evaluate different integration solutions and mobility schemes that provide best service and performance by using OPNET as simulation tool.
Keywords: 3DNV; HLA; TIREM
1. Introduction
The simulation model is designed in OPNET™ Modeler 14.5. The simulation parameters were selected to accu- rately model an interworked WLAN-UMTS system sup- porting a “hot spot.”
Animation with 3DNV requires a network model with a terrain database and nodes mapped to 3DNV entities with loop implementation.
A successful network in the loop implementation pro- vides several benefits in the area of testing real networks. Test bed networks may be scaled up to any size. The effects of network performance may then be tested and monitored by varying inputs within the simulated envi- ronment, e.g., weather effects, bandwidth limitations, nodal outages, etc.
Furthermore, a network in the loop implementation provides the opportunity to perform system level verifi- cation and validation of the simulation using the real por- tion of the network. Network in the loop provides the ability to monitor the communication effects graphically on the entire effective network, both real and simulated, via a real-time two and three-dimensional visualization tool from almost any point in the network.
2. Basic Interworking Operation
To facilitate integration of a WLAN network into a UMTS network four levels of coupling are proposed [1-3]. The first level is open coupling where the UMTS and the WLAN networks make use of two separated ac- cess and transport networks while having a common billing. Note that the UMTS and the WLAN networks maintain separate authentication mechanisms.
The second level is loose coupling which enables the use of common authentication mechanisms by providing a link between the authentication, authorization and ac- counting (AAA) server in the WLAN network and the Home Location Register (HLR) in the UMTS network.
The third level is tight coupling where the WLAN AP is connected as an RNC to the UMTS SGSN to support the handover between WLAN and UMTS networks.
The fourth level is very tight coupling where the WLAN AP is connected to the RNC using the same in- terface used by a Node B to connect to an RNC.
this study case, is ACE (Application Characterization Environment) [4]. ACE is a tool for the 3D visualization, analysis and prediction of traffic in network applications. It helps us with the activity analysis of existing, and the development of new applications. This module allows the importing of captured traffic by sniffer and analysis for the following intentions:
Diagnosing application problems; Predicting application behavior.
3. OPNET 3D Network Visualizer
[image:2.595.59.287.390.721.2]OPNET 3D Network Visualizer (3DNV™) provides a powerful solution for understanding and visually analyz- ing mobile networking issues such as terrain masking, propagation loss, interference, and ad hoc routing. 3DNV
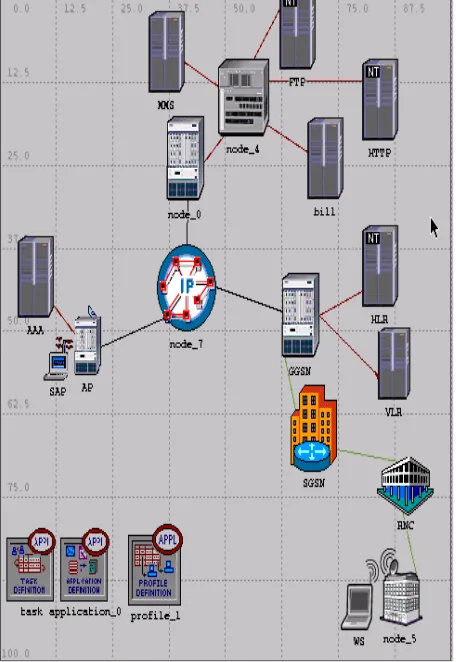
Figure 1. Basic network design.
Aerial or space-based relays; Mobile network performance.
HLA (High-Level Architecture) is a protocol that al- lows two or more programs to exchange data and run in time-step together. The 3DNV network uses the same terrain database in Modeler and the 3D Network Visua- lizer [7].
The network model uses an elevation map of the Mon- terey region. A matching terrain database must be speci-fied. We specified here a terrain database in Open Flight format, which is the preferred type for 3DNV. Before you can view 3D animation of a network model, you must configure the model to work with 3DNV.
There are two basic requirements:
The network model must have a terrain database spe- cified.
The nodes to be animated must be mapped to specific shapes (called entitiesin 3DNV) using a 3DNV map- ping library.
Modeler Wireless Suite for Defense utilizes Digital Terrain Elevation Data (DTED) and Digital Elevation Map (DEM) raw data sources for propagation calculations and rendering of elevation maps.
The Modeler Wireless Suite for Defense also includes the Terrain Integrated Rough Earth Model (TIREM) that computes accurate propagation losses due to terrain ef- fects, such as diffraction and absorption, within wireless network simulations. TIREM is the de facto United States DoD standard algorithm for signal propagation modeling. The Modeler Wireless Suite for Defense supports TIREM v4 (available exclusively through OPNET) along with TIREM v3. TIREM v4 operates significantly faster than v3 with added precision.
OPNET also provides an optional Multi-Federate Logger for 3DNV capability. The Multi-Federate Logger for 3DNV captures and saves information passed bet- ween OPNET Modeler and 3DNV during simulation run- time and is used to review results visually post-simu- lation [8,9]. The addition of 3DNV Mapping is shown in Figure 2.
Figure 2. Object with 3DNV mapping attribute added.
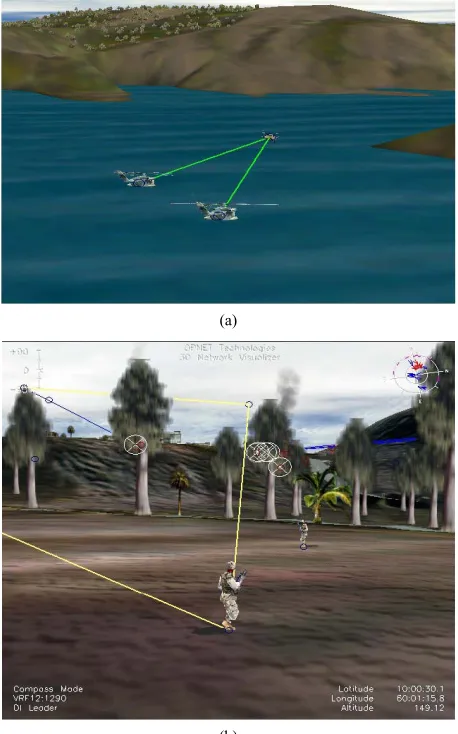
the interactive direction regarding viewpoints of observa- tion 3D scenes similar to video game consoles. The Fig- ure 3 shows 3D Visualization of communications unit on virtual field.
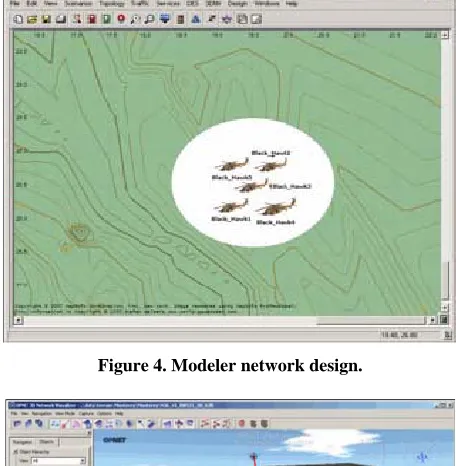
3.1. Viewing 3D Animation in Planning Mode
To obtain network model that is configured for 3D ani- mation, 3DNV is used to examine the Placement of nodes in the surrounding terrain and to visualize move- ment along trajectories. The mode in which you view animations of the GUI workspace is called planning mode. Planning mode shown in Figure 4visualize node placement and movement from the workspace, without running a simulation. Planning mode is also useful for visualizing the trajectories of mobile nodes.
In networks model, we will need to set the time range and step size to useful values. In this network, however, the start and stop times have been preset to match the duration of the mobile node trajectories. The time step needs some adjustment, however.
Set the time controller for a smaller time step, to pro- duce smoother-looking animation. The elevation lines are based on the same ‘Monterey’ terrain database as is cur- rently shown in the OPNET 3D Network Visualizer. The tmm_data_directory preference is set to that same data- base so that the simulation uses matching terrain eleva- tion information.
3.2. Viewing 3D Animation in Simulation Mode
In addition to viewing node movement and terrain in 3DNV, we can visualize simulation results while a simu- lation is running. This is called simulation mode. The simulation is shown in Figure 5.
In simulation mode, we can view the following types of simulation data in 3DNV:
Packet transmission and reception statistics Membership of nodes in specific receiver groups Successful and failed transmissions.
[image:3.595.58.287.86.240.2]Figure 3. 3D Visualization of communications unit on vir-tual field.
Figure 4. Modeler network design.
Figure 5. Visualization showing simulation data.
[image:3.595.308.536.300.533.2] [image:3.595.308.537.454.685.2]cally rendered terrain. Modeler Wireless Suite for De- fense enables analysis and prediction of communications effects in the theater of operations.
Figures 6(a) and (b) show the Wireless Communica- tions (WC) in Navy and Defense respectively using 3D Network.
The suite is used by the world’s largest defense or- ganizations and contractors to accelerate the R&D of net- work protocols, devices, and architectures including MANET protocol development, JTRS/Bowman Radio design, and WIN-T/FCS architecture studies. Defense
(a)
(b)
Figure 6. (a) WC in Navy using 3D Network; (b) WC in De- fense using 3D Network.
Figure 7. Playing module in Terrain map.
network planners and architects can analyze end-to-end behavior, tune network performance, and develop custom protocols to optimally support the war fighter.
5. Simulation Result
This paper presents an interwork of WLAN/UMTS net- work by showing entire network into a 3D visualized. The effects of network performance may then be tested and monitored by varying inputs within the simulated environment, e.g., weather effects, bandwidth limitations, nodal outages, etc. Using the 3D simulation view with MAK Stealth 3DNV, we run with menu selection Edit →
Start → 3DNV Visualize. We load suitable terrain and then we can review any simulation in 3D mode, and thus we can view all the information about statistics [10]. An entire network of 3D visualization is in Figure 7, where we can see one of the units (in this case a helicopter), and the data for node statistics around it. It also enable re- playing of simulations records in 2D by OPNET Modeler or in 3D mode using external MAK Stealth 3DNV pro- gram.
6. Conclusions
[image:4.595.58.287.337.704.2]on a virtual terrain. The virtual terrain is modeled using Digital Terrain Elevation Data (DTED) maps, which can be used in different radio wave propagation models. This paper presents these simulation methodologies supported by examples.
For this Research, the network visualization tool was executed on several of the OPNET simulation machines, although it could have been run on any Windows ma- chine in the simulated or real network. This allows for one or many to observe the 3D visualization representa- tion of the entire effective network (real and simulated) from anywhere in the network.
REFERENCES
[1] A. K. Salkintzis, “Interworking Techniques and Architec- tures for WLAN/3G Integration toward 4G Mobile Data Networks,” IEEE Wireless Communications, Vol. 11, No. 3, 2004, pp. 50-61.
[2] A. Salkintzis, “WLAN/3G Interworking Architectures for Next Generation Hybrid Data Networks,” IEEE Interna- tional Conference on Communications, Vol. 7, 2004, pp.
3984-3988.
[3] M. Abu-Amara, A. Mahmoud and T. Sheltami, “Per- formance of UMTS/WLAN Integration at Hot-Spot Lo- cations Using OPNET,” IEEE Wireless Communication and Networking Conference, Vol. 3, 2008, pp. 1690-1695. [4] OPNET Modeler, OPNET Technologies Inc.
http://www.opnet.com
[5] G. Globačnik, J. Mohorko and Ž. Čučej, “Result Visuali- zation in Tactical Network Simulations,” IEEE Commu- nications Magazine, Vol. 41, No. 11, 2009, pp. 102-108. [6] M. Fras, G. Globačnik and J. Mohorko, “Advanced Me-
thod of Network Simulations with OPNET Modeler,” Zbornik Radova, Novi Sad, 2008.
[7] “OPNET 14.5 PL0 Documentation,” OPNET Technolo- gies, Inc.
[8] E. Biegeleisen, M. Eason and C. Michelson, “Network in the Loop HLA, Distributed OPNET Simulations, and 3D Visualizations,” IEEE Wireless Communications, Vol. 12, No. 3, 2010, pp. 73-80.
[9] OPNET Technologies, Inc., “Network R&D Solutions for Defense Organizations and System Integrators.”