ISSN Online: 2327-5960 ISSN Print: 2327-5952
DOI: 10.4236/jss.2017.59013 Sep. 21, 2017 175 Open Journal of Social Sciences
Evaluation of E-Service Quality through
Customer Satisfaction (a Case Study of FBR
E-Taxation)
Madad Ali, Fahad Asmi
*, Md. Mashiur Rahman, Naveed Malik, Muhammad Salman Ahmad
School of Public Affairs, University of Science and Technology of China, Hefei, China
Abstract
This study developed the research model to analyze the relationship between suggested service quality dimensions with customer satisfaction and customer reuse intention. The sample count of 188 from FBR’s e-taxation/e-filling users was used to examine the study model. In this study, the Exploratory factor analysis EFA used to observe the validity and reliability of the measurement model. The statistical method i.e. regression model has been used to check the research model significance relationship among various variable. Statistical result of current research shows that the service quality dimensions namely responsiveness, reliability and trust has significantly related to customer satis-faction whereas empathy has found insignificant. Practical implication of the current investigations suggests to improve the service quality which can progress customer’s satisfaction as well the intention of use. The findings of this study provide valuable information to administrative authorities of e-government development regarding e-taxation, as well as for future re-searchers and projects in domain of e-services.
Keywords
E-Taxation, Pakistan, Trust, Responsiveness, Empathy, Reliability, Customer Satisfaction, Intention to Use
1. Introduction
The effect of new advancement in the field of technology regarding public man-agement is on the climb. The internet plays a vital role in this new technological era as the governments nowadays globally focuses on innovatively implementing citizens’ services. This phenomenon has given rise and highlighted various
How to cite this paper: Ali, M., Asmi, F., Rahman, Md.M., Malik, N. and Ahmad, M.S. (2017) Evaluation of E-Service Quality through Customer Satisfaction (a Case Study of FBR E-Taxation). Open Journal of Social Sciences, 5, 175-195.
https://doi.org/10.4236/jss.2017.59013
Received: August 16, 2017 Accepted: September 18, 2017 Published: September 21, 2017
Copyright © 2017 by authors and Scientific Research Publishing Inc. This work is licensed under the Creative Commons Attribution International License (CC BY 4.0).
http://creativecommons.org/licenses/by/4.0/
DOI: 10.4236/jss.2017.59013 176 Open Journal of Social Sciences
citizens-related challenges. It includes the citizen’s interaction with available e-government services. With the sudden increase in self-administrated e-services for citizens, the current fashion of research is headed forward to identify the factors accepting the quality of service in the provision of e-government facilities for the end-users which is foremost an important tool for encouraging citizens' acceptance and usage [1][2].
In the recent years e-service quality has received researchers’ considerations and attentions due to its importance [3]. Basically the notion of e-service excel-lence is different and complex from perception of traditional public service ex-cellence. E-service attractiveness can be categorized as the key contributing fac-tors to the accomplishment or success of online web based adoption [4][5]. As stated by Lee and Lin (2005) numerous online institutions wilt because of poor e-service quality management. E-service quality can be differentiated as com-prehensive consumer appraisal and assessments about the excellence of e-service provision in the implicit marketplace are available [6].
Electronic service of public services, particularly the accessibility of various forms and offering services, and the alternative of electronically submitting them, gives an effective way to save time and money for people [7]. Innovations now makes it conceivable to customize a website to a point where conveyance of services could be custom-made to meet the particular needs of an individual, in this manner expanding the fulfillment of consumers from public sector services
[8]. Research has frequently revisited to study e-government driven service qual-ity as how much an e-government website encourages the able conveyance of ef-fective e-services to facilitate users, agencies and businesses in achieving their governmental transactions [9]. However, the nature of e-government driven ser-vices can assume a huge part in enhancing e-government efficiency, and also expanding users’ satisfactions.
Achievement of a service acceptance based on the high quality association with end-users which determines consumer loyalty and satisfaction [10]. Con-sumer loyalty is characterized as “post-utilization assessment of how well a store or item meets or surpasses client desires” [11]. Chang and colleagues (2009) stated that user’s satisfaction is about affecting positive feelings in the users, after consuming a service [12]. Research has indicated frequently that by giving ser-vice by maintaining quality impacts governmental better performance [13]. Moreover, service quality and consumer loyalty were observed to be identified with consumer satisfaction through repurchase and revisit intentions [14]. The current study adopted four service quality dimensions for measuring the e-service quality and their effects on customer’s satisfaction (responsiveness, empathy, re-liability and trust) which recommended by different previous researchers.
DOI: 10.4236/jss.2017.59013 177 Open Journal of Social Sciences
assessment forms/proclamations. In the case of Pakistan, the most of the inno-vation adoption began in mid-2000; its nuts and bolts point was to help public sector institutions in increase pace of service delivery, effectiveness and respon-siveness with the utilization of Information and Communication Technology. It centered Infrastructure advancement of government organizations and accor-dingly facilitating general citizens in utilizing services of various government organizations effectively. Expanding the e-filing system for FBR was additionally a highly preferred and significant projects; when in December 2005 the Central Board of Revenue (CBR), the tax authority formally began permitting e-filing of sales tax assessment and government extract proceeds by recording private and government organizations. Moreover, it is serving with the human resource of approximately 1500 and serving in thousands of citizens to utilize the service fa-cility. Currently with the assistance of e-filling system and different approaches FBR has effectively expanded the assessment and expansion of the tax net to ex-traordinary ranges. Significant Functions are performed by FBR by help of E-filing: Issuance of national tax number (NTN) and sales tax impose numbers, Collection of Sales Tax, Income tax and property tax, Keeping record of citizens and offering it to important gatherings and issuing taxpayers citizens list all the more effortlessly and successfully [15][16].
The purpose of the study is to find the more influencing quality parameters in the current scenario in among “responsiveness”, “empathy”, “reliability” and “trust” to define the satisfaction and how collectively “satisfaction”, “trust” and “responsiveness” affects the decision of e-fillers for taxation in Pakistan to make the “decision regarding the reuse of the e-service”.
2. Literature
2.1. Responsiveness
Responsiveness is defined as the complications faced by the customers while availing or using organizational services and the ability or response of the or-ganization to help or motivate the customers to avoid and solve those complica-tions [17] [18]. Responsiveness in terms of e-service is a convincing manage-ment procedure offered to the users by various means through Internet [7].
Chang and colleagues (2009) describe that awareness measures “the limit of e-retailers to give appropriate data to shoppers when an issue happens, having frameworks for dealing with returns, and giving on the web guarantees” [12]. Kim and colleagues (2006) analyze unmistakable accomplishment factors in an online store and express that buying satisfaction of the clients is one of those components fundamental for Website accomplishment [19]. Lee and Lin (2005) Imply that consumers shopping on the web are foreseeing factor that retailers should respond to their inquiries promptly [20].
DOI: 10.4236/jss.2017.59013 178 Open Journal of Social Sciences
affect consumer satisfaction. A few empirical studies uncovered that there is a considerable relationship between responsiveness measurement and consumer satisfaction [20]. Yang and Fang (2004) observed that there are remarkable four quality scope prompting both fulfillment and discontent, including consistency, ease of use, responsiveness and capability [22].
2.2. Empathy
Empathy concerns with users’ attitudes that the online portal is giving them in-dividualized consideration and it gives them best advantages on a basic level through the coordination of both delivery mechanism and service content [9]. Despite the fact that it is believed that there is no instant human interference in the implicit e-service course, while some human contacts are engaged with e-services. Realizing consumer consideration, it demonstrates empathy to con-sumers. Regarding the characteristics of empathy aspects it can be point out: great individual consideration, satisfactory contacts, and address grievances friendly and reliably respectful [7].
Parasuraman and colleagues (1985) in their study reveals that empathy is the caring for individual consideration and needs that the firm present to its con-sumer [23]. It includes giving consumers particular consideration and counsel-ing who realize the requirements of their consumers and comfort business hours. Ananth and colleagues (2010) has directed understanding in their study on classified service sector which gives individual attention; suitable working hours; and providing personal attention to their customers; overall best conve-nient services and understand customer’s required specific needs [24]. Accord-ing to Ndubis (2006) classified consumer satisfaction can be accomplished by offering customized, adaptable and supple services to suit the requirements of consumers [25].
Enhancing the affirmation involvement with the responsiveness, reliability, empathy, assurance and tangibility the overall traditional customary services re-sults in consumer pleasure [18]. “The study recommends that two SERVQUAL measurements (assurance and empathy) are significant affects the satisfaction”
[26]. The findings of previous researches explored that empathy has significant impact on consumer satisfaction [10][27].
2.3. Reliability
DOI: 10.4236/jss.2017.59013 179 Open Journal of Social Sciences
products and services [30]. According to Parasuraman and Yantis (1998) indi-cated that reliability is a standout amongst the most imperative measurements in SERVQUAL listed variables [31].
While most of the investigation regarding providing quality e-service has rec-ognized that reliability is the most important measurements on e-service quality dimensions. While the recent investigations on e-services quality confirmed that reliability has been utilized as a part of four unique settings in 15 investigative studies on e-service quality, which affirms that reliability is a standout amongst the most significant elements that ought to be underscored in guaranteeing a decent quality. Previous studies also conclude four notable quality measure-ments prompting both fulfillment and disappointment, including reliability, easy to use, competence and responsiveness [22].
There are seven measurements and twenty-six items incorporating reliability which are considered as the projected level for measuring the e-service quality in the domain of e-government. These measurements have been utilized as a part of the scale since they are essential for guaranteeing consumers’ satisfaction [32]. In addition, Zhu and colleagues (2002) contended that reliability measurement has a significant positive impact on apparent service quality and consumer satis-faction by service sector [33]. Recent study has featured the significance of ser-vice reliability, illustrating that transit organizations wishing to build their sumers’ levels of satisfaction should concentrate on building up a reliable con-sistent service [34]. Wolfinbarger and colleagues (2002) discover that various dimensions of their measure of e-service quality sly affect the outcomes. They found that satisfaction and reliability is the most important predictor of con-sumer satisfaction [35].
2.4. Trust
Trust has according to Kissim and his colleagues (2003) indicate that trust is likewise an imperative factor to fabricate and sustain strong relationship be-tween the company and their consumers, yet it is additionally considering as hard to manage [36]. Gefen and his colleagues (2003) Assumed the conceptuali-zation of trust as a combination of particular attitude which consist predictabili-ty, integripredictabili-ty, abilipredictabili-ty, benevolence to be implement in e-business particularly in the web based online shopping setting [37].
DOI: 10.4236/jss.2017.59013 180 Open Journal of Social Sciences
service quality.
2.5. E-Service Satisfaction and Intentions to Use
Consumer initiates with understandable, equipped description from both the users and the organization. Accepting the inspirations, desires and prospect of both parties gives a ground that how to best serve the client and fulfill his/her needs. It will also enable to provide vital information which will help in improv-ing in the nature of the business, and for the client satisfaction and organiza-tional achievements is the considered as the central part of research proposed by Naylor and Greco, the importance of explaining the basic concepts and essen-tials which lead towards satisfaction neatly will give a model information re-garding which function is working and which is not, which is satisfied and which is not up to the mark [39]. In the review of previous studies related to the cur-rent research, the curcur-rent study found that there are a wide range of definitions for terms identified with service quality, specifically for the website service qual-ity and online service qualqual-ity.
E-service quality was presented as another concept by Zeithaml and colleagues (2002), Illustrate the notion of e-service quality, which is considered as “the de-gree to which a site facilitates effective and efficient shopping, delivery and pur-chasing of items and services” [36]. Customer fulfillment is an imperative pre-dictor of online customer behavior and the accomplishment of an electronic ser-vice. If the users are satisfying with the service received through the online sys-tem, it is likely they will continue utilizing the system. With the intentions to re-visit again, if consumers get frustrated and disappointed with the online system, they would be probably not going to return for a visit. Accomplishment is an ef-fective condition that is the emotional reaction to an item or service experience
[37].
Evanschitzky and colleagues (2004) stated that the most observable distinction amongst traditional and electronic retail service is the substitution of hu-man-to-human communication with human-to-machine interaction and accor-dingly. In earlier studies various’ researchers proposed different 16 measure-ments of measuring e-service quality, while Zeithaml (2002) developed eleven measurements [40]. Some of those elements have been contemplated by scien-tists to recognize the e-consumer loyalty or accomplishment of the web based trade.
DOI: 10.4236/jss.2017.59013 181 Open Journal of Social Sciences
in future as re-visit.
SERVQUAL Scale for Measuring Service Quality
[image:7.595.202.538.290.742.2]E-service quality measurement has been addressed by the researchers that had attempted to find out the key dimensions of e-service quality related with online environment. These studies have been conducted in different context, including online services area, online hoteling, online shopping, online health services, on-line learning, onon-line retailing, web portal [32] [45] and online travel agency as shown in Table 1. The service quality also affects the customer relationship management in economic terms [32][45]. The table illustrate, that these service quality dimensions has been used in web based services domain, which have been highly cited in most recent studies. The table adopted from previous stu-dies [32][45].
Table 1. SERVQUAL scale for measuring service quality.
Dimensions Country Sector
Responsiveness, Empathy, Security,
Reliability, Tangible [46] Jordan Online Banking
Responsiveness, Empathy, Assurance,
Reliability, Tangible [47] Georgia, Turkey Internet Service Customers
Empathy, Reliability [48] Pakistan Telecom Sector
Responsiveness, Empathy, Assurance, Reliability, Tangible, Complaint Handling, Convenience,
Network Quality [49] Syria Telecommunication Services
Responsiveness, Assurance,
Reliability, Tangible [50] Bangalore Online hotel Industry
Responsiveness, Empathy, Assurance,
Reliability, Tangible [51] Georgia GSM SERVICE SECTOR
Responsiveness, Empathy, Security,
Reliability, Tangible [46] Jordan Online baking
Responsiveness, Empathy, Assurance,
Reliability, Tangible [26] Turkey Public Healthcare Industry
Responsiveness, Personalization Web Designs,
Ease Of Use, Assurance And Trust. [52] and Qatar Malaysia E-Commerce
Efficiency, Usefulness, Confidentiality, Security,
Ease To Use, Responsiveness. [53] Iran E-service
Web Design, Customer Service, Assurance
And Order Management [37] Spain E-commerce
Trust, Customized Communications, Ease Of Use, Website Content And Functionality,
Reliability And Speed Of Delivery [54] USA E-financial Institutions
Reliability, Website Design, Security/Privacy And
DOI: 10.4236/jss.2017.59013 182 Open Journal of Social Sciences
2.6. Research Questions
• What are the most important e-service quality dimensions in e-taxation and
how these dimensions’ effect customer’s satisfaction in e-taxation in Pakis-tan?
• How the e-service quality dimensions can be conceptualized and described in
the case of e-taxation to measure consumer satisfaction and intentions to re-visit?
2.7. Research Conceptual Framework
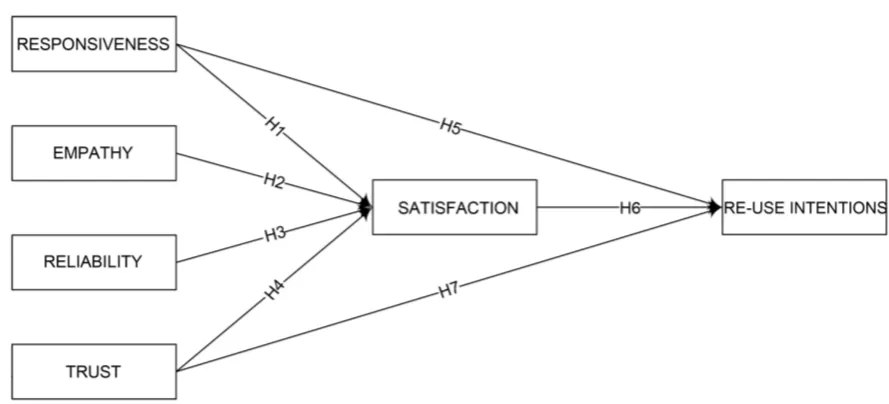
In current study four e-service quality dimensions will be used as independent variables (Responsiveness, Reliability, trust and empathy) to measure customer satisfaction and reuse intentions in e-taxation of FBRin Pakistan. These service quality dimensions are adapted from e-service previous studies responsive adopted from existing pool of studies Parasuraman [56], reliability adopted from Yang [22] and empathy and trust adopted from Madu [57]. The statistical model was employed to measure the significance, influence among independent va-riables (responsiveness, reliability, empathy, trust and satisfaction) as well as to measure the relationship between independent and dependent variables (satis-faction and re-use intentions) as shown in Figure 1.
This research proposes the following seven hypotheses:
Responsiveness:Responsiveness is readiness to enable consumers and give to speedy benefit. Responsiveness is probably going to have an imperative and sig-nificant influence on citizen’s satisfaction [56][58][59]. Thus the following hy-potheses are suggested.
H1: The responsiveness has significant positive influence on customer satis-faction.
[image:8.595.93.538.504.706.2]H5: The responsiveness has significant positive impacts on customer reuse in-tentions.
DOI: 10.4236/jss.2017.59013 183 Open Journal of Social Sciences Empathy: Empathy has defined to “caring, individualized attention the gov-ernment provides for its citizens”. Empathy is likely to have a vital and encour-aging effect on citizens contentment [7][27] [57] [60]. Consequently, the fol-lowing hypotheses are suggested.
H2: The Empathy has significant positive influence over citizen’s satisfaction. Reliability: Reliability is the capacity to execute the guaranteed services in a re-liable, accurate and completely mindful way, without carelessness and disap-pointment [61]. Reliability is probably going to have an imperative and con-structive outcome on citizens satisfaction [22][32][62][63]. Consequently, the following hypotheses are suggested.
H3: There is a positive association between reliability and customer satisfac-tion.
Trust: Trust is detailed set of believes which comprises ability, integrity, and predictability to be connected in online services [64]. Online users usually avoid electronic service providers whom they don’t trust [65]. It means that It implies that trust is accepted as a vital component to building association with citizens online trust which significantly affect positive for long term relationship [52] [66]. The previous researchers indicated that trust is positively related to citizens satisfaction and intentions to use [20][57][67] [68]. Consequently, the follow-ing hypotheses are suggested.
H4: There is strong positive relationship between trust and customer satisfac-tion.
H7: The trust has significantly positive relatedness to customer Intention to use.
Satisfaction: Satisfaction is more than of service provision over customers’ expectations drive by the perceptions and expectations about the given service quality. Customer satisfaction and it is significantly related to intentions to use
[54][56][69]. Therefore, the following hypothesis is suggested.
H6: Customers reuse intention mediated by customer satisfaction toward e-service quality.
3. Methodology
3.1. Research Purpose
DOI: 10.4236/jss.2017.59013 184 Open Journal of Social Sciences
acquired from the friendly environment creates the permanent and ideal cus-tomers and it also shows the expected performance of service providers. If the service is fulfilling the customer expectation it promotes customers satisfactions to higher degree [70].
3.2. Sampling Design and Sampling
The population of this study comprised with the registered citizens with the portal for e-filling in Pakistan. Non-probability sampling i.e. convenient sam-pling design used to collect the data from all participants. The semi-structure questionnaire employed as instrument of data collection because quantitative questionnaire is considered one of most reliable instrument of technology adop-tion as it uses a set of research quesadop-tions to fulfill the data requirements of study as well to target specific numbers of respondents in more efficient and practical way [71][72]. Finally, the sample of this study consist e-taxation users of Pakis-tani citizens and quantitative questionnaire will be distributed among 273 citi-zens purposively selected from twin cities (Islamabad, Rawalpindi) of Pakistan.
In total 273 questionnaires were distributed among the respondents, and 206 were returned. After thoroughly checking 18 questionnaires were found uncom-pleted which eliminated.
3.3. The Instruments of Data Collection
The construct model based on previous studies which is discussed in existed li-terature, five-point likert scale will be used for each construct. All items of con-struct have been used in pervious researches; the adopted items will be modified to relate an e-taxation environment. The construct will be in two parts first part will describe the demographical data as well as the individual characteristics and the second part will be described the study constructs. The source of question-naire items and well detail survey instrument is given below in this study. A pilot study conducted in twin cities (Rawalpindi, Islamabad) of Pakistan. The instru-ments distributed among thirty e-taxation users of FBR. The respondents of the study asked to identify any error or ambiguity in wording or formatting of the questions. Additionally, to increase the reliability and validity of constructs ten questionnaires distributed among research scholars. Moreover, the modification of the instrument items based on respondent’s feedback.
4. Data Analysis
4.1. Results and Analysis
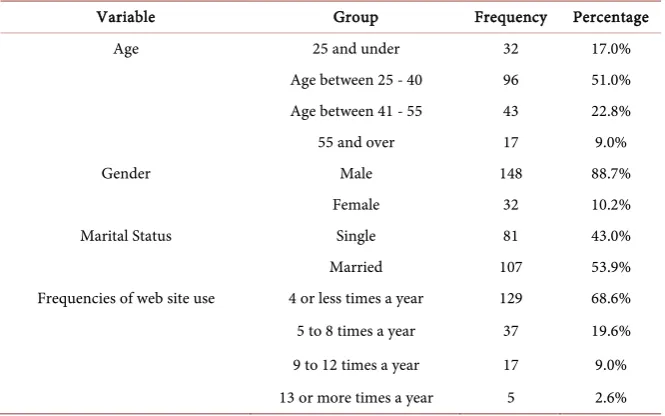
DOI: 10.4236/jss.2017.59013 185 Open Journal of Social Sciences Table 2. Demographical information of the respondents. Its concluded that the.
Variable Group Frequency Percentage
Age 25 and under 32 17.0%
Age between 25 - 40 96 51.0%
Age between 41 - 55 43 22.8%
55 and over 17 9.0%
Gender Male 148 88.7%
Female 32 10.2%
Marital Status Single 81 43.0%
Married 107 53.9%
Frequencies of web site use 4 or less times a year 129 68.6%
5 to 8 times a year 37 19.6%
9 to 12 times a year 17 9.0%
13 or more times a year 5 2.6%
The educational level of the respondents is observed (36.1%) who obtained bachelor’s degree, (21.8%) of the respondents are with postgraduate qualifica-tions (e.g., masters or doctoral degree, whereas (11.1%) of the respondents were holding intermediate degree. Furthermore, the average frequency of (68.6%) of the respondents visiting 4 or less time in a year, or while (19.6%) of them visiting 5 to 8 times in a year. In response of frequency of online taxation, the respon-dent of this study is familiar with electronic taxation payments environment of FBR, (35.6%) of the respondents successfully completed their online filling, while (20.9%) of the respondent’s filling fully failed, (43.4%) filling is partially failed.
It has been summarized that male respondents were recorded high sample size as compare to female respondents. It has been observed that male population is educated but due to equal gender population, so the sample size must be in-crease on equal gender base in future studies. Illiterate population was also not the part of this study which can also be considered in upcoming researches.
4.2. Reliability and Validity Analysis
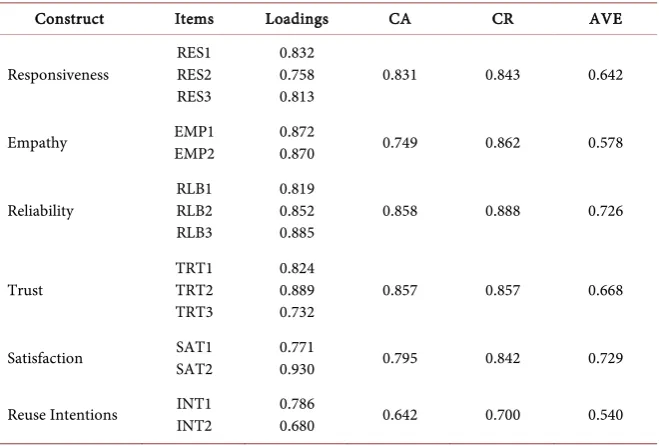
The exploratory factor analysis (EFA) measures the items strength and ability to predict and explain each of the construct studied in the current analysis. In the statistical manner, the tools i.e. SPSS statistic v23 used to perform this task to examine validity of the items and its ability to predict determinants. In EFA the convergent validity is based on three indicators; 1), the construct reliability of each item (factor loading), 2) the reliability of every measure (CA), 3) the aver-age variance extracted (AVE). All items of constructs have convergent validity when the combined reliability increased the standard of 0.7 and value of average variance extracted (AVE) is higher than 0.05 [73].
DOI: 10.4236/jss.2017.59013 186 Open Journal of Social Sciences
[image:12.595.209.539.327.550.2]composite reliability (CR) and the average variance extracted (AVE). All con-structs loadings were higher than 0.7 and t values show that all loadings were found significant at 0.001. All AVEs values are greater than 0.5 (specifically ranged between 0.540 to 0.729) as shown in the table below. Similarly, all CR values (ranged between 0.700 to 0.888) observed higher than 0.7 as shown in
[image:12.595.206.539.581.707.2]Table 3. Consequently the convergent validity of the measures is strongly sup-ported by analysis result [73][74]. Moreover, all Alpha values were found great-er than 0.7, expect one construct othgreat-er showing good reliability [75].
Table 4 below shows the descriptive analysis of study variables which indicate the descriptive outputs for the study variables has been used in this research. The table shows the mean and standard deviation values for the study variables of responsiveness, empathy, reliability, trust, satisfaction and reuse intentions. The mean values of the research variables are ranging from 2.4894 to 4.0160, and the values for standard deviation are in the range of 0.631 to 0.767. Correlation test was conducted to check the strength of relationship between variables. The values
Table 3. Reliability analysis for the collected data.
Construct Items Loadings CA CR AVE
Responsiveness RES1 RES2 RES3
0.832 0.758
0.813 0.831 0.843 0.642
Empathy EMP1 EMP2 0.872 0.870 0.749 0.862 0.578
Reliability RLB1 RLB2 RLB3
0.819 0.852
0.885 0.858 0.888 0.726
Trust TRT1 TRT2
TRT3
0.824 0.889
0.732 0.857 0.857 0.668
Satisfaction SAT1 SAT2 0.771 0.930 0.795 0.842 0.729
Reuse Intentions INT1 INT2 0.786 0.680 0.642 0.700 0.540
Table 4. Descriptive statistics and correlation analysis.
Construct Mean SD RES EMP RLB TRT SAT INT
Responsiveness 2.8936 0.73081 0.801
Empathy 2.8475 0.75078 0.335 0.760
Reliability 2.4894 0.74767 0.183 0.192 0.852
Trust 3.5585 0.73081 0.368 0.117 0.103 0.817
Satisfaction 3.8014 0.57440 0.554 0.285 0.284 0.246 0.853
DOI: 10.4236/jss.2017.59013 187 Open Journal of Social Sciences
of correlation (r) given in the table indicates the supportive results for correla-tion among independent and dependent variables [76].
4.3. Result of Multiple Regression of IVs on DV
From the result of ANOVA it is conceivable to discover whether the given cre-ated model is significant and at what level. The effect of responsiveness, empa-thy, reliability and trust on customer satisfaction was investigated through mul-tiple regression analysis. The regression test was conducted to measure and to predict customer satisfaction (Dependent Variable) based on (predicted vari-ables) responsiveness (IV1), empathy (IV2), reliability (IV3) and trust (IV4). The regression value was found significant (F(4, 183) = 14.535, P < 0.000) with an R2 of 0.341. Participant predicted is equal to 1.676 + 0.042 iv1+ 0.78 iv2 + 0.140 iv3 + 0.401 iv4 (responsiveness, empathy, reliability and trust) [C-Satisfaction DV measured] by satisfaction of users when [independent variables] is measured in [unit of measure].
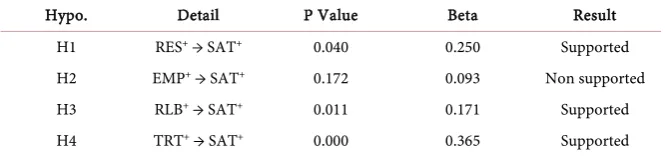
H1; the statistical analysis summarized the relationship between the respon-siveness towards the customer satisfaction was challenged through the collected data sample, the significant relation has proved through coefficient of 0.042 (p < 0.040, n = 188). The result demonstrates that the responsiveness of FBR website have positive relationship with customer satisfaction.
H2; the recorded statistical data disclose the association between empathy to-ward customer satisfaction, which have negative relation with the recorded value of 0.078 as coefficient (p < 0.172, n = 188). This summarized that the empathy of FBR website service has significant negative relation with customers’ satisfaction.
H3; the table reveals that reliability creates positive impacts on customer sa-tisfaction. An increase in reliability will bring a significant increase in customer satisfaction. It is concluded to have significant association with the recorded value of 0.140 as coefficient (p < 0.011, n = 188). This indicates that the reliabili-ty of website has significant relation with customer’s satisfaction.
H4; the result indicates the relationship between trust toward customer’s sa-tisfaction, it is observed to have strong association with the recorded value of 0.401 as coefficient (p < 0.000, n = 188). This summarized that the trust of FBR website service quality has significant positive impacts on customer satisfaction. Overall three hypotheses of the study are proved significant and (IV134) service quality dimension have significant influence on (DV) customer satisfaction. Whereas trust is found highly significant among four DVs, as well empathy found lowest significant as shown in Table 5.
The ANOVA test has been employed to check overall fitness of the model. The whole model is significant, with F test value of 39.873 with df 3.184. F test is used to exemplify overall fitness of model, here F statistics overall significance of independent variables as part of regression model. Here change in customer re-use intentions due to responsiveness, trust, customer satisfaction and trust is R2
DOI: 10.4236/jss.2017.59013 188 Open Journal of Social Sciences Table 5. Regression analysis to define satisfaction (SAT).
Hypo. Detail P Value Beta Result
H1 RES+ → SAT+ 0.040 0.250 Supported
H2 EMP+ → SAT+ 0.172 0.093 Non supported
H3 RLB+ → SAT+ 0.011 0.171 Supported
H4 TRT+ → SAT+ 0.000 0.365 Supported
i.e. responsiveness, trust and customer satisfaction. Results are shown in Table 6. The regression test was conducted to measure the relationship between study variables and to predict customer reuse intentions (Dependent Variable) based on (predicted variables) responsiveness (IV1), Trust (IV2) and customer satis-faction (IV3). The regression value was found significant (F(3, 184) = 39.873, P < 0.000) with an R2 of 0.695. Participant predicted is equal to 0.560 + 0.176 iv1 + 0.226 iv2 + 0.564 iv3 (responsiveness, trust, customer satisfaction) [customer reuse intentions DV measured] by satisfaction of customers when [independent study variables] is measured in [unit of measure].
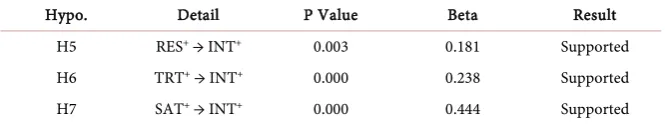
H5; the statistical date concluded the association between responsiveness to-ward customer reuse intentions which recorded positive association through coefficient vales is 0.176 (p < 0.03 n = 188). It’s observed that responsiveness has positive impacts on customer reuse intentions.
H6; was challenging the association between trust towards customer reuse in-tentions. The coefficient values 0.226 (p < 0.000, n = 188) has proved positive relations between study variables. This is indicated that the trust is second in-fluential factor which has positive impacts on customer’s reuse intentions.
H7; the statistical data indicate the influence of customer satisfaction towards customer reuse intentions, the significant positive impacts have observed through coefficient values is 0.564 (p < 0.000, n = 188). It’s observed that customer satis-faction has positive influence over customer reuse intentions. Thus it can be concluded on the base of statistical data that all IVs (responsiveness, trust and customer satisfaction) have positive influence on ID (customer reuse intentions). Whereas satisfaction is found highly significant among three DVs, as well res-ponsiveness found lowest significant.
5. Results and Discussion
The research illustrates inter relationship of service quality dimensions (respon-siveness, trust, reliability and empathy) and its impacts on customer satisfaction as well on customer reuse intentions in e-taxation of federal board of revenue in Pakistan. Therefore, these four service quality dimensions have significant rela-tionship with customer satisfaction on the other hand two dimensions of service quality and customer satisfaction has recorded significant influence on customer reuse intentions.
DOI: 10.4236/jss.2017.59013 189 Open Journal of Social Sciences Table 6. Regression analysis to define reuse intentions (INT).
Hypo. Detail P Value Beta Result
H5 RES+ → INT+ 0.003 0.181 Supported
H6 TRT+ → INT+ 0.000 0.238 Supported
H7 SAT+ → INT+ 0.000 0.444 Supported
authorities of the relevant institutions can use this tool to evaluate the e-taxation service quality in all regions especially in metropolitan cities of Pakistan. Service quality should be focused to improve and maintain customer satisfaction as well as it should have positive impacts on customer reuse intentions.
Among the four dimensions of service quality responsiveness, empathy, reli-ability and trust observed the important predicator of customer satisfaction fur-thermore two dimensions of service quality and customer satisfaction has found significant predicator of customer reuse intensions. This implies that these four dimensions of service quality and customer satisfaction are most important for the users of e-taxation in Pakistan.
The study summarized with the result that customer satisfaction and cus-tomer reuse intentions in e-taxation services of Pakistan has significantly af-fected by responsiveness, empathy, reliability and trust.
The study found that H1 is supported in this study with beta value of 0.250 for responsiveness by past studies i.e. in the Telecommunication Services industry in the context of Syria [49], in a Public Healthcare Industry in the context of Tur-key [26], in an online banking services of Jordan [46][77], in an Internet Service Customers [47], in a GSM service sector of Georgia [51], in an online Hotel In-dustry of Bangalore [50] observed that the higher level of responsiveness appar-ently foster customer satisfaction.
Moreover, reliability and empathy have interesting impact on consumer satis-faction. As H2 observed to be insignificant in the current study with beta values of 0.093. Whereas, H3 supported in this research with beta value of 0.171 for liability against consumer satisfaction. Therefore the empirical results of this re-search are strongly suggested by supporting studies [26] [46]-[51]. The empirical findings of these previous studies have indicated that empathy and reliability play most important role in enhancing customer satisfaction in various online service industries in context of different countries.
Additionally, when compared, independent variables of responsiveness, em-pathy and reliability have a significant positive influence on customer satisfac-tion towards e-taxasatisfac-tion services.
DOI: 10.4236/jss.2017.59013 190 Open Journal of Social Sciences
6. Conclusion
This research elaborated that service quality dimension’s holds strong impacts on customer satisfaction and customer reuse intentions. The current study ob-served that there are positive relations among independent and dependent va-riables of the current study. Despite the fact that consumer service has been as-sessed long time prior, it’s still one of imperative research that e-government services must keep on conducting with a specific end goal to meet the suitable changes in the service quality which can develop tax payers’ satisfaction and prompt e-users reuse intentions. New technologies must be integrated as a factor to assess service quality in upcoming future studies. A clearer understanding with regards to the arrangement of connection between service qualities, con-sumer satisfaction can guarantee better focusing of customer reuse intentions. SERVQUAL scale for measuring service quality to contextualize e-service quali-ty, an examination of the SERVQUAL scale is required since a large portion of the present e-service quality scales are developing in light of the SERVQUAL in-strument.
Limitation and Future Studies
The current study has several limitations and the most important is the sample size. The validity of the result might be less because of small sample size. The respondent of this research were mainly selected from two metropolitan cities (Islamabad and Rawalpindi) whereas future studies are advised to increase the sample size. The study should focus on other cities of Pakistan to enhance the level of validity and generalization. Another limitation of this research is ques-tionnaire language which was in English. Most of the respondents who are not familiar with the English might not thoroughly understand the given items in the survey instrument, which could enhance the confusions in the given ques-tions that might affect reliability of data set. There for future studies are sug-gested to include local languages such as Urdu, Punjabi and Pashto in the survey instrument to be appropriate for the respondents. The last limitation, this study only selected several appropriate service quality dimensions as an independent and dependent variables related to the issue which doesn’t cover all dimensions of e-service quality. Additionally, the future studies are suggested to expand the number of e-service quality dimensions which could lead to improve validity and to predict customer satisfaction as well as reuse intention in various e-services domain.
References
[1] Teicher, J., Hughes, O. and Dow, N. (2002) E-Government: A New Route to Public Sector Quality. Managing Service Quality: An International Journal, 12, 384-393.
https://doi.org/10.1108/09604520210451867
DOI: 10.4236/jss.2017.59013 191 Open Journal of Social Sciences [3] Li, H., Liu, Y. and Suomi, R. (2009) Measurement of E-Service Quality: An
Empiri-cal Study on Online Travel Service. 1-13.
[4] Kim, D.J., Ferrin, D.L. and Rao, H.R. (2009) Trust and Satisfaction, Two Stepping Stones for Successful E-Commerce Relationships: A Longitudinal Exploration. In-formation Systems Research, 20, 237-257.https://doi.org/10.1287/isre.1080.0188 [5] Barnes, S.J. and Vidgen, R.T. (2002) Assessing E-Commerce Quality with WebQual:
An Evaluation of the Usability, Information Quality, and Interaction Quality of In-ternet Bookstores. Journal of Electronic Commerce Research, 3, 114-127.
[6] Collier, J.E. and Bienstock, C.C. (2006) Measuring Service Quality in E-Retailing.
Journal of Service Research, 8, 260-275.https://doi.org/10.1177/1094670505278867 [7] Li, H. and Suomi, R. (2009) A Proposed Scale for Measuring E-Service Quality.
In-ternational Journal of U- and E-Service, Science and Technology, 2, 1-10.
[8] Gilbert, D., Balestrini, P. and Littleboy, D. (2004) Barriers and Benefits in the Adop-tion of E-Government. International Journal of Public Sector Management, 17, 286-301.https://doi.org/10.1108/09513550410539794
[9] Tan, C.W., Benbasat, I. and Cenfetelli, R.T. (2008) Building Citizen Trust towards E-Government Services: Do High Quality Websites Matter? 217.
[10] Kheng, L.L., Mahamad, O., Ramayah,T., et al. (2010) The Impact of Service Quality on Customer Loyalty: A Study of Banks in Penang, Malaysia. International Journal of Marketing Studies, 2, 57-66.https://doi.org/10.5539/ijms.v2n2p57
[11] Hansen, E. and Jonsson, E. (2013) E-Loyalty in Fashion E-Commerce: An Investiga-tion in How to Create E-Loyalty. 64-91.
[12] Chang, H.H., Wang, Y.-H. and Yang, W.-Y. (2009) The Impact of E-Service Quali-ty, Customer Satisfaction and Loyalty on E-Marketing: Moderating Effect of Per-ceived Value. Total Quality Management, 20, 423-443.
https://doi.org/10.1080/14783360902781923
[13] Portela, M.C.A.S. and Thanassoulis, E. (2005) Profitability of a Sample of Portu-guese Bank Branches and Its Decomposition into Technical and Allocative Com-ponents. European Journal of Operational Research, 162, 850-866.
[14] Caruana, A. (2002) Service Loyalty: The Effects of Service Quality and the Mediat-ing Role of Customer Satisfaction. European Journal of Marketing, 36, 811-828.
https://doi.org/10.1108/03090560210430818 [15] Masood, A. (21017) E-Filing of Tax in Pakistan. 1-3.
[16] Connolly, R. and Bannister, F. (2008) eTax Filing & Service Quality: The Case of the Revenue Online Service. Proceedings of World Academy of Science. Engineering and Technology, 28, 313-317.
[17] Kim, M., Kim, J.-H. and Lennon, S.J. (2006) Online Service Attributes Available on Apparel Retail Web Sites: An ES-QUAL Approach. Managing Service Quality: An International Journal, 16, 51-77.https://doi.org/10.1108/09604520610639964 [18] Parasuraman, A., Zeithaml, V.A. and Berry, L.L. (1988) Servqual: A Multiple-Item
Scale for Measuring Consumer Perc. Journal of Retailing, 64, 12.
[19] Fan, W.-S. and Tsai, M.-C. (2010) Factors Driving Website Success—The Key Role of Internet Customisation and the Influence of Website Design Quality and Internet Marketing Strategy. Total Quality Management, 21, 1141-1159.
https://doi.org/10.1080/14783363.2010.529335
DOI: 10.4236/jss.2017.59013 192 Open Journal of Social Sciences [21] Ribbink, D., Van Riel, A.C., Liljander, V., et al. (2004) Comfort Your Online Cus-tomer: Quality, Trust and Loyalty on the Internet. Managing Service Quality: An International Journal, 14, 446-456.https://doi.org/10.1108/09604520410569784 [22] Yang, Z. and Fang, X. (2004) Online Service Quality Dimensions and Their
Rela-tionships with Satisfaction: A Content Analysis of Customer Reviews of Securities Brokerage Services. International Journal of Service Industry Management, 15, 302-326.https://doi.org/10.1108/09564230410540953
[23] Parasuraman, A., Zeithaml, V.A. and Berry, L.L. (1985) A Conceptual Model of Service Quality and Its Implications for Future Research. The Journal of Marketing, 49, 41-50.https://doi.org/10.2307/1251430
[24] Ananth, A., Ramesh, R. and Prabaharan, B. (2010) Service Quality Gap Analysis in Private Sector Bank—A Customer Perspective. Indian Journal of Commerce and Management Studies, 2, 245-252.
[25] Ndubisi, N.O. (2006) A Structural Equation Modelling of the Antecedents of Rela-tionship Quality in the Malaysia Banking Sector. Journal of Financial Services Mar-keting, 11, 131-141.https://doi.org/10.1057/palgrave.fsm.4760033
[26] Kitapci, O., Akdogan, C. and Dortyol, İ.T. (2014) The Impact of Service Quality Dimensions on Patient Satisfaction, Repurchase Intentions and Word-of-Mouth Communication in the Public Healthcare Industry. Procedia-Social and Behavioral Sciences, 148, 161-169.
[27] El Saghier, N. and Nathan, D. (2013) Service Quality Dimensions and Customers’ Satisfactions of Banks in Egypt. 4-5.
[28] Saha, P. and Zhao, Y. (2005) Relationship between Online Service Quality and Cus-tomer Satisfaction: A Study in Internet Banking. Master Thesis, Luleå University of Technology,Sweden.
[29] Weijters, B., Rangarajan, D., Falk,T., et al. (2007) Determinants and Outcomes of Customers’ Use of Self-Service Technology in a Retail Setting. Journal of Service Research, 10, 3-21.https://doi.org/10.1177/1094670507302990
[30] Papadomichelaki, X. and Mentzas, G. (2012) E-GovQual: A Multiple-Item Scale for Assessing E-Government Service Quality. Government Information Quarterly, 29, 98-109.
[31] Parasuraman, R. and Yantis, S. (1998) The Attentive Brain. MIT Press, Cambridge. [32] Alanezi, M.A., Kamil, A. and Basri, S. (2010) A Proposed Instrument Dimensions
for Measuring E-Government Service Quality. International Journal of U- and E-Service, Science and Technology, 3, 1-18.
[33] Zhu, F.X., Wymer, W. and Chen, I. (2002) IT-Based Services and Service Quality in Consumer Banking. International Journal of Service Industry Management, 13, 69-90.https://doi.org/10.1108/09564230210421164
[34] Chakrabarti, S. and Giuliano, G. (2015) Does Service Reliability Determine Transit Patronage? Insights from the Los Angeles Metro Bus System. Transport Policy, 42, 12-20.
[35] Wolfinbarger, M. and Gilly, M.C. (2003) eTailQ: Dimensionalizing, Measuring and Predicting Etail Quality. Journal of Retailing, 79, 183-198.
[36] Zeithaml, V.A., Parasuraman, A. and Malhotra, A. (2002) Service Quality Delivery through Web Sites: A Critical Review of Extant Knowledge. Journal of the Academy of Marketing Science, 30, 362-375.https://doi.org/10.1177/009207002236911 [37] Cristobal, E., Flavián, C. and Guinaliu, M. (2007) Perceived E-Service Quality
DOI: 10.4236/jss.2017.59013 193 Open Journal of Social Sciences https://doi.org/10.1108/09604520710744326
[38] Warkentin, M., Gefen, D., Pavlou,P.A., et al. (2002) Encouraging Citizen Adoption of E-Government by Building Trust. Electronic Markets, 12, 157-162.
https://doi.org/10.1080/101967802320245929
[39] Naylor, M. and Greco, S. (2002) Customer Chemistry: How to Keep the Customers You Want and Say “Good-Bye” to the Ones You Don’t. McGraw Hill Professional, 29-66.
[40] Zeithaml, V.A. (2002) Service Excellence in Electronic Channels. Managing Service Quality: An International Journal, 12, 135-139.
https://doi.org/10.1108/09604520210429187
[41] Szymanski, D.M. and Hise, R.T. (2000) E-Satisfaction: An Initial Examination.
Journal of Retailing, 76, 309-322.
[42] Fakhri, G., Menacere, K. and Pegum, R. (2009) The Impact of Contingent Factors on the Use of Performance Measurement System in the Banking Industry: The Case of Libya. 45.
[43] Bitner, M.J. (1990) Evaluating Service Encounters: The Effects of Physical Sur-roundings and Employee Responses. The Journal of Marketing, 54, 69-82.
https://doi.org/10.2307/1251871
[44] Mohsan, F., Nawaz, M.M., Khan,M.S., et al. (2011) Impact of Customer Satisfaction on Customer Loyalty and Intentions to Switch: Evidence from Banking Sector of Pakistan. International Journal of Business and Social Science, 2, 16.
[45] Swaid, S.I. and Wigand, R.T. (2009) Measuring the Quality of E-Service: Scale De-velopment and Initial Validation. Journal of Electronic Commerce Research, 10, 13. [46] Al-Azzam, A.F.M. (2015) The Impact of Service Quality Dimensions on Customer
Satisfaction: A Field Study of Arab Bank in Irbid City Jordan. European Journal of Business and Management, 7, 45-54.
[47] Aydinli, C. and Kiliç, Ş. (2015) Impact of Service Quality Dimensions on Satisfac-tion and Loyalty: A Cross-NaSatisfac-tional Research on Internet Service Customers. Jour-nal of Social Sciences Research, 9, 1920-1928.
[48] Arslan, M., Iftikhar, M. and Zaman, R. (2014) Effect of Service Quality Dimensions on Customer Satisfaction: A Comparative Analysis of Pakistan Telecom Sector. Re-vista de Management Comparat International, 15, 440.
https://doi.org/10.2139/ssrn.2515046
[49] Rahhal, W. (2015) The Effects of Service Quality Dimensions on Customer Satisfac-tion: An Empirical Investigation in Syrian Mobile Telecommunication Services. In-ternational Journal of Business and Management Invention, 4, 81-89.
[50] Rao, P.S. and Sahu, P.C. (2013) Impact of Service Quality on Customer Satisfaction in Hotel Industry. IOSR Journal of Humanities and Social Science, 18, 39-44.
https://doi.org/10.9790/0837-1853944
[51] Demir, A., Eray, O. and Erguvan, M.M. (2015) How Non-Technical Dimensions of Service Quality Effects Satisfaction and Loyalty of Costomers at GSM Service Sector in Georgia? International Journal of Engineering Technology and Scientific Innova-tion, 1, 150-162.
DOI: 10.4236/jss.2017.59013 194 Open Journal of Social Sciences [53] Bagheri, S.S. (2016) Evaluation of E-Services from the Viewpoint of Insurance
Clients in Iran Using Ahp and Extended Topsis Based on Possibility Theory (Case Study: Iran, Asia, Sina, Mihan, Dana and Razi Insurance Agencies). International Business Management, 10, 5695-5704.
[54] Sohn, C. and Tadisina, S.K. (2008) Development of E-Service Quality Measure for Internet-Based Financial Institutions. Total Quality Management, 19, 903-918.
https://doi.org/10.1080/14783360802224412
[55] Kim, J., Jin, B. and Swinney, J.L. (2009) The Role of Etail Quality, E-Satisfaction and E-Trust in Online Loyalty Development Process. Journal of Retailing and Consumer Services, 16, 239-247.
[56] Parasuraman, A., Zeithaml, V.A. and Malhotra, A. (2005) ES-QUAL a Mul-tiple-Item Scale for Assessing Electronic Service Quality. Journal of Service Re-search, 7, 213-233.https://doi.org/10.1177/1094670504271156
[57] Madu, C.N. and Madu, A.A. (2002) Dimensions of E-Quality. International Journal of Quality & Reliability Management, 19, 246-258.
https://doi.org/10.1108/02656710210415668
[58] Sigala, M., Christou, E., Glaveli, N., et al. (2006) Bank Service Quality: Evidence from Five Balkan Countries. Managing Service Quality: An International Journal, 16, 380-394.https://doi.org/10.1108/09604520610675711
[59] Joseph, M., Sekhon, Y., Stone,G., et al. (2005) An Exploratory Study on the Use of Banking Technology in the UK: A Ranking of Importance of Selected Technology on Consumer Perception of Service Delivery Performance. International Journal of Bank Marketing, 23, 397-413.https://doi.org/10.1108/02652320510612474
[60] Loke, S.-P., Taiwo, A.A., Salim,H.M., et al. (2011) Service Quality and Customer Satisfaction in a Telecommunication Service Provider. International Proceedings of Economics Development & Research, 11, 24-29.
[61] An, M. and Noh, Y. (2009) Airline Customer Satisfaction and Loyalty: Impact of In-Flight Service Quality. Service Business, 3, 293-307.
https://doi.org/10.1007/s11628-009-0068-4
[62] Hussain, R., Al Nasser, A. and Hussain, Y.K. (2015) Service Quality and Customer Satisfaction of a UAE-Based Airline: An Empirical Investigation. Journal of Air Transport Management, 42, 167-175.
[63] Shi, Y., Prentice, C. and He, W. (2014) Linking Service Quality, Customer Satisfac-tion and Loyalty in Casinos, Does Membership Matter? International Journal of Hospitality Management, 40, 81-91.
[64] Gefen, D., Karahanna, E. and Straub, D.W. (2003) Trust and TAM in Online Shop-ping: An Integrated Model. MIS Quarterly, 27, 51-90.
[65] Reichheld, F.F. and Schefter, P. (2000) E-Loyalty: Your Secret Weapon on the Web.
Harvard Business Review, 78, 105-113.
[66] Corbitt, B.J., Thanasankit, T. and Yi, H. (2003) Trust and E-Commerce: A Study of Consumer Perceptions. Electronic Commerce Research and Applications, 2, 203-215.
[67] Al-Faouri, A.H. and Al-Kasasbeh, M.M. (2011) The Influence of Aviation Compa-nies’ Perceived Websites Quality on E-Trust: An Exploratory Study. International Journal of Aviation Technology, Engineering and Management, 1, 14-29.
https://doi.org/10.4018/ijatem.2011010102
DOI: 10.4236/jss.2017.59013 195 Open Journal of Social Sciences [69] Su, L., Swanson, S.R. and Chen, X. (2015) Social Responsibility and Reputation In-fluences on the Intentions of Chinese Huitang Village Tourists: Mediating Effects of Satisfaction with Lodging Providers. International Journal of Contemporary Hospi-tality Management, 27, 1750-1771.https://doi.org/10.1108/IJCHM-06-2014-0305 [70] Adamska, M. and Minárová, M. (2014) Role of Learning Organization in Building
Consumer Confidence. E + M Ekonomie a Management, 1, 62.
https://doi.org/10.15240/tul/001/2014-1-005
[71] Venkatesh, V., Morris, M.G., Davis,G.B., et al. (2003) User Acceptance of Informa-tion Technology: Toward a Unified View. MIS Quarterly, 27, 425-478.
[72] Reddick, C.G. (2005) Citizen Interaction with E-Government: From the Streets to Servers? Government Information Quarterly, 22, 38-57.
[73] Hair, J., Black, W.C., Babin, B.J., Anderson, R.E. and Tatham, R.L. (2006) Multiva-riate Data Analysis. 7th Edition.
[74] Gefen, D., Straub, D. and Boudreau, M.-C. (2000) Structural Equation Modeling and Regression: Guidelines for Research Practice. Communications of the Associa-tion for InformaAssocia-tion Systems, 4, 7.
[75] Nunnally, J. and Bernstein, I.H. (1994) Psychometric Theory. 3rd Edition, McGraw-Hill, New York.
[76] MacLane, S. (2012) Homology. Springer Science & Business Media, 31-37.
[77] Okeke, T., Ezeh, G. and Ugochukwu, N. (2015) Service Quality Dimensions and Customer Satisfaction with Online Services of Nigerian Banks. The Journal of In-ternet Banking and Commerce, 20, 3.
Submit or recommend next manuscript to SCIRP and we will provide best service for you:
Accepting pre-submission inquiries through Email, Facebook, LinkedIn, Twitter, etc. A wide selection of journals (inclusive of 9 subjects, more than 200 journals)
Providing 24-hour high-quality service User-friendly online submission system Fair and swift peer-review system
Efficient typesetting and proofreading procedure
Display of the result of downloads and visits, as well as the number of cited articles Maximum dissemination of your research work
Submit your manuscript at: http://papersubmission.scirp.org/