Hepatocyte nuclear factor 1
aa
suppresses
steatosis-associated liver cancer by inhibiting
PPAR
gg
transcription
Cecilia Patitucci, … , Mario Pende, Ganna Panasyuk
J Clin Invest.
2017;
127(5)
:1873-1888.
https://doi.org/10.1172/JCI90327
.
Worldwide epidemics of metabolic diseases, including liver steatosis, are associated with
an increased frequency of malignancies, showing the highest positive correlation for liver
cancer. The heterogeneity of liver cancer represents a clinical challenge. In liver, the
transcription factor PPAR
g
promotes metabolic adaptations of lipogenesis and aerobic
glycolysis under the control of Akt2 activity, but the role of PPAR
g
in liver tumorigenesis is
unknown. Here we have combined preclinical mouse models of liver cancer and genetic
studies of a human liver biopsy atlas with the aim of identifying putative therapeutic targets
in the context of liver steatosis and cancer. We have revealed a protumoral interaction of
Akt2 signaling with hepatocyte nuclear factor 1
a
(HNF1
a
) and PPAR
g
, transcription factors
that are master regulators of hepatocyte and adipocyte differentiation, respectively. Akt2
phosphorylates and inhibits HNF1
a
, thus relieving the suppression of hepatic PPAR
g
expression and promoting tumorigenesis. Finally, we observed that pharmacological
inhibition of PPAR
g
is therapeutically effective in a preclinical murine model of
steatosis-associated liver cancer. Taken together, our studies in humans and mice reveal that Akt2
controls hepatic tumorigenesis through crosstalk between HNF1
a
and PPAR
g
.
Research Article
Hepatology
Oncology
Find the latest version:
Introduction
Hepatocellular carcinoma is the third leading cancer-related cause of death worldwide. This is partly due to late diagnosis and the fact that no efficient treatment is available. Recently, in the framework of the International Genome Consortium and The Cancer Genome Atlas, the largest genome profiling of liver can-cers was conducted (1–4). Large-scale analyses, including exome sequencing, transcriptome, copy-number, and methylome anal-yses, uncovered a broad landscape of genetic alterations and highlighted the extraordinary diversity of benign and malignant liver lesions. Multiple molecular pathways were found dysregu-lated in hepatic lesions, including p53 and cell cycle regulators, WNT/β-catenin pathway, chromatin modifiers, and oxidative stress and growth factor signaling pathways. The latter group was found activated in the majority of malignant liver lesions due to mutations in RAS gene members; PIK3CA, PTEN, RPS6KB1, and RPS6KA3 genes; and growth factor tyrosine kinase receptors and ligands (MET, FGF19, VEGF, and IGF); and its activation was pos-itively correlated with the severity of the disease (5, 6). In partic-ular, the insulin signaling pathway has a major role in the meta-bolic adaptations to nutrition, including increased hepatic lipid accumulation (steatosis). Interestingly, overnutrition and obesity are also risk factors for liver tumorigenesis, in part by promoting an inflammatory environment favorable for cancer growth (7, 8).
However, it is unclear whether and how genetic insults leading to steatosis provide hepatocytes with a cell-autonomous growth advantage in malignant transformation.
The transcription factor and lipid sensor peroxisome proliferator– activated receptor-γ (PPARγ, encoded by Pparg in mice) has received a lot of attention in the liver steatosis response, though its role in liv-er tumorigenesis remains to be clarified. PPARγ is known as a mas-ter regulator of adipocyte differentiation, consistent with its highest levels of expression and activity in adipose tissue, where it orches-trates lipid uptake, synthesis, and storage (9). However, in ob/ob and db/db mouse models of obesity, liver Pparg mRNA levels are substan-tially increased (10, 11). In addition, PPARγ expression is also induced by genetic insults, e.g., by the deletion of the PIP3-lipid phosphatase and tumor suppressor phosphatase and tensin homolog (Pten) gene in liver (12, 13). The involvement of PPARγ in the steatosis response in liver is implied as mice with hepatic deletion of Pparg are protect-ed from high-fat diet–inducprotect-ed steatosis and show improvements in glucose tolerance (14). Yet, the accumulated data on the implica-tion of PPARγ in tumorigenesis are not conclusive and are in some instances contradictory.
Depending on the cancer type, both tumor-suppressive and tumor-promoting functions for PPARγ were reported. While a tumor-suppressive role is described in colon, breast, and pros-tate cancers, PPARγ activation promotes polyp formation in colon cells carrying mutations in the APC gene (15–17). In liver, loss-of-function mutations of negative regulators of PPARγ, such as his-tone deacetylase 3 (HDAC3) and nuclear hormone corepressor (N-CoR), promote steatosis and pathological liver growth culmi-nating in cancer in mice and humans (18, 19). Conversely, loss of 1
Worldwide epidemics of metabolic diseases, including liver steatosis, are associated with an increased frequency of malignancies, showing the highest positive correlation for liver cancer. The heterogeneity of liver cancer represents a clinical challenge. In liver, the transcription factor PPARγ promotes metabolic adaptations of lipogenesis and aerobic glycolysis under the control of Akt2 activity, but the role of PPARγ in liver tumorigenesis is unknown. Here we have combined
preclinical mouse models of liver cancer and genetic studies of a human liver biopsy atlas with the aim of identifying putative therapeutic targets in the context of liver steatosis and cancer. We have revealed a protumoral interaction of Akt2 signaling with hepatocyte nuclear factor 1α (HNF1α) and PPARγ, transcription factors that are master regulators of hepatocyte and adipocyte differentiation, respectively. Akt2 phosphorylates and inhibits HNF1α, thus relieving the suppression of hepatic PPARγ expression and promoting tumorigenesis. Finally, we observed that pharmacological inhibition of PPARγ is therapeutically effective in a preclinical murine model of steatosis-associated liver cancer. Taken together, our studies in humans and mice reveal that Akt2 controls hepatic tumorigenesis through crosstalk between HNF1α and PPARγ.
Hepatocyte nuclear factor 1
α
suppresses
steatosis-associated liver cancer by inhibiting PPAR
γ
transcription
Cecilia Patitucci,1,2,3 Gabrielle Couchy,4 Alessia Bagattin,3,5 Tatiana Cañeque,6,7,8 Aurélien de Reyniès,9 Jean-Yves Scoazec,10Raphaël Rodriguez,6,7,8 Marco Pontoglio,3,5 Jessica Zucman-Rossi,3,4,11,12,13 Mario Pende,1,2,3 and Ganna Panasyuk1,2,3
1Institut Necker-Enfants Malades, 2INSERM U1151/CNRS Unité Mixte de Recherche (UMR) 8253, Paris, France. 3Université Paris Descartes, Sorbonne Paris Cité, Paris, France. 4INSERM, UMR 1162, Functional
Genomics of Solid Tumors, Equipe Labellisée Ligue Contre le Cancer, Paris, France. 5INSERM U1016/CNRS UMR 8104, Institut Cochin, Paris, France. 6Institut Curie, PSL Research University, Organic Synthesis and
Cell Biology Group, Paris, France. 7CNRS UMR 3666, Paris, France. 8INSERM U1143, Paris, France. 9Ligue Nationale Contre le Cancer, Paris, France. 10INSERM, UMR 865, Faculté Laennec, Lyon, France. 11Hopital
Europeen Georges Pompidou, Paris, France. 12University of Paris Diderot, Sorbonne Paris Cité, University Institute of Hematology, Paris, France. 13University of Paris, Sorbonne Paris Cité, Saint-Denis, France.
Conflict of interest: The authors have declared that no conflict of interest exists.
Submitted: August 25, 2016; Accepted: February 16, 2017.
The Journal of Clinical Investigation
R E S E A R C H A R T I C L Ewith this article; https://doi.org/10.1172/JCI90327DS1). From this analysis, 33% of hHCC samples in both sets showed high PPARG mRNA expression levels that are at least 4 SD above the mean expression in nontumoral liver tissue samples.
To gain further mechanistic insights into the observed increase in PPARG expression, we analyzed its relative transcript levels according to the G1–G6 transcriptional signatures that were previously determined in HCCs (23). We revealed that PPARG expression was maximal in the G3 group of hHCCs, followed by the G1 and G2 groups, while the G4 group did not differ from con-trol (Supplemental Figure 1B). These results were encouraging since the G1–G3 subgroups of hHCCs, unlike G4–G6, are char-acterized by activated PI3K/Akt signaling (23). In addition, high PPARG mRNA expression in the liver cancer atlas collection was associated with worse survival in 237 HCC patients treated by curative surgical resection (Figure 1B). Next, we performed immu-noblot analysis using anti-PPARγ antibody, to address whether the increased transcript level of PPARG is reflected in increased protein levels. Biopsy samples were selected based on the results of PPARG transcript analyses as the representative average val-ues of the respective group. We observed that PPARγ protein was expressed in tumoral lesions and its levels were significantly higher in the hHCC biopsies of the G3 (HIGH) group as compared with the samples from other subgroups of hHCCs (Figure 1C). In murine and human cells, expression of multiple PPARγ isoforms was reported, with PPARγ1 and PPARγ2 being the best character-ized (24). Interestingly, both PPARγ1 and PPARγ2 isoforms were upregulated, although PPARγ1 to a larger extent, in the G3 (HIGH) subgroup of hHCCs compared with other hHCCs.
Next, we asked whether increased PPARγ protein expression correlated with changes in Akt signaling in hHCCs, using a distinct biopsy collection. We found that, as expected, Akt is activated in the majority of lesions, as witnessed by the increased phosphor-ylation of Akt-Ser473 and its downstream target the proline-rich Akt substrate of 40 kDa (Pras40) (Figure 1D). Importantly, we revealed a positive correlation of total PPARγ protein levels and an activation of Akt signaling in hHCCs (Figure 1D).
In sum, these observations in hHCCs show that PPARγ is upregulated in a portion of liver tumors at both the transcript and the protein level and its induction positively correlates with increased Akt signaling.
Hepatic deletion of Pparg rescues Akt2-driven liver tumorigenesis. To address in vivo the functional importance of PPARγ expres-sion in liver tumorigenesis, we used a mouse model of liver can-cer induced by hepatocyte-specific inactivation of the Pten gene, which we combined with Akt2 or Pparg deletions. To this end, we crossed Pten, Akt2, or Pparg floxed mouse lines with a transgenic line overexpressing Cre under the albumin enhancer/promoter (Alb-Cre), which achieves efficient deletion of targeted genes at the early postnatal stage in both hepatocytes and biliary cells (25). Characterization of double mutants revealed that deletion of Akt2 in Pten-null hepatocytes (Pten/Akt2 double mutants) was sufficient to rescue liver hypertrophy, liver damage as assessed by the activ-ity of hepatic enzymes aspartate transaminase and alanine trans-aminase in plasma, and tumor burden in 1-year-old mice (Figure 2, A and B, and Supplemental Figure 2, A and B). This analysis confirmed previous studies using the whole-body deletion of Akt2 allele of Pparg sensitized mice to chemically induced liver
tumori-genesis (20). Similarly, in the STAM mouse model of liver cancer, combining diabetes and high-fat diet, pharmacological activation of PPARγ significantly ameliorated liver damage and reduced tumor numbers without affecting tumor size or hepatocyte prolif-eration in nontumoral liver tissue (21). One possible explanation for these contradictory findings is the distinction between steato-sis induced by genetic insults and that induced by environmental factors. Interestingly, a subclass of hepatocellular adenoma in humans is associated with loss-of-function mutations in the tran-scription factor hepatocyte nuclear factor 1α (HNF1α) and is signi-fied by important steatosis of unconfirmed origin independent of nutritional status (22). The requirement for PPARγ depending on the liver cancer genotype and the relevance for human malignan-cies remain an open question.
In this work, we screened a large annotated collection of human liver cancers for PPARγ expression. We find that the expression and activity of PPARγ are significantly increased in benign lesions characterized by loss of function of HNF1A and a subset of malignant hepatic lesions characterized by activated Akt signaling. In functional studies in mice, we provide a link between genetic loss of Hnf1a and Pparg transcription, revealing HNF1α as a novel transcriptional repressor of PPARG under con-trol of Akt2. Finally, preclinical studies in a Pten-deficient mouse liver cancer model demonstrate that PPARγ inhibition by genetic or pharmacological tools has potent antitumoral action. In sum, our findings show a novel functional interaction between 2 tran-scriptional master regulators of hepatocyte and adipocyte cell fate, HNF1α and PPARγ, in the integration of metabolism and hepatocyte transformation.
Results
mutant mice (Figure 2A and Supplemental Figure 2C). These obser-vations suggest that PPARγ is not a unique player in liver tumori-genesis downstream of activated Akt2 signaling. Nevertheless, the predominant role of PPARγ was indicated by the significantly lower incidence of lesions upon deletion of Pparg in Pten mutants (Sup-plemental Figure 2C). We have also confirmed that lesions found in Pten/Pparg double mutants originated from Pparg-null hepatocytes as evidenced by the recombination in the Pparg locus in dissected tumors (Supplemental Figure 2D). Importantly, the protection from tumorigenesis in double mutants was also long-lasting. While 100% of Pten mutants died before 14 months, the double mutants at the age of 15 months did not show any significant progression of (13, 26) and also demonstrated, for the first time to our knowledge,
[image:4.585.54.522.54.457.2]that the activation of Akt2 specifically in hepatocytes is required for liver tumorigenesis. Strikingly, hepatocyte-specific deletion of Pparg phenocopied to a large extent the deletion of Akt2, pro-viding a remarkable resistance to liver tumorigenesis (Figure 2A). Notably, Pparg deletion decreased liver hypertrophy by 50% (Fig-ure 2A and Supplemental Fig(Fig-ure 2A) and fully rescued liver dam-age (Figure 2B and Supplemental Figure 2B) in 1-year-old tumoral Pten mutants. Importantly, tumor incidence and size distribution of lesions in Pten mutants were significantly reduced by codeletion of either Akt2 or Pparg. Interestingly, Pten/Akt2 double mutants showed more protection as compared with Pten/Pparg double-
Figure 1. PPARγ is induced in a subset of human liver cancers. (A)Expression profiles of PPARG transcript in normal liver (N, n = 5), nontumoral liver (NT,
n = 52), HCA (n = 117), and HCC (n = 315) biopsies by real-time quantitative PCR. Data are presented as a ribosomal 18S–normalized mean fold (log2)
com-pared with the mean value in nontumoral samples ± SEM, Mann-Whitney test. *P < 0.05; ***P < 0.001. (B) Kaplan-Meier analysis and the log-rank test depending on the expression profiles of PPARG in HCC biopsies. Groups are defined according to the PPARG transcript levels using a fold change of 3 as threshold. HCC (n = 237), Mann-Whitney test, P = 0.0051. (C)Immunoblot analysis of PPARγ levels in HCC biopsies of G3 (HIGH) versus other subgroups (LOW). Immunoblot with anti-GAPDH antibody served as a loading control. Total PPARγ signal was quantified. Data are means ± SEM, n = 6–7. *P < 0.05, 2-tailed, unpaired Student’s t test. (D) Immunoblot analysis of PPARγ levels and Akt signaling activation in HCC and in nontumoral (NT) liver biopsies. Immunoblot with anti-GAPDH antibody served as a loading control. Densitometric analysis of GAPDH-normalized total PPARγ signal is presented. Data are means ± SEM, n = 4–6. *P < 0.05 vs. NT; #P < 0.05 vs. LOW; 1-way ANOVA with Tukey’s multiple-comparisons test. The Pearson correlation between total
The Journal of Clinical Investigation
R E S E A R C H A R T I C L EFigure 2. Liver tumorigenesis driven by activated insulin signaling is rescued by hepatocyte-specific
deletion of Akt2 and Pparg. (A)Representative
images of livers of 12- and 15-month-old male mice. Scale bar: 1 cm. (B)Plasmatic aspartate transaminase levels in random-fed 12-month-old male mice (n = 4). (C and D) Relative transcript levels (C) and immuno-blot analysis of total protein extracts (D) of PPARγ
in livers of 5-month-old male mice of indicated gen-otypes, n = 6–8. (E) Relative liver weight (n = 8–12). (F) Representative images of immunohistochemical analyses with anti-BrdU/anti–β-catenin antibodies, H&E, and Oil Red O (ORO). Scale bar: 50 μm. (G and
H) Hepatocyte proliferation presented as the ratio of BrdU+ nuclei to total number of hepatocyte nuclei
(n = 3–9) (G) and hepatic triglyceride levels (n = 7) (H) in liver tissue of 5-month-old male mice of indi-cated genotypes. Data are means ± SEM. *P < 0.05 vs. WT; #P < 0.05 vs. Pten LKO mice; 1-way ANOVA
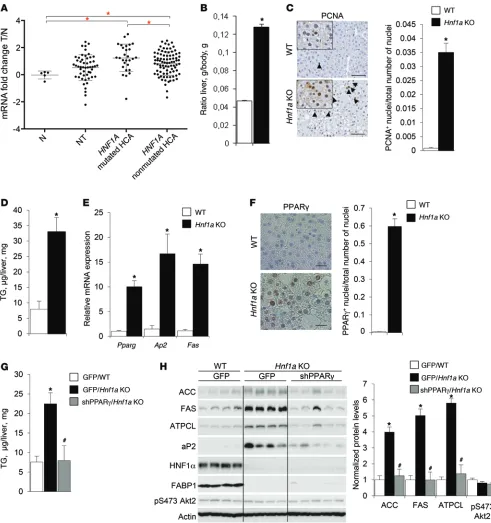
Figure 3. PPARγ expression and activity are induced in liver lesions characterized by inactivation of the transcription factor HNF1α. (A) Expression profile of PPARG transcript in normal liver (N, n = 5), nontumoral liver (NT, n = 52), biopsies of HNF1A-mutated HCAs (n = 29), and non–HNF1A-mutated HCAs (n = 87) by real-time quantitative PCR. Data are presented as a ribosomal 18S–normalized mean fold (log2) compared with the mean value in nontumoral samples ± SEM, Mann-Whitney test. *P < 0.05. (B–F) Relative liver weight (n = 7) (B), hepatocyte proliferation revealed by anti-PCNA immunohistochemis-try (the inset shows the magnified view of the PCNA+ hepatocytes) and analyzed as a ratio of PCNA+ nuclei to total number of hepatocyte nuclei (n = 3) (C),
hepatic triglycerides (n = 5) (D), relative transcript levels of Pparg and PPARγ target genes (n = 3) (E), and immunohistochemistry analysis using anti-PPARγ
antibody (F) in livers of 3-month-old random-fed WT and Hnf1a KO male mice. Data are means ± SEM. *P < 0.05 vs. WT; 2-tailed, unpaired Student’s t test. Scale bar: 25 μm. (G and H)Hepatic triglycerides (G) and immunoblot analysis of total protein extracts (H) from liver tissue of 10-week-old random-fed WT and Hnf1a KO female mice sacrificed 5 days after transduction with adenoviral vectors expressing PPARγ shRNA or GFP. Densitometric analysis of actin- normalized signals is presented. Data are means ± SEM, n = 4–5. *P < 0.05 vs. WT/AdGFP; #P < 0.05 vs. Hnf1a KO/AdGFP; 1-way ANOVA with Tukey’s
The Journal of Clinical Investigation
R E S E A R C H A R T I C L EFigure 4. HNF1α is a novel negative regulator of PPARG gene transcription. (A)Localization of
putative HREs in the human PPARG gene. Gray and white rectangles represent noncoding and coding exons, respectively. Black rectangles represent putative HREs. Arrows mark localization of the PPARG isoform–specific promoters. (B) Relative enrichment of endogenous HNF1α at putative HREs on the
PPARG and ALB genes in unsynchronized HUH7 cells. Data are means ± SEM, n = 3 independent
experiments. *P < 0.05 vs. IgG; 2-tailed, unpaired Student’s t test. (C) The luciferase reporter activity normalized to β-gal activity in primary hepatocytes overexpressing HNF1α or GFP using HNF4A or
PPARG promoter constructs. Data are presented as fold difference over empty vector–transfected
AdGFP-infected condition. Data are means ± SEM, n = 3 independent hepatocyte cultures. *P < 0.05 vs. empty vector; 1-way ANOVA with Tukey’s multiple-comparisons test. (D) Immunoblot analysis of PPARγ protein after HNF1α overexpression in primary hepatocytes 24 hours after transduction with increasing doses of adenoviruses (0.5, 1, and 5 MOI). Immunoblot with anti-GAPDH antibody served as a loading control. (E)Luciferase activity of FGB-LUC, normalized to Renilla, measured in livers of 2-month-old male mice sacrificed 24 hours after hydrodynamic shock delivery. Data are means ± SEM, n = 3–7. *P < 0.05 vs. WT; #P < 0.05 vs. Pten LKO; 2-tailed, unpaired Student’s t test. (F and
G) Immunoblot analysis of total protein extracts (F) and relative transcript levels (G) of HNF1α and HNF1α target genes in liver tissue of 4-month-old random-fed male mice. Densitometric analysis of actin-normalized signals is presented as a graph. Data are means ± SEM, n = 4–5. *P < 0.05 vs. WT;
the disease as compared with 12-month-old animals, as assessed by the liver macroscopic appearance and organ hypertrophy (Fig-ure 2A and Supplemental Fig(Fig-ure 2A).
To determine whether PPARγ was required in the early stages of liver disease development in the Pten-null model, the pheno-type of mutants was characterized at a pretumoral age of 5 months. First, the efficient deletion of targeted genes was confirmed by the immunoblotting analyses in liver extracts of respective mutants (Supplemental Figure 3, A and B). Importantly, significant PPARγ
induction was observed in the liver tissue of Pten mutants at both the transcript and the protein level (Figure 2, C and D, and Sup-plemental Figure 3B). Strikingly, it was fully rescued by codeletion of Akt2 (Figure 2, C and D). To get further insight into the upreg-ulation of PPARγ in Pten-null liver, we analyzed the expression of PPARγ isoforms using specific primer pairs in real-time quan-titative PCR analysis. As a result, we revealed that transcript of PPARγ2 isoform was potently induced in Pten-null liver already at an early pretumoral age (Supplemental Figure 3C). PPARγ1 was significantly upregulated in aged Pten mutants (Supplemental Fig-ure 3C). Importantly, these analyses also revealed that deletion of Pparg in Pten-null hepatocytes did not affect Akt activation, as wit-nessed by phosphorylation of Ser473 in Akt and its downstream target Pras40, further suggesting that PPARγ activity is down-stream of PI3K/Akt2 signaling (Supplemental Figure 3B).
At the organ level, similar to what is observed in 1-year-old tumoral mice, the liver hypertrophy at pretumoral age in Pten sin-gle mutants was corrected by 80% and 74% by codeletion of Akt2 or Pparg, respectively (Figure 2E). The increase in liver size of Pten mutants at this age was due to a 2-fold increase in hepatocyte pro-liferation and cell size (Figure 2, F and G, and Supplemental Figure 3D). Both of these parameters were rescued to a similar extent by ablation of Akt2 or Pparg expression in Pten-null hepatocytes (Fig-ure 2, F and G, and Supplemental Fig(Fig-ure 3D).
PPARγ specifically controls the transcription of hexokinase 2 (HK2) and M2 pyruvate kinase (PKM2), 2 enzymes that greatly enhance aerobic glycolysis and promote lipogenesis, well-known metabolic rearrangements in tumoral cells (13). As shown in Figure 2H, the steatosis of Pten mutants, as reflected by a 5-fold increase in triglyceride levels, was inhibited by 58% and 78%, respectively, upon deletion of Pparg or Akt2. These biochemical measurements were also reinforced by the histological assessment of liver tissue sections using H&E and Oil Red O staining (Figure 2F). These observations were further corroborated by changes in transcript and protein levels of metabolic enzymes in Pten-null livers in a PPARγ-dependent manner (Supplemental Figure 3, E and F). In sum, the characterization of liver-specific Pten/Akt2 and Pten/ Pparg double mutants validates Pparg as an essential gene prod-uct for the metabolic rearrangements and liver tumorigenesis downstream of activated Akt2. Altogether, these genetic epistasis experiments strongly suggest that Akt2 and PPARγ act in a linear pathway in a cell-autonomous manner and corroborate our analy-ses in human patient HCC samples.
PPARγ is induced in liver lesions characterized by HNF1α inac-tivation. To gain further mechanistic insights into the regulation of PPARγ expression in liver cancer, we considered the following points: (a) PPARG transcript levels are induced in premalignant HCA lesions in patients, (b) Pten/Pparg double-knockout mice
are resistant to liver tumorigenesis, and (c) HCC commonly develops in an environment of HCA both in Pten mutant mice and in humans. Altogether, these data suggest that activation of PPARG transcription might be an early event in hepatocyte trans-formation. Recent genomic studies in HCAs revealed a progres-sive accumulation of genetic alterations in the course of malig-nant transformation to HCC. Unlike HCCs, for which each lesion contains on average about 60 damaging mutations, HCAs are more homogeneous, starting with fewer than 10 alterations with progressive accumulation during the course of transformation (1–3, 27). We therefore reasoned that PPARG expression analysis in HCA subgroups is more likely to identify direct molecular reg-ulators. Using our annotated HCA biopsy collection, we showed that PPARG transcript levels were significantly induced in a subgroup of lesions harboring loss-of-function mutations in the transcription factor HNF1A (Figure 3A). These lesions constitute a homogeneous group of HNF1A-mutated adenomas (H-HCA) and represent about 30% of HCA. Next, we asked whether the expression of HNF1A and its downstream targets was modified in HCCs in which we found PPARG transcript upregulated. We discovered that, although transcript levels of HNF1A were not modified between nontumoral and HCC samples characterized by increased PPARG transcript levels, the expression of known HNF1α target genes (ALB, FABP1, and UGT2B7) was significantly decreased (Supplemental Figure 4A). These observations in HCA and HCC advocate a link between HNF1α and PPARG expression. Furthermore, a presence of diffuse steatosis devoid of inflamma-tion is a striking feature uniformly observed in all H-HCA lesions (22, 28, 29). Given that PPARγ is a prosteatogenic transcription factor, increased PPARG transcript levels in H-HCA suggest that HNF1α and PPARγ might functionally interact in hepatocytes. To test this possibility, we used a whole-body mouse mutant of Hnf1a. Consistent with the initial characterization of Hnf1a mutants (30), 2-month-old Hnf1a knockout mice presented a striking 280% liver hypertrophy (Figure 3B). This liver hypertro-phy was due to increased hepatocyte proliferation as revealed by nuclear PCNA and Ki67 localization (Figure 3C and Supplemen-tal Figure 4B). Furthermore, consistent with the steatotic nature of H-HCA lesions, Hnf1a mutants showed a 4-fold increase in lip-id accumulation in liver, as assessed by biochemical triglycerlip-ide (TG) measurements and histological analysis of liver tissue (Fig-ure 3D and Supplemental Fig(Fig-ure 4C). Importantly, we observed a 10-fold induction of hepatic PPARγ transcript and protein expres-sion in Hnf1a-null liver (Figure 3E and Supplemental Figure 4D). Notably, both isoforms of PPARγ, PPARγ1 and PPARγ2, were upregulated in the liver of Hnf1a mutants, albeit PPARγ1 protein to a larger extent, unlike in Pten mutants (Supplemental Figure 4, D and E). This was accompanied by PPARγ activation, as indi-cated by nuclear accumulation of PPARγ protein (Figure 3F) and increased expression of its target genes (Figure 3E). In summary, PPARγ expression and activity are upregulated both in H-HCA and in liver of Hnf1a mouse mutants, suggesting a functional interaction between these 2 transcription factors.
The Journal of Clinical Investigation
R E S E A R C H A R T I C L EFigure 5. HNF1α is a novel substrate of Akt2 phosphorylated on Ser247. (A) Immunoblot analysis of endogenous HNF1α immunoprecipitated from liver
tissue extracts of 5-month-old random-fed male mice of indicated genotypes with antibody recognizing an Akt-phosphorylation motif. The membrane was reprobed with anti-HNF1α antibody. Densitometric analysis of phosphorylated HNF1α normalized to immunoprecipitated HNF1α signals is presented. Data are means ± SEM, n = 4–5. *P < 0.05 vs. WT; #P < 0.05 vs. Pten LKO; 1-way ANOVA with Tukey’s multiple-comparisons test. (B) Immunoblot analysis of
immuno-precipitated HNF1α-WT-MYC, HNF1α-S247A-MYC, and HNF1α-S247D-MYC proteins transiently overexpressed in HEK293T cells, using antibody recognizing an Akt-phosphorylation motif. The immunoblot with anti-HNF1α of the same membrane served as a loading control. (C) Immunoblot analysis of immunoprecipi-tated HNF1α-WT-MYC and HNF1α-S247A-MYC proteins transiently overexpressed in HEK293T cells, using antibody raised against phosphorylated S247HNF1α. (D and E) Immunoblot analysis of total protein extracts of immortalized WT mouse embryonic fibroblast cells transiently overexpressing Myc-tagged HNF1α
WT protein. Twenty-four hours after transfection, cells were starved in Earle’s Balanced Salt Solution for 2 hours followed by 30 minutes of treatment with 100 nM Torin before stimulation with 10% FBS for 1 hour (D) or stimulation with 10% FBS for indicated times (E). (F) Immunoblot analysis of endogenous HNF1α immunoprecipitated from liver tissue extracts of 5-month-old random-fed male mice of indicated genotypes with antibody raised against phosphor-ylated S247HNF1α. Densitometric analysis of phosphorylated HNF1α normalized to total HNF1α is presented. Data are means ± SEM, n = 5. *P < 0.05 vs. WT;
#P < 0.05 vs. Pten LKO; 1-way ANOVA with Tukey’s multiple-comparisons test. (G) Immunoblot analysis of nuclear protein extracts from livers of 3-month-old
transcription was further supported by the downregulation of PPARγ transcript and protein levels in primary mouse hepatocytes upon HNF1α overexpression (Figure 4D and Supplemental Figure 6A). Previous reports suggested that in addition to HNF4A being a target gene of HNF1α, HNF4α protein binds and acts as a cofac-tor of HNF1α, potently stimulating its transcriptional activity (31). We tested the synergism of these factors on PPARG expression. By using both pharmacological inhibition of HNF4α by the selec-tive antagonist BI6015 and HNF4α ectopic expression, we did not observe the functional cooperation between HNF1α and HNF4α
in the repression of PPARG expression (Supplemental Figure 6, B and C). Together, these results reveal PPARG as a novel target under negative transcriptional control by HNF1α.
Activated Akt2 inhibits HNF1α. Our observations that PPARγ
expression in Pten-null liver is under positive control of Akt2 and that in hepatocytes PPARγ expression is negatively regulated by HNF1α made us hypothesize that there might be a functional link between Akt2 and HNF1α. We therefore tested HNF1α tran-scriptional activity in the livers of pretumoral Pten knockout and Pten/Akt2 double-knockout mice. In vivo luciferase assays using a reporter construct of a validated HNF1α transcriptional target (Fgb) demonstrated an 80% inhibition of HNF1α transcriptional activi-ty in liver tissue of Pten mutants (Figure 4E). Importantly, HNF1α
activity in the livers of Pten mutants was 1.7-fold upregulated by codeletion of Akt2 (Figure 4E). However, it was 60% of activity in WT livers, suggesting that other mechanisms may be implicated.
Next, we performed expression analyses in liver tissue of Pten and Pten/Akt2 double mutants. Consistent with the results of HNF1α transcriptional activity measurements in vivo, transcript and protein levels of HNF1α and its known targets were signifi-cantly downregulated in Pten-null livers in an Akt2-dependent manner (Figure 4, F and G). Notably, a similar level of inhibition of HNF1α transcriptional responses was observed in primary hepato-cytes isolated from Pten knockout mice, confirming the cell-au-tonomous nature of suppression (Supplemental Figure 6, D and E). Also, consistent with the observations in liver tissue extracts, the protein levels of HNF1α and its direct targets, Hnf4a and Alb, were rescued by codeletion of Akt2 in Pten-null hepatocytes (Sup-plemental Figure 6F). The repressive effect of HNF1α on Pparg expression was counteracted by overexpression of activated Akt2 (Myr-Akt2) in primary hepatocytes (Supplemental Figure 6G). Furthermore, inhibition of HNF1α by Myr-Akt2 was also observed on its transcriptional target, HNF4α, in a luciferase assay (Supple-mental Figure 6H). Collectively, these analyses in vitro and in vivo reveal HNF1α as a transcriptional repressor of Pparg under nega-tive control of Akt2.
HNF1α is a novel substrate of Akt2. To get further mechanistic insights into the HNF1α regulation by Akt2, we asked whether HNF1α could be a novel protein substrate of Akt2. By using phos-phospecific antibodies recognizing an Akt-phosphorylation motif, we revealed that endogenous HNF1α was phosphorylated in Pten-null liver in an Akt2-dependent manner (Figure 5A). Next, by using a bioinformatics approach, we identified Ser247, a highly evolu-tionary conserved residue in the DNA-binding domain of HNF1α, as a putative Akt-phosphorylation motif (see below). We confirmed that Ser247 was a major phosphorylation site for Akt in HNF1α, as a substitution of Ala or Asp for Ser247 abolished recognition of implicated in glycolysis and fatty acid synthesis (22), without
revealing the nature of the transcription factors involved in this response. To address the contribution of PPARγ to the fatty liver phenotype of Hnf1a mouse mutants, we acutely depleted hepat-ic PPARγ levels in Hnf1a-null mice using shRNA knockdown (Supplemental Figure 5, A and B). As a result, a 5-fold decrease of PPARγ expression in the livers of Hnf1a knockout mice nor-malized hepatic TG content (Figure 3G and Supplemental Figure 5C) and reversed lipogenic enzyme (ACC, FAS, ATPCL) and fatty acid–mobilizing protein (aP2) expression (Figure 3H). Notably, hepatic downregulation of PPARγ did not affect Akt2 activation, as assessed by phosphorylation of Ser473 (Figure 3H). Furthermore, to rule out any possible non–cell-autonomous effects associated with the responses in vivo, we also downregulated PPARγ expres-sion in primary hepatocytes isolated from Hnf1a mutant mice (Supplemental Figure 5D). Consistent with our observations in vivo, PPARγ depletion in primary hepatocytes efficiently rescued lipid accumulation (Supplemental Figure 5E) and had a profound effect on prolipogenic gene expression (Supplemental Figure 5D). Taken together, these observations indicate that PPARγ expres-sion is essential for lipogenesis and lipid accumulation in Hnf1a mutant hepatocytes.
HNF1α is a novel negative regulator of PPARG expression. Since PPARG transcript levels are induced in H-HCA and in the liver tis-sue of Hnf1a mouse mutants, we hypothesized that HNF1α might be a novel negative regulator of PPARG expression. Therefore, we performed a bioinformatics analysis of PPARG gene promoter for the presence of putative HNF1α response elements (HREs). In sil-ico analysis of the human PPARG locus identified multiple puta-tive HREs, spanning upstream of the PPARG1 and PPARG2 pro-moters and into the intronic sequences of the PPARG gene (Figure 4A). Namely, they were localized at positions HRE#1, –45,519 bp; HRE#2–4, –3,000 to –200 bp; HRE#5, +1,791 bp; HRE#6, +34,022 bp; HRE#7, +56,554 bp; and HRE#8–9, +75,457 to +76,000 bp from the transcription start site. Importantly, these putative HREs are conserved among mammals (Figure 4A). To evaluate whether HNF1α could directly bind to those putative HREs, we performed chromatin immunoprecipitation (ChIP) and analyzed enrich-ment in HNF1α binding using primers nested around the identi-fied sequences. As shown in Figure 4B, in human hepatocellular carcinoma HUH7 cells, endogenous HNF1α was found to bind to HRE#1, #2, and #7 with enrichment of more than 10-fold over IgG control immunoprecipitations. The observed binding to HREs in the PPARG promoter was similar to HRE binding in the promot-er of ALB, an established HNF1α target gene (Figure 4B). We also detected a consistent enrichment of HNF1α in the HRE#3 and HRE#9 regions, however, with lower affinity as compared with the other HREs (Figure 4B). Taken together, these findings indicate that PPARG is a novel transcriptional target of HNF1α.
Next, we investigated whether HNF1α was sufficient to inhib-it PPARG promoter activinhib-ity. Transfection of primary hepatocytes with a 3-kb human PPARG promoter luciferase reporter construct revealed a 50% inhibition of luciferase expression upon HNF1α
overexpression (Figure 4C). At the same time, overexpression of HNF1α induced luciferase expression from a hepatocyte nuclear factor 4α (HNF4α) reporter construct, a known positive HNF1α
The Journal of Clinical Investigation
R E S E A R C H A R T I C L Eupon serum stimulation conditions that activate Akt (Supplemen-tal Figure 7B). Importantly, the pharmacological inhibition of Akt signaling using the mTOR inhibitor Torin counteracted the effect of serum stimulation on the localization of WT HNF1α (Supple-mental Figure 7B). Notably, the phospho-mimicking substitution of Asp for Ser247 in HNF1α promoted cytoplasmic localization of HNF1α (Supplemental Figure 7B). In agreement with these subcellular localization studies, the transcription activity of the phospho-mimicking mutant of HNF1α was significantly reduced, as measured by levels of Hnf4a transcript upon overexpression of HNF1α S247D mutant (Supplemental Figure 7C). Altogether, these analyses demonstrate that HNF1α is a novel Akt2 substrate whose nuclear localization and transcriptional activity are inhibited by phosphorylation of Ser247.
Pharmacological targeting of PPARγ activity modulates liver tumorigenesis. PPARγ activation was proposed as an anticancer HNF1α by phosphospecific antibodies (Figure 5B). Next, we
gener-ated antibodies that specifically recognized phosphorylgener-ated Ser247 (Figure 5C). Phosphorylation of ectopically expressed WT HNF1α
[image:11.585.32.437.52.523.2]was induced by serum stimulation and was sensitive to inhibition of Akt signaling by Torin treatment (Figure 5, D and E). Analyses of the endogenous HNF1α protein immunoprecipitated from the liver extracts demonstrated that phosphorylation of Ser247 was induced in Pten-null liver in an Akt2-dependent manner (Figure 5F). To investigate the role of the newly identified HNF1α phos-phorylation, we studied subcellular localization of HNF1α. Our analysis of nuclear extracts from livers of Pten-null mice revealed a nuclear exclusion of endogenous HNF1α, which was dependent on Akt2 expression (Figure 5G). Furthermore, the analyses in HUH7 cells revealed that nuclear localization of transiently overexpressed WT HNF1α protein was promoted under serum starvation condi-tions, while HNF1α protein was readily observed in the cytoplasm
Figure 6. Pharmacological
activation of PPARγ aggravates
pathological liver growth in Pten
mutants. (A–D)Representative
images of livers (A), relative liver weight (B), plasmatic aspartate transaminase levels (C), and hepat-ic triglycerides (D) in 8-month-old male mice of the indicated genotypes fed with control or pioglitazone-containing (PIO) chow for 3 months. Data are means ± SEM, n = 5. *P < 0.05 vs. WT;
#P < 0.05 vs. Pten LKO; §P < 0.05
vs. chow food; 1-way ANOVA with Tukey’s multiple-comparisons test. Scale bar: 1 cm. (E and F) Represen-tative images (E) and quantifica-tion of lesions (F) in H&E-stained sections of livers of mice treated as in A. Dashed line marks lesion area. Scale bar: 500 μm (top), 100
μm (bottom). The relative area of adenoma, abnormally proliferat-ing bile ducts (BDPs), and tumor lesions is presented. Data are means ± SEM, n = 4. §P < 0.05 vs.
null mice (Figure 6, A and B). Importantly, this effect was limited to Pten mutants, as control mice were completely resistant to the growth-promoting effect of the PPARγ agonist, which is consistent with low expression of PPARγ in the livers of WT mice (Figure 6, A and B). To rule out any non–PPARγ-related effects of pioglitazone, we also treated Pten/Pparg double-knockout mice. Pten/Pparg mutants were remarkably resistant to the effect of the agonist, confirming the selectivity of the drug (Figure 6, A and B). Further-more, this chronic pioglitazone administration significantly aggra-vated liver damage in Pten mutants as reflected by a 70% increase in aspartate transaminase enzymatic activity in plasma while hav-ing no effect in the 2 control groups (Figure 6C). Consistent with PPARγ activation by pioglitazone, liver steatosis was significantly upregulated in Pten-null mice treated with the agonist, as assessed by hepatocyte morphological appearance, by Oil Red O staining, treatment in certain malignancies, promoting cell differentiation
and cell cycle withdrawal (32–34). However, our data suggest that PPARγ transcriptional activity could be protumorigenic in the context of activated Akt2 signaling in the liver. While the nature of endogenous PPARγ ligands is still obscure, a plethora of synthetic PPARγ agonists, including the thiazolidinediones (TZDs), is avail-able. For example, the typified TZD pioglitazone was widely used in the clinic as an insulin sensitizer. In contrast, only a few selec-tive PPARγ antagonists with potent in vivo activity are available. The most recent compound of this class is SR2595, which displays satisfactory pharmacokinetics to support in vivo studies (35). To clarify the outcomes of hepatic PPARγ activity modulation in vivo, we performed chronic treatments with pioglitazone and SR2595. Treatment with pioglitazone starting from 5 months of age for 3 months resulted in a striking 85% increase in liver size of
Pten-Figure 7. PPARγ inhibition by SR2595 significantly improves
the phenotype of tumoral Pten mutants. (A)Blood glucose
levels measured during treatment with SR2595 or placebo from 5 to 6 months of age in random-fed Pten LKO male mice. Data are means ± SEM, n = 3. *P < 0.05 vs. D0; #P < 0.05
vs. Pten LKO/placebo; 1-way ANOVA with Tukey’s multi-ple-comparisons test. (B and C) Hepatic triglycerides (B) and representative images of immunohistochemical analyses with anti-BrdU/anti–β-catenin antibodies and quantification of hepatocyte proliferation presented as a ratio of BrdU+ nuclei to
total number of hepatocyte nuclei (C) in livers of random-fed mice treated as in A. Data are means ± SEM, n = 3. *P < 0.05 vs. WT; #P < 0.05 vs. Pten LKO/placebo; 1-way ANOVA with
Tukey’s multiple-comparisons test. Arrowheads point to BrdU+
proliferating hepatocytes. The inset shows the magnified view of the BrdU+ hepatocytes. Scale bar: 100 μm. (D)Blood glucose
levels measured during treatment with SR2595 from 11 to 12 months of age in random-fed Pten LKO male mice. Data are means ± SEM, n = 6. *P < 0.05 vs. placebo; 2-tailed, unpaired Student’s t test. (E and F)Representative images of livers (E) and H&E-stained liver sections (F) of mice treated as in
[image:12.585.43.510.60.541.2]The Journal of Clinical Investigation
R E S E A R C H A R T I C L Elevels, consistent with the aggravation of the tumoral phenotype from 11 months to 1 year, SR2595-treated mice had a stable gly-cemia during the course of treatment and even demonstrated an improvement to levels found in pretumoral mice (Figure 7D). Most importantly, PPARγ inhibition had a positive therapeutic effect on disease progression marked by 50% lower liver hypertrophy in SR2595-treated Pten mutants (Figure 7E and Supplemental Figure 9H). This observation was further corroborated by a low-er numblow-er and smalllow-er size of lesions obslow-erved in the SR2595- treated mice compared with vehicle-treated animals (Figure 7, E and F, and Supplemental Figure 9I). Finally, proliferation in tumor-al lesions (Supplementtumor-al Figure 9J), as assessed by BrdU labeling, was severely blunted, while apoptosis (Supplemental Figure 9K), evaluated by TUNEL assay, was induced in SR2595-treated mice as compared with the placebo-treated group. Altogether, these multiple lines of evidence lay a strong foundation supporting the pharmacological modulations of hepatic PPARγ activity as a ther-apeutically relevant intervention in hepatic malignancies associ-ated with activassoci-ated Akt2 and PPARγ signaling.
Discussion
Growth factor signaling is found to be upregulated in a majority of malignancies, including liver cancer. Yet the outcomes of its inhi-bition in the clinic are disappointing, because of the presence of complex feedback mechanisms, urging identification of specific targets for selective treatments (36, 37). By analyzing one of the largest and best-annotated collections of patient hepatic lesions, in combination with analyses of animal models of liver cancer driven by activated insulin signaling, we identified the transcrip-tion factor PPARγ as an essential player in liver tumorigenesis. The most significant findings of our work are: (a) PPARγ expression is upregulated in a subset of human HCAs (hHCA) and hHCCs; (b) activation of Akt2 isoform in hepatocytes is sufficient to induce liver steatosis and tumorigenesis, which is dependent on PPARγ; (c) activated Akt2 relieves the repressive function of HNF1α on PPARγ expression, a mechanism conserved in mice and humans; and (d) pharmacological inhibition of PPARγ is therapeutic in liver disease driven by activated Akt2 signaling.
The most unexpected finding of our studies is the discov-ery of a novel role for HNF1α as a negative regulator of PPARγ
expression, corroborated by HNF1α gain-of-function and loss-of- function experiments and identification of HNF1α binding sites in the promoter region of PPARG. HNF1α is a homeodomain- containing protein that was originally identified as a hepato-cyte-specific transcription factor critical for hepatocyte differen-tiation and metabolic function of liver (30, 38). Its role in defining hepatocyte fate is supported by recent studies in mouse and human fibroblasts that are differentiated to hepatocytes with function-al benefits in vivo by transcription factors including HNF1Α (39, 40). Its function as a tumor suppressor gene in liver was proposed after identification of biallelic loss-of-function somatic mutations in a subclass of hepatocellular adenomas, H-HCA (41). Consis-tently, expression of HNF1α was reported to be downregulated in patient HCC lesions as well as in mice in chemically induced HCCs (42). Furthermore, HNF1α overexpression both in vitro and in vivo potently inhibited proliferation of cancer cells and inhib-ited tumor progression (42). So far, no direct targets that are neg-and by biochemical measurements of triglycerides in liver extracts
(Figure 6D and Supplemental Figure 8, A and B). This was paral-leled by increased expression of PPARγ targets in livers of Pten mutants treated with pioglitazone (Supplemental Figure 8, C and D). Importantly, these metabolic rearrangements in livers of Pten mutants upon pioglitazone administration were accompanied by significant expansion of hepatic lesions (Figure 6, E and F). Nota-bly, in Pten mutants at this age, the majority of lesions were clas-sified as adenomas, while in pioglitazone-treated mutants these lesions were predominantly the high-grade proliferating bile duct neoplasia and HCCs (Figure 6, E and F). In sum, pharmacological activation of PPARγ in Pten-null mice significantly aggravates liver damage and accelerates liver tumorigenesis.
Next, to test whether pharmacological inhibition of PPARγ
could be therapeutically beneficial, we treated Pten mutants at pretumoral and tumoral age with the PPARγ antagonist SR2595. Treatment of 5-month-old pretumoral Pten mutants during 1 month was well tolerated and did not cause any adverse toxici-ty, as reflected by the absence of weight loss during the course of treatment (Supplemental Figure 9A). Importantly, 1-month treatment with SR2595 resulted in a significant inhibition of PPARγ activity as revealed by decreased PPARγ target expres-sion in liver tissue of Pten mutants (Supplemental Figure 9, B and C). In addition, a 30% increase in free fatty acids in the plasma of SR2595-treated Pten-null mice, as compared with the place-bo-treated group, indicated a potent systemic effect of SR2595 (Supplemental Figure 9D). This is consistent with the inhibition of PPARγ in adipose tissue, where PPARγ is required for lipid storage. Furthermore, expression analyses revealed no inhibito-ry effect of SR2595 on PPARα activity, ruling out potential off- target effects of this antagonist (Supplemental Figure 9E). In sum, SR2595 is a potent specific PPARγ antagonist efficient in inhibiting PPARγ function in the liver of Pten mutants.
The aggravation of the liver phenotype in Pten mutants was accompanied by an increase in steatosis and hypoglycemia as the mice aged. One month of SR2595 treatment had a striking thera-peutic effect by stabilizing glycemia and normalizing the steato-sis of Pten mutants (Figure 7, A and B). Consteato-sistent with decreased steatosis, hepatocyte size was rescued by SR2595 treatment in the livers of Pten-null mice, as witnessed by changes in cell density (Figure 7C and Supplemental Figure 9F). Finally, the increased hepatocyte proliferation in Pten mutants was normalized in SR2595-treated animals (Figure 7C). In conclusion, consistent with the genetic epistasis experiments, pharmacological inhibi-tion of PPARγ in pretumoral Pten-null mice normalizes liver ste-atosis and inhibits hepatocyte proliferation.
expression of GATA2 in human HCC correlates with increased proliferation rate and poor prognosis following resection (55). Curiously, GATA2, KLF2, FRA-1, FRA-2, and c-Fos proteins con-tain putative phosphorylation motifs for Akt. It is tempting to spec-ulate that, in addition to HNF1α, these might contribute to PPARG transcriptional control in liver via phosphorylation by Akt2.
One of the major findings of our study is a demonstration of therapeutic efficacy of a novel PPARγ antagonist in the preclin-ical liver cancer model. Future studies are required to address whether SR2595 could be taken to clinic as a sole agent or in a combination with other drugs. Curiously, a recent report demon-strated that systemic inhibition of Akt signaling modeled by hepatic deletion of Akt1 in whole-body Akt2 mutants provokes an early-onset spontaneous hepatocarcinogenesis, suggesting that pharmacological inhibition of Akt might be deleterious in the clinic (56). Interestingly, previous reports using the whole-body mutants uncovered the tumorigenic role of Akt1, unlike Akt2, in prostate and endometrium (57, 58). At the same time, we and others have shown that whole-body deletion of Akt2 strong-ly protects from liver cancer driven by loss of Pten expression in hepatocytes (13, 26). Here, for the first time to our knowledge, we demonstrated that hepatocyte autonomous Akt2 signaling is essential for liver tumorigenesis driven by oncogenic insult. Importantly, our study also provides a downstream target of Akt2, PPARγ, whose inhibition is therapeutic.
In summary, in this study we uncovered an unappreciated pro-tumorigenic function of PPARγ in liver and established a novel func-tional link between 2 master regulators of cellular fate, the hepato-cyte differentiation factor HNF1α and the lipogenic transcription factor PPARγ, in liver pathophysiology. The detection of increased PPARγ mRNA and protein in a subset of human liver cancers, as well as the efficacy of PPARγ antagonist in preclinical studies of liv-er tumorigenesis, should open new thliv-erapeutic possibilities to test.
Methods
Animals. Ppargfl/fl, Akt2fl/fl, Ptenfl/fl, and Hnf1a–/– mouse lines have been
previously described (12, 30, 59, 60). SR2595 was synthesized and purified as previously described (35). Animals were maintained in grouped cages in a temperature-controlled pathogen-free facility on a 12-hour/12-hour (8 am–8 pm) light/dark cycle and had free access to water and standard chow (Teklad global protein diet; 20% pro-tein, 75% carbohydrate, 5% fat). Animals were sacrificed between 2 and 4 pm. For the in vivo pharmacological treatments with pioglita-zone incorporated in chow food (200 mg/kg), mice had free access to food and were treated for 3 months, from the ages of 5 months to 8 months. For the in vivo pharmacological treatments, SR2595 was administered daily by oral gavage (20 mg/kg). In the pretumor-al group, mice were treated daily by orpretumor-al gavage for 1 month from the ages of 5 to 6 months. For the tumoral group, treatment was initiated at 11 months of age for 1 month. For 5-bromo-2′ -deoxyu-ridine (BrdU) incorporation at pretumoral age, mice were treated with BrdU (3 mg/ml; Sigma-Aldrich) dissolved in drinking water for 5 days before sacrifice. At tumoral age, BrdU was administered i.p. (50 mg/kg) 2 hours before sacrifice. For in vivo transduction, 109 adenoviral infectious particles were diluted in 0.9% NaCl and
administered retro-orbitally in a total volume of 100 μl per animal. Animals were sacrificed 5 days after injection.
atively regulated by HNF1α are reported. The published reports show that at the genomic level, HNF1 binding sites are enriched in genes whose expression is normally decreased in Hnf1a knockout mice. However, a group of genes including the lipogenic enzymes was already suggested, but not tested experimentally, to be under negative control of HNF1α (22). In addition, HNF1β, a close paral-og of HNF1α normally involved in the positive transcriptional acti-vation of target genes, has been described as a repressor of SOCS3 transcription (43). Furthermore, in vitro studies demonstrated that HNF1α could negatively regulate its own and other promoters in an indirect manner. The corepressor activity of HNF1α was observed in a complex with another transcription factor, the orphan nucle-ar receptor HNF4α (44). However, our bioinformatics analyses did not reveal HNF4α binding sites in proximity to the identified HNF1α response elements in the promoter of PPARG. Further-more, our analyses did not reveal the synergism between these 2 transcription factors in the regulation of PPARG transcription.
Importantly, our study suggests that HNF1α is under tight control by the PI3K/Akt2 pathway. We discovered that HNF1α is a novel substrate of Akt2 phosphorylated in position Ser247. Our in vitro observations using a phospho-mimicking mutant of HNF1α
suggest that phosphorylation of Ser247 in HNF1α promotes its cytoplasmic localization, thus modulating the activity of the tran-scription factor. HNF1α was found to be phosphorylated at Ser247 in 3 independent mass spectrometry–based studies (45–47). Another report has suggested that multiple sites in HNF1α, includ-ing Ser247, are phosphorylated by Mirk kinase (48). However, the conclusions were based on in vitro kinase assays with recom-binant proteins, and no functional implications were proposed. Early studies with naturally occurring MODY mutants of HNF1α
have suggested that conformational changes in HNF1α protein may affect not only its interaction with coactivators but also their enzymatic activity on the promoters of target genes (e.g., acetyl-transferase activity of CBP and P/CAF) (49). Future studies will be required to address the involvement of Akt2-mediated phosphory-lation of HNF1α in the recruitment and activity of cofactors.
The Journal of Clinical Investigation
R E S E A R C H A R T I C L Eical analyses. Stained liver tissue sections were digitalized with the NanoZoomer S210 (Hamatsu). The classification and quantification of tumor lesions was performed using NDP.view2 software. For Oil Red O staining, frozen liver sections were fixed with 4% formaldehyde for 15 minutes, followed by incubation in 60% isopropanol for 5 minutes and then with Oil Red O (Bio-Rad) for 15 minutes at room temperature. Sections were washed twice with PBS and twice with water. After coun-terstaining with hematoxylin, slides were mounted with 90% glycerol. Immunohistochemistry of liver tissue sections was performed using anti-PCNA (Cell Signaling Technology) or anti-Ki67 (Thermo Fisher Scientific) or with a mix of anti-BrdU (Roche) and anti–β-catenin (Cal-biochem) antibodies. The results are expressed as the ratio of BrdU+,
PCNA+, or Ki67+ nuclei to the total number of nuclei in a total area of at
least 10 sequential fields of 33,500 μm2 tissue analyzed.
Real-time quantitative PCR. Total RNA was isolated from 50–100
mg of snap-frozen liver tissue by RNeasy Lipid Tissue Mini Kit (Qia-gen) and RNeasy Mini Kit (Qia(Qia-gen) from primary hepatocytes. cDNA was synthesized from 1 μg of total RNA using 125 ng of random hex-amer primers and SuperScript II (Life Technologies). Real-time quan-titative PCR was performed on an MX3005P instrument (Agilent) using iTaq Universal SYBR Green Supermix (Bio-Rad). The relative amounts of transcripts were determined by the 2–ΔΔCT method, with
pinin, cyclophilin, or S18 as reference gene and control treatment or control genotype as the invariant control. The primer sequences are listed in Supplemental Table 2.
For patient HCC samples, predesigned validated primers and probe sets were used (Life Technologies). The relative PPARG (Hs00234592_m1) gene expression was normalized to ribosomal 18S (Ribosomal 18S; 4352930) transcript levels. The expression levels of
PPARG in tumor samples were compared with the mean level (log2) of the corresponding gene expression in normal liver tissues (n = 5), expressed as n-fold ratio. The relative amount of RNA was calculated with the 2−ΔΔCT method.
Luciferase reporter assay. Luciferase assay was performed using a
Dual Luciferase reporter kit (Promega) according to the manufactur-er’s instructions. Luciferase reporter constructs were a gift of L. Fajas (pGL3 empty vector and pGL3-PPARG-p3000; University of Laus-anne, LausLaus-anne, Switzerland), Dimitris Kardassis (pGL3-HNF4A and pGL3-APOC3; University of Crete Medical School, Crete, Greece), and Maria-Angeles Navas (pGL3-FGB; Universidad Complutense de Madrid, Madrid, Spain). For in vivo studies, a mix of luciferase pro-moter construct (40 μg/ml) and Renilla control plasmid (4 μg/ml) was administered by hydrodynamic shock through the penis vein in a volume of 70 μl/g of body weight delivered in 10 seconds. Mice were sacrificed 24 hours after treatment, and liver tissue was used for anal-ysis. For in vitro luciferase assays, isolated primary hepatocytes were transduced with adenoviral vectors (AdHNF1α or AdGFP) at a dose of 10 MOI. Twelve hours after transduction, cells were transfected with a mix of luciferase reporter constructs and control plasmid expressing
β-gal using Lipofectamine 2000 (Invitrogen). Twenty-four hours after transfection, cells were collected for luciferase reporter activity assay normalized to β-gal activity.
Chromatin immunoprecipitation. ChIP was performed using
HUH7 cells as described previously (13, 62). Endogenous HNF1α was immunoprecipitated with anti-HNF1α antibody (63). The relative amounts of the immunoprecipitated DNA were determined by real-time quantitative PCR using the 2−ΔΔCT method, with input DNA
val-Cell culture and recombinant adenoviruses. Human HCC cell line
HUH7 and HEK293T cells were obtained from ATCC and were main-tained in DMEM supplemented with 10% FBS, 2 mM l-glutamine, 50 U/ml penicillin, and 50 μg/ml streptomycin. Cells were regularly test-ed and were negative for mycoplasma contamination. Primary hepato-cytes from 4- to 6-week-old mice were isolated by liver perfusion as described previously (13). Unless indicated, cells were collected for analysis 12 hours after plating. GFP adenoviral vectors were described previously and were used as a control in all experiments (61). Adeno-viral particles expressing PPARγ shRNA were provided by Stephan Herzig (Institute for Diabetes and Cancer, Munich, Germany). Adeno-virus expressing HNF1α was provided by Benoit Violet (Cochin Insti-tute, Paris, France). Adenoviruses expressing AdMyr-Akt2 (catalog 1023) and AdHNF4α (ADV-261497) were from Vector Biolabs.
Hepatic metabolite analyses. TG levels in liver tissue or in primary
hepatocytes were determined using the Triglycerides FS Kit (Diasys). Fifty to one hundred milligrams of powdered liver tissue or pellet of 1 × 10⁶ cells was used for acetone extraction.
Protein extraction and immunoblotting. To prepare total protein
extracts, cells or tissue were homogenized in lysis buffer containing 20 mM Tris-HCl (pH 8.0), 5% glycerol, 138 mM NaCl, 2.7 mM KCl, 1% NP-40, 20 mM NaF, 5 mM EDTA, 1× protease inhibitors (Roche), and 1× PhosphoStop inhibitors (Roche). Homogenates were spun at 12,000
g for 10 minutes at 4°C. For immunoprecipitation, 500 μg of cleared protein extract was incubated with anti-Myc (9E11) or anti-HNF1α
(SC) for 3 hours at +4°C. Then, immune complexes were pulled down using Protein G-Sepharose beads (GE Healthcare) during 2 hours followed by 4 washes with extraction buffer. The protein complexes were eluted by boiling of the beads in 1× SDS–sample buffer for 10 minutes. Protein extracts or immunoprecipitate eluates were resolved by SDS-PAGE before transfer onto PVDF membrane followed by incu-bation with primary antibodies and HRP-linked secondary antibodies. Immobilon Western Chemiluminescent HRP Substrate (Millipore) was used for detection. Densitometric analysis of immunoblots was performed using ImageJ software (NIH). The antibodies used in the study are listed in Supplemental Table 1. See all complete unedited blots in the supplemental material.
Nuclear extracts were prepared from 50–100 mg of snap-frozen liver tissue mechanically disintegrated in hypotonic buffer (10 mM HEPES, pH 7.9, 1× Protease inhibitors, 1× PhosphoStop inhibitors) fol-lowed by 5 minutes of centrifugation at 60 g at 4°C. The supernatant was recuperated as a cytoplasmic fraction. The pellet was washed twice with hypotonic buffer followed by lysis in hypertonic buffer (20 mM HEPES, pH 7.9, 25% glycerol, 0.42 M NaCl, 0.2 mM EDTA, 1× Protease inhibi-tors, 1× PhosphoStop inhibitors). The nuclear extracts were cleared by centrifugation for 10 minutes at 12,000 g at 4°C. The supernatants of soluble nuclear proteins were used for immunoblotting analyses.
Generation of Hnf1a point mutants and phosphospecific antibody.
Site-directed mutagenesis was performed using QuikChange II Site- Directed Mutagenesis Kit (Stratagene) according to the manufacturer’s instructions and pcDNA5-Myc-HNF1A (Addgene, 31104) construct as a template. All inserts were sequence-verified. The phospho-HNF1α anti-body was developed in collaboration with Cell Signaling Technology.
Histological and morphometric analyses. For immunohistochemical
immunohistochem-Acknowledgments
We are grateful to the members of INSERM U1151 for support and to Lluis Fajas, Maria-Angeles Navas, Dimitris Kardassis, Stephan Herzig, and Benoit Violet for sharing reagents. We thank Jona-than Lerner for the advice on HNF1α ChIP experiments. We thank Sophie Berissi (Structure Fédérative de Recherche [SFR] Necker Small Animal Histology and Morphology Platform) and Sylvie Fab-rega (SFR Viral Vector and Gene Transfer Platform) for excellent technical support. This work was supported by grants from the European Research Council, from the European Foundation for the Study of Diabetes (EFSD), and from Institut National du Cancer (INCa) to M Pende. GP was supported by Fondation Tourre, EFSD, and INCa. CP was supported by La Ligue contre le Cancer. AR was supported by programme Cartes d’Identité des Tumeurs. M Ponto-glio was supported by Fondation pour la Recherche Médicale (equi-pe FRM), the Fondation Bettencourt-Schueller (Prix Coup d’Elan), Agence National pour la Recherche, and Labex « Who am I? » ANR-11-LABX-0071/ANR-11-IDEX-0005-02. The JZR team is an “équipe labellisée par la Ligue Nationale Contre le Cancer,” also funded by the Fondation Bettencourt-Schueller (Prix Coup d’Elan 2016), and the Labex OncoImmunology (Investissement d’Avenir).
Address correspondence to: Ganna Panasyuk or Mario Pende, Insti-tut Necker-Enfants Malades, 14 Rue Maria Helena Vieira da Silva, 75993 Paris Cedex 14, France. Phone: 0033.1.72.60.63.87; E-mail: ganna.panasyuk@inserm.fr (G. Panasyuk) or mario.pende@ inserm.fr (M. Pende).
ues for each sample as control and enrichment of 10-fold as a cutoff. Detailed protocol is in Supplemental Methods. The primer sequences are listed in Supplemental Table 2.
Statistics. Statistical analysis was performed with GraphPad Prism
5.0 (GraphPad Software). For parametric data with more than 2 com-parisons and biological replicate numbers of less than 10, a 1-way ANOVA with Tukey’s multiple-comparisons test was used unless specified. All data are expressed as means ± SEM, and significance was established at the P ≤ 0.05 level.
Study approval. All studies were approved by the Direction
Départementale des Services Vétérinaires, Préfecture de Police, Paris, France (authorization no. A75-14-08), Comité d’Ethique en matière d’Expérimentation Animale Paris Descartes (CEEA 34) (16-040), and le Ministère de l’Enseignement Supérieur et de la Recher-che (IE-2011-578).
Author contributions
GP and M Pende conceived the study, directed the work, and wrote the manuscript. GP and CP designed and conducted most of the experiments and analyzed the data. GC and JZR performed PPARG expression studies in human HCC and human HCA and provid-ed reagents and expertise. AB and M Pontoglio providprovid-ed Hnf1a mutants, shared reagents and expertise, and helped with HNF1α
ChIP experiments. TC and RR synthesized SR2595. AR performed bioinformatics analyses of available microarray data sets. JYS pro-vided the expertise in pathophysiological liver analyses. All authors discussed the results and commented on the manuscript.
1. Schulze K, et al. Exome sequencing of hepato-cellular carcinomas identifies new mutational signatures and potential therapeutic targets. Nat Genet. 2015;47(5):505–511.
2. Guichard C, et al. Integrated analysis of somatic mutations and focal copy-number changes iden-tifies key genes and pathways in hepatocellular carcinoma. Nat Genet. 2012;44(6):694–698. 3. Pilati C, et al. Genomic profiling of
hepatocellu-lar adenomas reveals recurrent FRK-activating mutations and the mechanisms of malignant transformation. Cancer Cell. 2014;25(4):428–441. 4. Fujimoto A, et al. Whole-genome mutational
landscape and characterization of noncoding and structural mutations in liver cancer. Nat Genet. 2016;48(5):500–509.
5. Shibata T, Aburatani H. Exploration of liver cancer genomes. Nat Rev Gastroenterol Hepatol. 2014;11(6):340–349.
6. Villanueva A, et al. Pivotal role of mTOR signal-ing in hepatocellular carcinoma.
Gastroenterolo-gy. 2008;135(6):1972–1983.e1.
7. Park EJ, et al. Dietary and genetic obesity pro-mote liver inflammation and tumorigenesis by enhancing IL-6 and TNF expression. Cell. 2010;140(2):197–208.
8. Wolf MJ, et al. Metabolic activation of intrahepatic CD8+ T cells and NKT cells causes nonalcoholic steatohepatitis and liver cancer via cross-talk with hepatocytes. Cancer Cell. 2014;26(4):549–564. 9. Lefterova MI, Haakonsson AK, Lazar MA,
Mandrup S. PPARγ and the global map of adipo-genesis and beyond. Trends Endocrinol Metab. 2014;25(6):293–302.
10. Rahimian R, Masih-Khan E, Lo M, van Breemen C, McManus BM, Dubé GP. Hepatic over- expression of peroxisome proliferator activated receptor gamma2 in the ob/ob mouse model of non-insulin dependent diabetes mellitus. Mol Cell Biochem. 2001;224(1–2):29–37.
11. Memon RA, et al. Up-regulation of peroxisome
proliferator-activated receptors (PPAR-α) and
PPAR-γ messenger ribonucleic acid expression in
the liver in murine obesity: troglitazone induces
expression of PPAR-γ-responsive adipose tissue-
specific genes in the liver of obese diabetic mice.
Endocrinology. 2000;141(11):4021–4031.
12. Horie Y, et al. Hepatocyte-specific Pten deficiency results in steatohepatitis and hepatocellular carci-nomas. J Clin Invest. 2004;113(12):1774–1783. 13. Panasyuk G, et al. PPARγ contributes to PKM2
and HK2 expression in fatty liver. Nat Commun. 2012;3:672.
14. Morán-Salvador E, et al. Role for PPARγ in obe-sity-induced hepatic steatosis as determined by hepatocyte- and macrophage-specific condition-al knockouts. FASEB J. 2011;25(8):2538–2550. 15. Lefebvre AM, et al. Activation of the peroxisome
proliferator-activated receptor γ promotes the development of colon tumors in C57BL/6J-APC-Min/+ mice. Nat Med. 1998;4(9):1053–1057. 16. Girnun GD, et al. APC-dependent suppression of
colon carcinogenesis by PPARγ. Proc Natl Acad Sci U S A. 2002;99(21):13771–13776. 17. Sarraf P, et al. Differentiation and reversal of
malignant changes in colon cancer through
PPARγ. Nat Med. 1998;4(9):1046–1052.
18. Knutson SK, Chyla BJ, Amann JM, Bhaskara
S, Huppert SS, Hiebert SW. Liver-specific deletion of histone deacetylase 3 disrupts metabolic transcriptional networks. EMBO J. 2008;27(7):1017–1028.
19. Bhaskara S, et al. Hdac3 is essential for the main-tenance of chromatin structure and genome stability. Cancer Cell. 2010;18(5):436–447. 20. Yu J, et al. Inhibitory role of peroxisome
prolif-erator-activated receptor gamma in hepatocar-cinogenesis in mice and in vitro. Hepatology. 2010;51(6):2008–2019.
21. Kawai D, et al. Hydrogen-rich water prevents progression of nonalcoholic steatohepatitis and accompanying hepatocarcinogenesis in mice. Hepatology. 2012;56(3):912–921.
22. Rebouissou S, et al. HNF1alpha inactivation promotes lipogenesis in human hepatocel-lular adenoma independently of SREBP-1 and carbohydrate-response element-binding protein (ChREBP) activation. J Biol Chem. 2007;282(19):14437–14446.
23. Boyault S, et al. Transcriptome classification of HCC is related to gene alterations and to new ther-apeutic targets. Hepatology. 2007;45(1):42–52. 24. Fajas L, et al. The organization, promoter
analy-sis, and expression of the human PPARγ gene. J Biol Chem. 1997;272(30):18779–18789. 25. Postic C, Magnuson MA. DNA excision in liver by
an albumin-Cre transgene occurs progressively with age. Genesis. 2000;26(2):149–150. 26. Galicia VA, et al. Expansion of hepatic tumor
The Journal of Clinical Investigation
R E S E A R C H A R T I C L E27. Totoki Y, et al. Trans-ancestry mutational land-scape of hepatocellular carcinoma genomes. Nat Genet. 2014;46(12):1267–1273.
28. Pelletier L, et al. Loss of hepatocyte nuclear fac-tor 1alpha function in human hepatocellular ade-nomas leads to aberrant activation of signaling pathways involved in tumorigenesis. Hepatology. 2010;51(2):557–566.
29. Zucman-Rossi J, et al. Genotype-phenotype correlation in hepatocellular adenoma: new clas-sification and relationship with HCC. Hepatology. 2006;43(3):515–524.
30. Pontoglio M, et al. Hepatocyte nuclear factor 1 inactivation results in hepatic dysfunction, phe-nylketonuria, and renal Fanconi syndrome. Cell. 1996;84(4):575–585.
31. Eeckhoute J, Formstecher P, Laine B. Hepatocyte nuclear factor 4α enhances the hepatocyte nucle-ar factor 1α-mediated activation of transcription. Nucleic Acids Res. 2004;32(8):2586–2593. 32. Srivastava N, et al. Inhibition of cancer cell
pro-liferation by PPARγ is mediated by a metabolic switch that increases reactive oxygen species levels. Cell Metab. 2014;20(4):650–661. 33. Jarvis MC, Gray TJ, Palmer CN. Both PPARγ a
nd PPARδ influence sulindac sulfide- mediated p21WAF1/CIP1 upregulation in a human prostate