Nutrient and Sediment Transport on Flood-Irrigated Pasture in the Klamath Basin, Oregon
D. Ciotti, 1 S. M. Griffith, 2 J. Kann, 3 and J. Baham 4
Authors are
1Biologist, Klamath Falls Fish and Wildlife Office, US Fish and Wildlife Service, Klamath Falls, OR 97601, USA;
2Research Plant Physiologist, National Forage Seed Production Research Center, US Department of Agriculture–Agricultural Research Service, Corvallis, OR 97331, USA;
3
Aquatic Ecologist, Aquatic Ecosystem Sciences LLC, Ashland, OR 97520, USA; and
4Associate Professor, Department of Crop and Soil Science, Oregon State University, Corvallis, OR 97331, USA.
Abstract
Distinguishing between anthropogenic and natural sources of sediment and nutrients is important for water resource management in irrigated basins. Water quality of flood irrigation was monitored at the field scale in the upper Klamath Basin, Oregon, on two unfertilized cattle pastures that were 2 ha (Site 1) and 70 ha (Site 2) in area. Water samples were analyzed for concentrations of sediment, total dissolved nitrogen (TDN), total dissolved phosphorus (TDP), orthophosphate, ammonium-N (NH z 4 -N), and nitrate-N (NO { 3 -N ). At both sites the TDN concentration was significantly greater in surface runoff than in applied irrigation water (P , 0.05). Site 1 sediment and TDP concentrations were significantly greater in irrigation surface runoff than in applied irrigation water (P , 0.05). A first flush during irrigation was observed at Site 1 where nutrient concentration was at maximum value during the first 3 h of surface runoff. At Site 2 the surface runoff sediment and TDP concentrations were not significantly (P . 0.05) higher than the applied irrigation, except when cattle were present. When export was measured, the mean yield of sediment and TDN per irrigation was 23.9 kg N ? ha 21 and 0.26 kg N ? ha 21 , respectively, and there was a net retention of TDP of 0.04 kg P ? ha 21 . NH z 4 -N export occurred during one irrigation event yielding 0.15 kg N ? ha 21 . NO { 3 -N export was minimal or undetected. A late summer storm event resulted in pasture surface runoff concentrations of TDN and TDP that were 33 and 3 times higher, respectively, than irrigation source water concentrations. The TDN was significantly higher in subsurface runoff than it was in applied irrigation water (P , 0.05). Improved irrigation efficiency might prevent many of the nutrient and sediment transport mechanisms observed during this study.
Resumen
La habilidad de distinguir entre fuentes de nutrientes y sedimentos antropoge´nicos y naturales es importante para el manejo de recursos hı´dricos de cuencas irrigadas. Se monitoreo´ la calidad del agua de riego por inundacio´n medida a escala de potrero en la cuenca superior del rio Klamath en Oregon, EE.UU., en dos pasturas sin fertilizar pastoreadas por bovinos, una de 2 (Sitio 1) y otra de 70 ha (Sitio 2) de superficie. Se analizaron muestras de agua para determinar contenido de sedimentos, nitro´geno disuelto total (NDT), fo´sforo disuelto total (PDT), ortofosfato (OP), nitro´geno en amonio (NH z 4 -N), y nitro´geno en nitratos (NO { 3 -N ). En ambos sitios la concentracio´n de NDT fue significativamente ma´s alta en aguas de escorrentı´a superficial que en el agua de riego aplicada (P , 0.05). En el Sitio 1, la concentracio´n de sedimentos y NDT fue significativamente ma´s alta en escorrentı´a superficial de agua de irrigacio´n que en el agua de riego (P , 0.05). Se observo´ un pulso inicial durante las primeras 3 h de escurrimiento superficial durante el riego en el Sitio 1 en el que la concentracio´n de nutrientes alcanzo´ valores ma´ximos. En el Sitio 2 la concentracio´n de sedimentos y PDT en aguas de escurrimiento superficial no fue significativamente (P , 0.05) ma´s alta que en el agua de riego aplicada, excepto en presencia de bovinos. La concentracio´n de sedimentos y NDT exportados por evento de riego fue 23,9 y 0,26 kg N ? ha 21 , respectivamente, y hubo una retencio´n neta de PDT de 0,04 kg P ? ha 21 . Se detecto´ N exportado en forma de amonio durante un evento de riego a razo´n de 0,15 kg N ? ha 21 . El N exportado en forma de nitratos fue mı´nimo o no pudo ser detectado. Una tormenta tardı´a de verano resulto´ en concentraciones de NDT y PDT en aguas de escurrimiento superficial que fueron 33 y 3 veces superiores, respectivamente, a las concentraciones en aguas de irrigacio´n. El NDT fue significativamente ma´s alto en aguas de escurrimiento sub-superficial que en el agua de riego aplicada (P , 0.05). Una mejora en la eficiencia de riego podrı´a prevenir muchos de los mecanismos de transporte de sedimentos y nutrientes observados durante este estudio.
Key Words: grass, grazing, irrigation, nitrogen, pasture, water quality
The use of trade, firm, or corporation names in this publication is for the information and convenience of the reader. Such use does not constitute an official endorsement or approval by the US Department of Agriculture or the Agricultural Research Service of any product or service to the exclusion of others that may be suitable.
At the time of the research, Ciotti was a research assistant in Environmental Sciences, Oregon State University, Corvallis, OR 97331, USA.
Correspondence: S. M. Griffith, National Forage Seed Production Research Center USDA–ARS, 3450 SW Campus Way, Corvallis, OR 97331, USA. Email: Steve.Griffith@ars.usda.gov Manuscript received 14 May 2008; manuscript accepted 19 December 2009.
Rangeland Ecol Manage 63:308–316 | May 2010 | DOI: 10.2111/08-127.1
INTRODUCTION
About 22% of the nonfederal land in the United States is rangeland (US Department of Agriculture Natural Resources Conservation Service [USDA NRCS]). Transport of nutrients and sediment from range and pasturelands is an environmental concern, particularly in the arid West where large portions of watersheds are utilized for cattle grazing, and especially when irrigation is involved. Transport of surface water pollutants may be accelerated where pastures are flood-irrigated. Protec- tion of and improvements to water quality requires identifica- tion of source areas and transport mechanisms of pollutants and distinguishing between natural and anthropogenic sources.
Pasture management practices including irrigation flow rates, fertilizer application, and animal stocking density influence the mobilization and transport of pollutants from flood-irrigated pasture (Schepers and Francis 1982; Bush and Austin 2001;
Cessna et al. 2001; Mundy et al. 2003). Sediment transport may result from disturbances caused by cattle. Owens et al. (1989) compared sediment concentrations from a catchment for 2 yr without livestock (0.8 g ? L 21 ), 3 yr with summer grazing only (1.3 g ? L 21 ), and an additional 6 yr grazing all year round (3.2 g ? L 21 ). Surface runoff from fertilized and irrigated dairy pastures contributes significant phosphorus (P) loads to water- ways (Bush and Austin 2001). Cessna et al. (2001) found concentrations of P in canals draining flood-irrigated and fertilized cropland to vary from 0.02 mg P ? L 21 to . 1.5 mg P ? L 21 but ammonium-N (NH z 4 -N) and nitrate-N (NO { 3 -N) concentrations were low. Spreading of cattle dung pats on pasture surface caused higher total P (TP) in irrigation surface runoff during the first irrigation event of the year and the load of nitrogen (N) in pasture surface runoff was more dependent on cattle density (Mundy et al.
2003). Few studies closely examined the water quality impacts of flood irrigation on unfertilized cattle pastures.
Approximately 14% of agricultural land in the Upper Klamath Lake watershed in southern Oregon is flood-irrigated cattle pasture (USDA NRCS 2005). Pastures are flooded about every 7 d to 14 d from April until October. Water draining from many of the pastures is returned to tributaries of Upper Klamath Lake. The Upper Klamath Lake subbasin was listed on the 1998 Oregon 303(d)1 list for dissolved oxygen, chlorophyll a, and pH (Oregon Department of Environmental Quality 2002). Irrigation surface runoff and drainage is identified as a nutrient source to Upper Klamath Lake (Rykbost and Charlton 2001). Upper Klamath Lake is considered naturally eutrophic with certain tributaries having relatively high background levels of P and sediment. The State of Oregon proposes to reduce phosphorus loads to Upper Klamath Lake by 40%. Alternative watershed and land use management strategies could reduce nutrient and sediment transport to Upper Klamath Lake (Gearheart et al. 1995; Anderson 1998).
Achieving designated beneficial uses for waterways requires determining the cause of impairment (Nelson et al. 1996; Lewis et al. 2006). An understanding of mobilization and transport of sediment and nutrients on pastures at the plot scale can indicate relative contributions from both background sources and from specific cattle and irrigation management practices, as well as assist in identifying potential management alternatives.
The objective of this research was to examine the spatial (above-, within-, and below-pasture) and temporal (seasonal)
patterns of water transport of sediment and nutrients on irrigated cattle pastures in the Upper Klamath Lake basin.
Pastures play a critical role in ranch enterprises and can make rangeland-based ranching profitable and add overall grazing flexibility. Here we report a surface water, sediment, and nutrient budget for two flood irrigation events on grazed cattle pasture. Comparisons of nutrient and sediment concentrations and physical water quality parameters were also made between irrigation inflow, surface runoff, shallow groundwater, and storm surface runoff from flood-irrigated pastures during 12 irrigations for two seasons, 2003 and 2004. The irrigation source water in this study was mostly unaffected by anthropo- genic inputs prior to being used for flood irrigation. This research provides a focused look at how cattle and irrigation management practices impact sediment and nutrient transport on small, unfertilized pasture plots (, 100 ha).
MATERIALS AND METHODS Site Description
The study sites were located in the Wood River Valley portion of the Upper Klamath Lake watershed in Klamath County, south-central Oregon. Elevation is 1 300 m with slopes ranging from 0% to 3%. The Wood River Valley is surrounded by steep mountain ridges of the Cascades to the north, east, and west, and by Agency and Upper Klamath lakes to the south. The climate is semiarid, with most precipitation occurring during the cold winter months. Average annual precipitation varies from 406 mm to 607 mm and average annual air temperature ranges from 5.5 uC to 6.7uC (USDA NRCS 1985). The Cascade Mountains feed the Wood River Valley with snowmelt and numerous spring-fed creeks.
Waterways throughout the valley are utilized for gravity-fed flood irrigation of cattle pasture. Cattle are usually brought into the valley by truck in April and grazed through October.
The pastures are irrigated about every 2 wk from April through September. Pastures are typically not chemically fertilized.
Primary sources of irrigation water include streams and springs flowing out of the Cascade Mountains. Most of the irrigation tailwater (surface runoff) flows to canals before emptying into Upper Klamath Lake. Dominant pasture grasses include Kentucky bluegrass (Poa pratensis L.), timothy (Phelum pretense L.), Baltic rush (Juncus balticus Willd.), Nebraska sedge (Carex nebraskensis Dewey), and a variety of Agrostis sp.
Woody species dominate riparian areas and the perimeter of the valley. The soils are volcanic in origin and poorly drained with a loamy A horizon over a sandy and gravelly loam B horizon. The soils are classified as Ashy-pumaceous, glassy, nonacid Typic Cryaquands (USDA NRCS 1985).
Site 1. In 2003, a 2-ha pasture study site located at
approximately lat 42 u719180N, long 122u069760W was sam-
pled. The area of the site was estimated from the surface wetted
perimeter during flood irrigation. The site was part of a fenced
pasture totaling 28 ha irrigated and stocked at 0.5 cattle ? ha 21 ,
which is moderate for the Wood River Valley. The irrigation
source was Sevenmile Creek, which flows out of the Winema
National Forest. The irrigation inflow water had limited
agricultural influence because it flowed primarily through
national forest land. Water samples were collected from Sevenmile Creek in the national forest and from the irrigation inflow diversion. The irrigation applications were controlled manually by a canal headgate. Flow was measured at inflow and surface runoff locations. The inflow volume was measured with a flow meter (122 cm top-set wading rod, JBS Instruments AquaCalc 5000—Advanced Stream Flow Computer and Pygmy meter). Irrigation surface runoff from the pasture was measured with two rectangular sharp-crested weirs at two swales at the bottom of the field where surface runoff concentrated (US Department of the Interior Bureau of Reclamation 1997). Surface runoff typically increased during the first 24-h period of irrigation inflow and then stabilized for the remaining hours. Water quality samples were taken during five irrigations from June 2003 through August 2003 and during one storm in September 2003.
Flood irrigations lasted for about 24–48 h. Irrigation inflow was sampled from canals at the point of irrigation diversion onto the field and surface runoff grab samples were collected directly from the pasture field surface before water flowed into irrigation tailwater ditches. About six pasture surface runoff samples were collected as surface runoff flow increased during the first 12 h of each irrigation, and two to three samples were collected after pasture surface runoff flow reached equilibrium.
A nutrient budget was estimated for Site 1 during the third and fourth irrigations. Shallow groundwater quality samples were also collected at a depth of 1–2 m.
Site 2. In 2004 the study was moved to a 70-ha fenced and irrigated cattle pasture (lat 42 u739220N, long 122u019020W) about 5 km northeast of study Site 1. It was stocked with 1.6 cattle ? ha 21 . The site was irrigated by water from Annie Creek, which flows out of Crater Lake National Park. This irrigation source water had little to no exposure to other irrigation surface runoff or cattle disturbance. All flows were measured with a flow meter. The 70-ha site was sampled from May 2004 through August 2004 during seven irrigations. Water samples were collected from inflow and surface runoff canals, from shallow groundwater, and from Annie Creek in the national park. Determining a water, sediment, and nutrient budget at Site 2 presented difficulties because of the mixing of irrigation inflow with surface runoff in ditches and the inability to measure all surface runoff. Only instantaneous loads were computed.
Sample Collection and Analysis
Surface water samples were collected as grab samples in 250- mL polyethylene bottles. Shallow groundwater samples were collected from polyvinyl chloride piezometer wells (5-cm diameter) along transects at both the 2-ha and 70-ha sites.
Wells were installed to a depth of 1–1.8 m. Bentonite clay was packed around the well from the surface down to 25 cm.
Groundwater samples were collected with a polyethylene tube and 250-mL syringe. Wells were pumped empty and allowed to refill to ensure that water samples represented actual soil water characteristics.
Water quality samples were filtered with 0.45-mm filters prior to chemical analysis. The filters were preweighed and oven-dried at 105 uC and sediment concentration was determined. NH z 4 -N and NO { 3 -N concentrations were determined by flow injection
colorimetry with a Lachat QuikChem 4200 analyzer. Total dissolved N concentration (TDN) was determined by chemilu- minescence with a Shimadzu total nitrogen (TN) analyzer. Total organic carbon (TOC) concentration was determined using a high-temperature catalytic combustion Shimadzu TOC-V ana- lyzer. Orthophosphate (ortho-P) was determined with flow injection analysis, colorimetric Lachat QuikChem method 10- 115-01-1-B. Total dissolved P (TDP) was determined with flow injection analysis colorimetry (potassium persulfate digestion) Lachat QuikChem method 10-115-01-4-S.
Data Analysis
All statistics were performed using Minitab version 14 software.
Multiple comparisons were made to determine significant differences between mean nutrient and sediment concentration for all sites using analysis of variance (ANOVA). Instantaneous sediment and nutrient loading rates were calculated for surface water samples by multiplying concentrations with flow volume at the time of sampling:
M~CV
where M is total mass in a volume V of water and C is the constituent concentration (Maidment 1993). Because nutrient and sediment concentration and irrigation flow were not measured continuously throughout the irrigation for the Site 1 budget, linear interpolation was used to estimate changes in load among known loading rates.
Export from surface waters during two irrigation events in 2003 was determined by the difference between the total mass of sediment and nutrients in the irrigation water inflow and surface runoff. Because a nutrient or sediment budget could not be estimated in 2004 we compared flow-weighted concentra- tions (FWC) for irrigation inflow and surface runoff canals.
FWC is an overall measure of water quality for a particular sampling site and the weight assigned to a nutrient concentra- tion is relative to the flow (Sether et al. 2004). FWC was computed for sampling sites by dividing the total of the constituent load measured at a sample site by the total of flow volumes measured at the sample site. Shallow groundwater concentration of nutrients was compared with surface water but the subsurface nutrient load was not estimated.
RESULTS Air Temperature and Precipitation
The mean air temperature for May through September during 2003 and 2004 was 15uC and 14uC, respectively. Total precipitation for May 2003 through September 2003 was 3.6 cm; it was 5.2 cm in 2004. Most precipitation events were less than 0.5 cm ? d 21 . On 9 September 2003, 2.6 cm of precipitation fell within a 24-h period. This was the only storm that produced surface runoff at the sampling sites during the 2003 and 2004 irrigation seasons.
Irrigation Water Quality
A two-sample t test was used to compare water quality
parameters between inflow and outflow for surface waters of
both study sites (Table 1). In comparing inflow and outflow chemistry, it was found for both sites that pH was significantly higher in the inflow water compared to the outflow and specific conductance higher only in the inflow at Site 2. Turbidity remained unchanged for inflow and outflow at both sites.
Nutrient and sediment concentrations were compared for irrigation source water and inflow and irrigation surface runoff for both study sites (Table 2). The irrigation inflow nutrient concentrations at both sites were similar to their respective irrigation source water nutrient concentrations. Nutrient concentrations were generally higher in the irrigation surface runoff, shallow groundwater, and storm surface runoff than in the inflow or irrigation source water sites and significant differences are presented (Fig. 1).
The highest concentrations of nutrients measured at Site 1 occurred early in the irrigation surface runoff period (Figs. 2 and 3). Nutrient concentrations were also higher in surface runoff during irrigations earlier in the season. It was found that TOC was not significantly (P . 0.05) different in surface or shallow ground water at either site. Mean surface runoff TDN and TDP concentrations were 31% and 51% higher, respec- tively, during the first three irrigations than they were during the fourth and fifth irrigations at Site 1. TDP in the inflow water was generally low during all irrigations. NH z 4 -N concentration in the surface runoff was higher than the inflow but did not follow a strong temporal pattern. Holstein dairy cows were stocked on Site 1 at a rate of 0.5 cows ? ha 21 ; the cows roamed across the plot during and after irrigation. The
extent of livestock presence was noted during sampling and was not associated with increased sediment or nutrients in irrigation surface runoff. The high nutrient concentrations at Site 1 occurred primarily in the surface runoff water during the rising limb of the surface runoff hydrograph. Site 1 had few bare soil spots and dense pasture growth on the field, which likely limited the soil disturbance caused by cattle or storm surface runoff.
Site 2 soil N content was 90% higher than that of Site 1. Site 2 also had a cattle stocking density three times higher. TDN concentrations were significantly higher in the irrigation surface runoff and shallow groundwater than they were in the applied irrigation water at Site 2 (P , 0.05; ANOVA). The highest NH z 4 -N and NO { 3 -N concentrations (1.01 mg N ? L 21 and 0.47 mg N ? L 21 , respectively) occurred in surface runoff from Site 2. The raw mean NH z 4 -N concentration in irrigation surface runoff was 2.6 times higher than irrigation source water at Site 1 and 7.7 times higher than irrigation source water at Site 2.
Mean TDP concentration in irrigation surface runoff at Site 1 was 0.15 mg P ? L 21 and was significantly higher than the applied irrigation TDP (0.08 mg P ? L 21 ; P , 0.05; ANOVA).
Site 1 had a TDP concentration of 0.05 mg P ? L 21 in the irrigation source water from Sevenmile Creek. At Site 2 the mean TDP concentration was 0.09 mg P ? L 21 and there was no significant difference between TDP concentration of irrigation runoff and the applied irrigation water. Overall mean TDP concentration in shallow groundwater was 0.06 mg P ? L 21 . Table 1. Summary of mean 6 SEM for turbidity, pH, and specific conductivity of water at irrigation inflow (point of diversion onto pasture) and outflow (surface runoff) from two study sites. Asterisks (*) indicate a significant difference between irrigation inflow and outflow for the respective site at P , 0.05 (two-sample t test). 1
Site Treatment Samples Turbidity (NTU) pH Specific conductance (mS)
1 Inflow 15 2.98 6 1.3 7.34 6 0.03* 0.055 6 0.003
Outflow 51 6.59 6 1.2 7.10 6 0.03 0.056 6 0.002
2 Inflow 25 4.96 6 0.3 7.63 6 0.13* 0.049 6 0.001*
Outflow 59 5.42 6 0.3 7.38 6 0.05 0.067 6 0.002
1
NTU indicates Nephelometric Turbidity Unit; mS, milli Semen.
Table 2. Summary of mean 6 SEM concentrations of sediment, TOC, 1 TDP, ortho-P, TDN, NH z 4 -N, and NO { 3 -N at source headwater creeks, inflow (point of diversion onto pasture), outflow (surface runoff), storm runoff (surface water), and groundwater (at about 1-m depth) from two study sites.
Asterisks (*) indicate a significant difference between headwater stream values and other locations at respective study sites at P , 0.05 (ANOVA).
Site Treatment Samples Sediment TOC TDN TDP NH z 4 -N NO { 3 -N Ortho-P
---mg ? L
21---
1 Sevenmile Creek 18 1.39 6 0.23 — 0.06 6 0.005 0.06 6 0.003 0.01 6 0.002 0.01 6 0.001 0.06 6 0.003
Inflow 16 13.69 6 3.47 10.06 6 0.878 0.12 6 0.029 0.08 6 0.006 0.03 6 0.002 0.03* 6 0.000 0.07 6 0.003 Outflow 58 16.54* 6 2.14 18.29 6 1.10 0.44* 6 0.042 0.15* 6 0.017 0.04 6 0.003 0.03* 6 0.000 0.13* 6 0.014 Storm runoff 5 5.46 6 1.03 35.12 6 2.26 2.01* 6 0.139 0.19* 6 0.022 0.10* 6 0.022 0.03* 6 0.022 0.05 6 0.000 Groundwater 32 — 23.92 6 2.19 0.52* 6 0.068 0.06 6 0.006 0.11* 6 0.016 0.03* 6 0.002 0.03 6 0.003
2 Annie Creek 17 42.42 6 16.88 — 0.10 6 0.025 0.03 6 0.001 0.01 6 0.002 0.02 6 0.002 0.03 6 0.001
Inflow 25 36.58 6 9.08 4.64 6 0.154 0.29 6 0.074 0.04 6 0.003 0.03 6 0.000 0.03 6 0.001 0.02 6 0.002 Outflow 59 23.96 6 2.14 14.37 6 1.107 0.96* 6 0.042 0.09 6 0.017 0.08 6 0.003 0.05 6 0.000 0.05 6 0.014
Groundwater 15 — 32.40 6 6.10 1.27* 6 0.271 0.07 6 0.009 0.10 6 0.011 0.04 6 0.006 0.02 6 0.004
1
TOC indicates total organic carbon; TDP, total dissolved phosphorus; ortho-P, orthophosphate as P; TDN, total dissolved nitrogen; NH
z4-N, ammonia-N; NO
{3-N , nitrate-N; and —,
constituent was below instrument detection limit.
Figure 1. Distribution of total dissolved phosphorus (TDP) and total dissolved nitrogen (TDN) from background (nearby headwater stream), inflow (irrigation water at point of diversion), outflow (irrigation surface runoff), storm runoff (surface water), and groundwater (at about 1-m depth) samples. Distribution is represented as a box (median, 25th, and 75th percentiles) and whisker (values within 1.5 times the difference between the 25th and 75th percentiles) and extreme values (asterisks) plot.
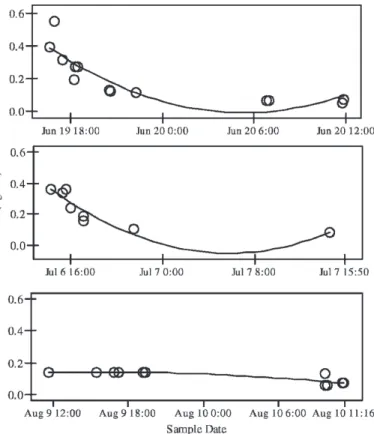
Figure 2. Concentration of total dissolved nitrogen (TDN) in surface water runoff during three irrigation events.
Figure 3. Concentration of total dissolved phosphorus (TDP) in surface
water runoff during three irrigation events for a 2-ha pasture (Site 1).
Both sites had soil test P below 50 mg P ? kg 21 and the soil was more likely a sink for P than a source.
Sediment concentrations were generally higher at Site 2 (Fig. 4). The maximum sediment concentration measured in this study was 257 mg ? L 21 from a headwater stream, Annie Creek, which provides irrigation source water to Site 2. Annie Creek flows out of Crater Lake National Park and has high sediment concentrations due to springtime and early summer snow melt. The raw mean sediment concentration in Site 2 irrigation inflow was higher (36.5 mg ? L 21 ) than in irrigation surface runoff (23.9 mg ? L 21 ). Site 2 had high sediment concentration in irrigation surface runoff only when cattle were present. The lower concentrations in the irrigation surface runoff likely occur because sediment deposits on the low- gradient pastures.
Site 1 irrigation source water is from Sevenmile Creek, which had a maximum sediment concentration of only 3.42 mg ? L 21 . The creek is fed primarily by springs from the Winema National Forest. The raw mean sediment concentration of irrigation surface runoff (16.5 mg ? L 21 ) from Site 1 was higher than the irrigation inflow raw mean concentration (13.7 mg ? L 21 ) and significantly higher than raw mean irrigation source water sediment concentration (P , 0.05; ANOVA).
Nutrient and Sediment Export from Irrigated Pasture
During the 23 July 2003 and 9 August 2003 irrigations, surface flow and surface sediment and dissolved nutrient export were estimated (Table 3). An attempt was made to estimate nutrient export in subsurface flow from the irrigation sites. Cuenca et al.
(1992) characterized the Klamath Basin as having a crop water requirement (ET crop ) for pasture of 196 mm and 155 mm for the months of July and August, respectively. Food and Agricultural Organization Penman–Montieth reference evapo- transpiration (ET o ) was determined from meteorological data at a weather station about 1 000 m east of the Site 1. Based on these data an average daily estimated reference ET was determined to be 5.0 mm ? d 21 and 4.5 mm ? d 21 for July and August, respectively. Based on these ET estimates the subsur- face runoff volumes were 19% and 4% of the headwater irrigation application during the July and August irrigations, respectively. Depth to groundwater was between 0.91 m and 1.52 m prior to the July and August irrigations and , 0.31 m during the irrigation. Lateral seepage to and from neighboring irrigated fields was not quantified. Assumptions were not made about the subsurface flow exchange onto and away from the study site so the subsurface portion of the overall nutrient budget was not estimated.
Figure 4. Distribution of sediment concentration from background (nearby headwater stream), inflow (irrigation water at point of diversion), outflow (irrigation surface runoff), and storm runoff (surface water) samples. Distribution is represented as a box (median, 25th, and 75th percentiles) and whisker (values within 1.5 times the difference between the 25th and 75th percentiles) and extreme values (asterisks) plot.
Table 3. Export and yield of sediment, TOC, 1 TDP, ortho-P, TDN, NH z 4 -N, and NO { 3 -N at study Site 1 during two irrigation events. Concentrations of NO { 3 -N and NH z 4 -N were undetected during certain irrigation events.
Irrigation date Site 1 Flow (m
3) Sediment DOC TDN NH z 4 -N NO { 3 -N TDP Ortho-P
---kg---
23 July 2003 Inflow 8 600 113.4 97.2 0.74 — — 0.48 0.48
Outflow 5 740 170.1 77.9 1.19 — — 0.45 0.43
Net outflow 22 860 56.7 219.3 0.46 — — 20.03 20.05
Yield (kg ? ha
21) — 28.3 29.6 0.23 — — 20.02 20.03
9 August 2003 Inflow 4 355 12.7 42.1 0.45 1.09 — 0.47 0.30
Outflow 3 093 51.9 42.4 1.03 1.39 — 0.36 0.22
Net outflow 21 262 39.2 0.4 0.58 0.30 — 20.11 20.08
Yield (kg ? ha
21) — 19.6 0.2 0.29 0.15 — 20.06 20.04
1
TOC indicates total organic carbon; TDP, total dissolved phosphorus; ortho-P, orthophosphate as P; TDN, total dissolved nitrogen; NH
z4-N, ammonia-N; NO
{3-N, nitrate-N; and —, constituent
was below instrument detection limit.
The surface irrigation surface runoff was 67% and 71% of inflow volume. There was a mean yield of 24 kg ? ha 21 of sediment and 0.26 kg N ? ha 21 of TDN per irrigation. Export of NH z 4 -N occurred only during the 9 August irrigation and was undetected in the 23 July irrigation. NO { 3 -N was undetected during both irrigation events. There was a small net retention of TDP and ortho-P. Because this nutrient budget does not include export from subsurface flow or the particulate fraction of the P or N, it does not provide a complete nutrient budget for the site. The export of sediment during both irrigations indicates that the particulate forms of both N and P exported from the site may be considerable. TDN in subsurface samples was high and likely contributed to the overall N budget whereas TDP concentration in subsurface samples was low and would likely have a minimal contribution.
Site 2 topography did not allow for accurate measurement of all irrigation surface runoff so only FWCs were computed at Site 2. The raw mean FWC for all nutrients were higher in the irrigation surface runoff than in inflow (Table 4). FWC of TDP in irrigation surface runoff was typically around 0.06 mg P ? L 21 . The raw mean FWC of sediment in the irrigation inflow at Site 2 was higher than that measured in the surface runoff.
On two occasions the sediment FWC in irrigation surface runoff increased from about 12.5 mg ? L 21 to 51.3 mg ? L 21 at Site 2. Cattle were observed in canals during these occasions.
Water Quality of Storm Runoff
The only storm to produce surface runoff during the study period occurred on 9 September 2003. Both TDN and TDP in the storm surface runoff were high (2.01 mg N ? L 21 and 0.19 mg P ? L 21 , respectively) relative to most other surface samples. Most of the TDP and TDN were organic. The storm surface runoff was sheet flow and did not produce enough flow volume to measure at the Site 1 weir. Sediment concentration in the storm surface runoff at Site 1 was low (5.46 mg ? L 21 ).
DISCUSSION
Transport of pollutants from Site 1 occurred from excess surface water flow off the pasture during irrigation. The mobilization and transport of dissolved nutrients may occur as surface runoff first flows over the pasture and nutrients diffuse into the surface runoff water (Bondurant 1971; Fraser et al.
1994). Mundy et al. (2003) observed that cattle stocking density influenced N and P concentration in irrigation water only for the first irrigation and that subsequent irrigations had similar N and P in surface runoff regardless of stock density.
This is likely due to the time needed for accumulation and mineralization of organic matter from soil, vegetation, and livestock waste between irrigations. As the irrigation season continues and surface runoff is frequent there is less easily mobile material for transport (Fitzsimmons et al. 1972). This seems to be particularly true if total pasture coverage is maintained, as was the case for Site 1 in this study. Dissolved nutrient concentrations were lower during the Site 1 August irrigations than they were in June and July. The decrease in dissolved nutrients in irrigation surface runoff may also be attributed to increased biological uptake later in the summer.
Site 2 provided easier access to canals and bare soil spots for cattle, resulting in nutrient and sediment pulses in irrigation surface runoff throughout the season.
At Site 1 the irrigation efficiency was low and about 70% of applied irrigation water was surface runoff. Improved irriga- tion efficiency would likely reduce sediment and NH z 4 -N export because they were variable throughout the entire surface runoff period. Because a majority of the dissolved N and P loss occurs at the beginning of the surface runoff period, a reduction of dissolved N and P export would likely be small unless efficiency was improved considerably. Heathwaite et al. (2000) found that strategies for controlling N and P surface runoff often differ and may be in conflict where a reduction in P surface runoff may result in increased nitrate leaching. If surface runoff is reduced during irrigation, then TP loss is reduced (Sharpley and Syers 1976; Thorrold et al. 1999).
Sharpley et al. (2000) found that areas controlling a majority of P transport are from a limited part of the agricultural landscape. At Site 1 the source of dissolved P appears to be from organic matter decomposition from the overall pasture surface.
The results from the 2003 and 2004 subsurface water quality were similar. The TDP concentration in the subsurface was low relative to surface water TDP. Evangelou (1998) found that unlike N, the excretion of P occurs largely in cattle feces and not in the urine that often leaches into the soil. Dissolved P concentrations in subsurface runoff may also be low because P tends to bind with P-deficient soil particles (Sharpley et al.
2001). Sharpley et al. (1996) found that 9% of P applied to a field was lost in surface runoff and less than 1% in subsurface runoff.
Inorganic N made up about 25% of the TDN concentration in the subsurface water. NH z 4 -N was the primary inorganic N form; NO { 3 -N was not detected. Increased water supply in high N content areas such as urine patches can lead to nitrate leaching and N in urine is often readily available to plants because urea is quickly hydrolyzed into NH z 4 -N and NO { 3 -N Table 4. Mean flow-weighted concentrations of TOC, 1 TDP, ortho-P, TDN, NH z 4 -N, and NO { 3 -N at inflow (point of irrigation diversion) and outflow (irrigation surface runoff) locations at study Site 2, a 70-ha cattle pasture.
Site 2 Samples Flow (L ? s
21) Sediment TOC TDN TDP Ortho-P NO { 3 -N NH z 4 -N
--- mg ? L
21---
Inflow 16 129.86 36.55 4.56 0.35 0.03 0.02 — —
Outflow 41 27.09 29.87 12.44 0.90 0.09 0.04 0.02 0.07
1