Empirical Analyses of Grazing Distribution
General relationships have been observed between habitat char- acteristics and patterns of grazing use. Abiotic factors such as slope and distance to water can constrain grazing use of some areas (Senft et al. 1987, Smith 1988). Biotic factors such as species composition, plant morphology, productivity, and forage quality also affect grazing distribution. Large herbivores usually allocate time spent in diierent areas of a pasture or habitat based on the resource levels found there. Senft et al. (1987) applied the term “matching” to this proportional relationship between the time an animal spends in plant communities or large patches and the available quantity of nutrients. Matching is an aggregate response pattern that has been observed in several species includ- ing bison, cattle, feral horses, mule deer, sheep, and wapiti (Hunter 1962, Coppock et al. 1983, Duncan 1983, Hanley 1984, Pinchak et al. 1991). Senft et al. (1985a) described a matching response pattern in which the preference by cattle for plant com- munities could be predicted from relative quantities of preferred species and nutrient abundance.
Multiple regression and other models have been used to predict grazing distribution patterns (Cook 1966, Senft et al. 1983, Gillen et al. 1984, Smith 1988), but success of these models has varied.
Relationships between distribution patterns and environmental characteristics vary from location to location. Abiotic effects such as slope and distance to water are usually consistent and can be predicted more reliably than biotic factors. Many regression mod- els describe only the conditions at a particular site and cannot be transferred to other sites (Senft et al. 1985a). Regression models are limited by simplifying assumptions and do not consider actual mechanisms of foraging (Coughenour 1991).
Management practices have been used successfully to improve grazing distribution. Practices such as water development (Valentine 1947, Cook 1966), placement of salt and supplement (Cook 1967), and fertilizer application (Hooper et al. 1969) can be used to enhance grazing by livestock and wildlife in undemti- lized areas. Herding and riding can be used to reduce concentra- tions of animals and introduce livestock to areas formerly receiv- ing little use (Skovlin 1957). Many benefits attributed to grazing systems are the result of improved grazing distribution (Laycock 1983). Often fences are constructed and water is developed when grazing systems are implemented which increases the uniformity of grazing. Hart et al. (1993) showed that decreasing pasture size and reducing distance from water were more important for improving forage utilization patterns than implementing intensive rotational grazing systems.
Scale and Foraging Hierarchies
Identifying Spatial Patterns Significant to Large Herbivores Large herbivores clearly react to spatial patterns in topography and forage distribution, but we have a limited understanding of the relative importance of landscape elements that occur on dif- ferent spatial scales. The confusion that surrounds the identitica- tion and interpretation of spatial patterns has resulted in part from differences in the objectives of range scientists, population ecolo- gists, and landscape ecologists. Thus, an essential task is to link spatial attributes to specific biological functions (Turner 1989).
To do so, heterogeneity needs to be defined by identifying envi- ronmental variance that results in a change in the function of interest (e.g., intake rate, movement rate, etc.). Different levels
within a hierarchy of behaviors can be defined using differences in the rate of a behavior or process at different spatial and tempo- ral scales (Table 1; Senft et al. 1987, Kotliar and Wiens 1990, Kolasa and Rollo 1991). This functional heterogeneity can also be used to distinguish between spatial elements at the same level by a change in the rate of the function.
Functional heterogeneity differs from statistical heterogeneity primarily because it is scaled to the species and process of inter- est. The distinction between statistical and functional heterogene- ity can be made clear by considering the definition of a patch. For a foraging herbivore, a patch can be defined as a spatial aggrega- tion of bites over which intake or movement rate remains rela- tively constant over a short period (e.g., 30 seconds). Thus, a patch might consist of a homogeneous area of grass, 1 shrub, or a group of shrubs in close proximity to each other. This definition differs from those frequently used in studies of herbivores (Astrom et al. 1990, Lundberg and Danell 1990) by focusing on the process first, and using the process to describe the spatial scale of interest. Often a patch is defined before the study and is assumed to be a specific aggregation of forage (a tree, bush, or area of grass).
Kotliar and Wiens (1990) suggested a hierarchy of patch struc- tures. A grain was defined as the smallest unit to which an animal responded, and patches were built on successively higher levels.
Patches are distinguished from each other or a background matrix by their contrast, and higher-level patches have characteristic lev- els of aggregation of grains (or lower-level patches). For studies of herbivores, a grain would consist of a single bite, a first-order patch would consist of a group of bites, and a second-order patch a group of first-order patches. Thus, a first-order patch could be a single bunch-grass or shrub, or it could consist of many grasses and/or shrubs.
Hierarchy theory provides a conceptual framework for linking spatial attributes to biological functions at 1 or more scales (Senft et al. 1987), but this approach requires quantitative techniques to identify spatial properties of landscapes. Turner et al. (1991) pro- vided an extensive review of statistical procedures used in land- scape ecology, dividing methods into 2 broad categories. The first category includes techniques to detect the scale(s) over which a repeating pattern occurred. These techniques are generally based on variance measures, and include the use of blocking, auto-cor- relation, spectral analysis, and trend surfaces. The second catego- ry addresses methods for patterns that are irregular or may not be repeated. These techniques are used to assign square grid cells on a map to a particular patch (or group) of similar cells, and rely on changes in 1 or more characteristics across cell edges. Cullinan and Thomas (l992) tested 10 techniques for detecting an appro- priate scale for measurement or for detecting landscape hetero- geneity. Patch size was consistently estimated by only 2 tech- niques, Hills Method (Hill 1973) and Correlation versus Transect Length Segment (Carlile et al. 1989), and scale by one, Spectral Analysis (Ripley 1978). The authors concluded that no single measure is likely to capture all the important spatial attributes of a landscape, and multiple techniques are necessary for examining landscape elements.
Foraging Scale Definitions
For this discussion, we identify the following 6 spatial scales for large herbivores in a foraging hierarchy: bite, feeding station, patch, feeding site, camp and home range (Table 1). Each scale is
JOURNAL OF RANGE MANAGEMENT 49(5), September 1996 387
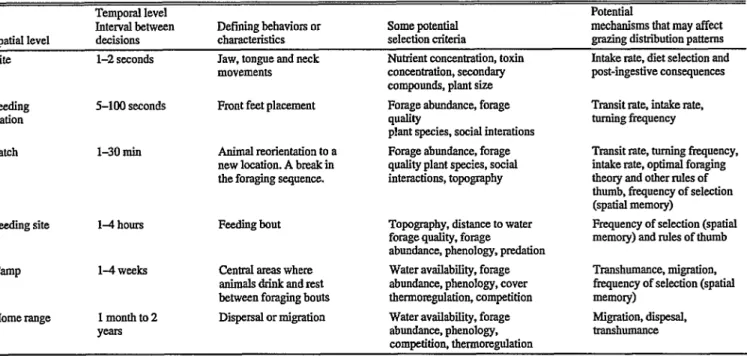
Table 1. Attributes of spatial and temporal scales used in this discussion to describe large-herbivore foraging. Each level are units that large herbi- vores may select among.
Spatial level
Temporal level Interval between decisions
Defining behaviors or characteristics
Some potential selectibn criteria
Potential
mechanisms that may affect grazing distribution patterns
Bite l-2 seconds Jaw, tongue and neck
movements
Nutrient concentration, toxin concentration, secondary compounds, plant size
Intake rate, diet selection and post-ingestive consequences
Feeding station
S-100 seconds Front feet placement Forage abundance, forage W-Y plant species. social interations
Transit rate, intake rate, turning frequency
Patch l-30 ruin Animal reorientation to a
new location. A break in the foraging sequence.
Forage abundance, forage quality plant species. social interactions, topography
Transit rate, turning frequency, intake rate, optimal foraging tbmy and other rules of thumb, frequency of selection (spatial memory)
Feeding site 14 hours Feeding bout Topography, distance to water
forage quality, forage
abundance, phenology, predation
Frequency of selection (spatial memory) and roles of thumb
CamP
Home range
14 weeks
1 monthto Y-
Central areas where anhualsdrinkandrcst between foraging bouts Dispersal or migration
Water availability, forage abundance, phenology, cover thermomgulation, competition Water availability, forage abundance, phenology.
competition, tbermorcgulation
Transhnmance, migration, frequency of selection (spatial memory)
Migration, disposal, uanshumance
functionally defined based on characteristic behaviors that occur at different rates. These levels are associated with different tits of space that vary in absolute dimension with the body size and foraging strategy of the herbivore. The smallest scale is a bite and is clearly defined by a sequence of herbage prehension, jaw and tongue movements, and severance by head movement (Laca et al.
1994b). Novellie (1978) defined feeding station as an array of plants available to a herbivore without moving their front feet. As discussed above, patch has been described many ways. Here, we define patch in a manner similar to Jiang and Hudson (1993). A patch is a cluster of feeding stations separated from others by a break in the foraging sequence when animals reorient to a new location. A feeding site is a collection of patches in a contiguous spatial area that animals graze during a foraging bout; it may con- tain 1 or more plant communities. Foraging bouts are defined by a change in behavior from grazing to resting, ruminating or behaviors other than foraging. A camp is a set of feeding sites that share a common foci where animals drink, rest, or seek cover. Typically, movements between camps involve the whole social unit and may occur every few weeks. Home ranges are col- lections of camps and are defined by fences, barriers, extent of migration, or traushumance. In some pastures and in other situa- tions, there may be only 1 camp within a home range.
Although the scales described here are based on functional def- initions and do not correspond to scales based on soil types, assemblages of plant populations, and geomorphic features, there are some similarities to the hierarchical scales presented by Senft et al (1987). Camps and home ranges refer to behaviors and units of selection that occur within a regional scale, while patches, feeding sites, and camps refer to behaviors and units of selection that occur within a landscape scale. Bites, feeding stations, and patches refer to behaviors that Senft et al. (1987) classified as occurring at plant community scales.
Consequences of Foraging Decisions at Different Temporal and Spatial Scales
Foraging decisions at broader spatial and temporal scales can constrain choices at lower levels. For example, animals must decide where to begin grazing at the beginning of a bout. This decision has few consequences if the home range or pasture is small because the entire area is readily accessible. However, this decision limits the potential number of smaller scale choices if the home range or pasture is large. Distant plants and patches are not available during the current bout because of geographic isola- tion. Distant vegetation may not be visible, and animals would incur energetic costs for travel to other feeding sites. At a smaller scale, selection of a feeding station limits the potential number of plants that an animal may select. The herbivores must search and move if plants within the chosen feeding station are rejected.
However, energetic costs required to move from 1 feeding station to the next are usually small and the consequences of selecting a feeding station are also small. Higher level decisions have poten- tially greater impacts to herbivores since they occur infrequently and can constrain lower level processes (Senft et al. 1987).
Consequences of lower-level behaviors may be used to develop expectations of alternatives at higher levels. As animals forage, they make frequent decisions at lower levels (Table 1). For exam- ple, Scamecchia et al. (1985) reported that cattle consumed between 14,000 and 33,000 bites per day. Memory required to remember each bite or feeding station would be excessive.
Herbivores must integrate information from lower level behaviors (bites, feeding stations, and patches) if they are to use those expe- riences to evaluate spatial alternatives at higher levels (feeding sites, camps, and home ranges). Herbivores may use intake rates or post-ingestive consequences (Provenza and Cincotta 1993, Provenza 1995) to integrate information obtained through diet selection.
388 JOURNAL OF RANGE MANAGEMENT 49(5), September 1996
Foraging Mechanisms
We define a foraging mechanism here as a process or processes by which an aggregate grazing pattern occurs. There is an array of possible behaviors that may result in grazing distribution pat- terns that have been observed over landscapes and regions.
Foraging models often use rules as mechanisms for predicting grazing patterns. Abiotic or non-interactive factors often act as constraints and modify grazing response patterns (Senft et al.
1987). Body size, visual acuity, memory, and other factors can limit the possible processes that herbivores may use during forag- ing. Alternative foraging mechanisms and the constraints imposed by animal characteristics and abiotic factors are described below.
Non-cognitive Mechanisms
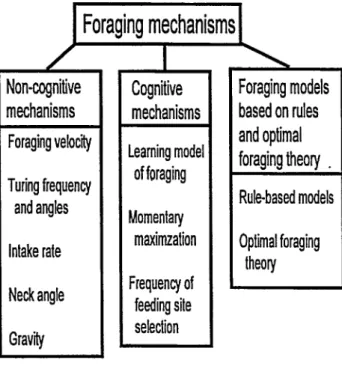
The following mechanisms do not require large herbivores to use memory during foraging, and they require little judgement from the animal (Fig. 1). These parsimonious mechanisms, how- ever, could result in observed grazing patterns when aggregated over a period of time.
Foraging Velocity. The rate at which herbivores transit differ- ent portions of a landscape could affect aggregate grazing pat- terns. Slower movement through areas of greater nutrient abun- dance would ensure that herbivores spend proportionally more time in nutrient rich areas (ie., matching pattern). Wickstrom et al. (1984) reported a nonlinear decline in movement rate of elk and deer as forage abundance increased. Sheep spend less time at feeding stations with little palatable forage (Ruyle and Dwyer
1985), indicating a faster foraging velocity. Animals move more slowly through areas with more abundant nutrients because they spend more time biting than moving, and it may take them longer to process the more abundant forage (Laca et al. 1994a). Bailey (1988) reported that biting rate was greater and that cattle spent
) Foraging mfehanisms I
4onqnitive nechanisms
‘oraging velocity Turing frequency
and angles
.
1' \
Cognitive mechanisms
Foraging models based on rules and optimal foraging theory . Rule-based models
intake rate Neck angle Gravity
-earning model of foraging Momentary
maxirnzation Frequency of
feeding site selection
Optimal foraging theory
Fig. 1. Organization of foraging mechanisms.
JOURNAL OF RANGE MANAGEMENT 49(5), September 1996
less time with their head up when foraging velocities were lower.
When palatable plants are apparent by contrast with other vegeta- tion, bighorn sheep move to the nearest plant (Gross et al.
1995b). In such cases, herbivores should move slower through areas with higher densities of palatable plants. This foraging velocity mechanism may be more important where forage abun- dance varies greatly across the landscape (Mastel 1987). Bailey (1988) found that small changes in forage abundance (27%) did not affect foraging velocity of cattle when they had access to only one level of forage abundance at a time. However when cattle had a choice between 2 patches that differed in herbage mass by 50%, they grazed 3.5 times longer in the better patches (Laca et
al. 1993).
Turning Frequency and Angles. When no environmental cues are obvious, spatial patterns in foraging may result because ani- mals respond to patterns of forage availability by changing tum- ing angles and turning frequency (Bell 1991, Smith 1974). If ani- mals turn more often in nutrient-rich patches or feeding sites as suggested by Crawley (1983), their twisting grazing pathway would result in proportionally more time spent in the nutrient-rich area. In a nutrient-poor area, however, the path would be less tor- turous, and animals would soon transit the area. This proposed turning frequency mechanism, however, conflicts with observed ungulate behavior (Senft et al. 1987, Ward and Saltz 1994).
Ungulates often follow topographic contours while foraging (Arnold and Dudzinski 1978) and rarely turn at an angle of more than 60 degrees (Allen and Hoekstra 1992). Typically, grazing animals form herds and the extent that an individual turns while foraging may be restricted by other animals. within the herd.
Turning upon an encounter with a desirable food while in a herd may result in exploration of areas already depleted by con- specifics, or it may cause an antagonistic response by neighbors (Thouless 1990).
Intake Rate. Intake rate is another explanation for observed grazing patterns since it is at least indirectly related to forage availability (Forbes 1988). Higher intake rates that occur in nutri- ent-rich areas could account for the increased use predicted by the matching pattern for more productive sites. Under most graz- ing situations, short-term intake rate will be controlled primarily by bite size, which is not always related to forage biomass (Laca et al. 1992, Spalinger and Hobbs 1992, Gross et al. 1993a, 1993b). Penning et al. (1994) found that grass swards with simi- lar heights but different structures (eg., leaf to stem ratios) result- ed in different intake rates and bite sizes. Although instantaneous intake rate varies and may be limited by forage availability, total daily intake may not be affected to the same extent. Within limits, herbivores can compensate for a low short-term intake rate by increasing grazing time, thereby maintaining daily intake (Allison 1985, Demment and Greenwood 1988).
Neck Angle. Changes in neck angle may provide a stimulus to initiate small scale movements between feeding stations (Jiang and Hudson 1993). As animals reach away from their forefeet, the shift in balance may trigger locomotion and selection of a new feeding station.
Slope. Slope gradient is an important determinant of grazing distribution of large herbivores. Animals probably recognize changes in slope and use that information to remain on contours or to minimize changes in elevation while foraging. Several large herbivores such as cattle generally avoid grazing slopes over 10%
(Mueggler 1965, Cook 1966).
369
Cognitive Mechanisms
Cognitive processes may affect behaviors that occur at small and large scales. Learning and memory have been shown to affect diet selection and may be important in selecting feeding sites.
The mechanisms discussed in the following section differ from the others in that they are based on learning and memory.
However, they may include processes and learning that are non- cognitive.
Learning Model of Diet Selection. Diets selected by herbi- vores are affected by post-ingestive feedback from nutrients and toxins (Provenza and Cincotta 1993, Provenza 1995). Herbivores associate food items with their nutritional consequences and track temporal changes in forage quality and toxin concentration. By using negative feedback, large herbivores can develop a condi- tioned aversion to novel food paired with a toxin (Burritt and Provenza 1991). Sheep can also associate positive nutritional consequences with specific foods. Lambs strongly preferred fla- vors paired with glucose to flavors paired with saccharin, a non- nutritive sweetener, even though initial preferences for glucose and saccharin were equal (Burritt and Provenza 1992). Provenza and Cincotta (1993) proposed a learning model of foraging based on a sampling and evaluation process referred to as hill climbing (Staddon 1983). Hill climbing can be explained by a simile of a blind man trying to reach the top of a hill. He samples a direction to step. If it is down or level, he tries a new direction. However, he steps in that direction if it is up. The learning model of forag- ing uses a similar process where animals learn to select diets through sampling, post-ingestive consequences, and learning.
Foods with adverse post-ingestive consequences are avoided, and foods with positive-ingestive consequences are selected. This for- aging model may or may not result in an optimal diet. Local max- ima, positive feedback traps, and incomplete information may prevent animals from learning to select optimal diets.
Momentary Maximization. Momentary maximization is a mechanism that can explain diet selection and movement along the grazing pathway (Senft et al. 1987). Momentary maximiza- tion is similar to hi climbing in that it assumes animals select the best available alternative at any given time (Staddon 1983, Provenza and Cincotta 1993). The most palatable plants or plant parts that are within reach are selected until palatability of remaining forage within the feeding station decreases to a thresh- old value. Animals then move to a new feeding station.
Palatability in this mechanism is learned from maternal observa- tion, peer interaction, and post-ingestive consequences (Provenza 1995) and is a function of forage quality and secondary com- pounds. The threshold is based on physiological-state and recent experience. The threshold of acceptance changes according to the palatability of plants encountered recently, presumably during the last few bouts. As animals encounter high quality plants, the threshold increases, and animals select higher quality diets. The threshold decreases as lower quality items are encountered. Thus, within 1 or 2 days, the threshold should drop so that herbivores maintain a minimum level of intake even if forage quality drops rapidly. Sheep select higher quality diets if they are not fasted (Edwards et al. 1994, Newman et al. 1994) or if they have recent- ly consumed high quality food (Jung and Koong 1985). The effect of recent experience on foraging selectivity has been demonstrated in starlings (Cuthill et al. 1990), chipmunks and squirrels @evenport and Devenport 1994), and bumblebees (Real 1991).
Optimal foraging patch residence models (Charnov 1976) also rely on a threshold value to determine when an animal should move based on the marginal value theorem. Animals should move to a new patch in marginal value theorem models when the marginal intake rate decreases below the average intake rate.
Marginal intake rates of all available patches witbin a habitat are used to obtain the average intake rate threshold. However, momentary maximization models use only information obtained from recently visited areas to determine a threshold.
Frequency of Patch and Feeding Site Selection. Large herbi- vores first must decide where to begin grazing at the beginning of each bout. In large pastures, the location of cattle near sunrise was found to be a good indicator of where a cow did most of its grazing during a 24hour period (Low et al. 1981). Bailey et al.
(1989b) suggested that herbivores may return to nutrient-rich pro- ductive patches and feeding sites more frequently than to less productive patches and feeding sites. Over a period of a few weeks or months, animals would spend proportionally more time at productive sites since they graze there more often than at poor sites.
Most foraging behavior studies have examined foraging deci- sions and behaviors that occur within a bout. Few studies have examined day to day (or bout to bout) movement patterns of large herbivores. Bailey et al. (1990) observed tbe location of cattle in relatively homogeneous pastures for periods of 5 to 42 days. Day- to-day movement patterns were not random, and the location of cattle during the early morning period was dependent on their location during the previous morning. Cattle were rarely observed in the same location for more than 2 consecutive days. Usually, they moved to an adjacent section of the pasture the following day. Apparently animals can remember and avoid undesirable areas. Bailey (1995) reported that cattle in a heterogeneous area did not return to a feeding site with lower forage quality for 21 consecutive days and alternated among the remaining 2 feeding sites with higher quality forage. These studies suggest that the frequency with which large herbivores select feeding sites may be an important factor in determining grazing distribution patterns.
The frequency of patch and feeding site selection mechanism assumes that animals can distinguish and remember relative dif- ferences in nutrient levels among different patches and/or feeding sites. This requires a long term memory because animals may not return to an area for days or weeks. Another assumption is that animals can remember where they grazed for at least a few hours (short term memory) so they can avoid recently depleted patches.
Foraging Models Based on Rules and Optimal Foraging Theory
Rule-based Models. Grazing mechanisms in some foraging models assume that the search for patches is random (Mime et al.
1992), while other models use simplistic rules for locating patch- es and feeding sites within the animal’s habitat. Suitability, dis- tance from other patches, presence of other animals and the time since the last visit were 4 rules used by Hyman et al. (1991) to direct herbivore movements in a spatially explicit foraging model. Turner et al. (1993) also developed a spatially explicit model in which large ungulates moved among sites based on 1 of 3 rules. Each rule assumed different cognitive abilities of the herbivore. The simplest rule was to move to the best adjacent site.
The other rules were move to the nearest site with available resources and move in the best direction for the overall availabili-
390 JOURNAL OF RANGE MANAGEMENT 49(5), September 1996
ty of resource sites. Turner et al. (1993) reported that any rule would suffice if resources were abundant. If resources were scarce, discerning and moving to sites with higher resources reduced mortality. The second and thiid rules required herbivores to visually detect differences in sites that were distant from their present location. Importantly, there was little evidence to support the use of any one of these rules over another.
Optimal Foraging Theory. Optimal foraging theory (Schoener 1971, Pyke 1984) provides a functional approach for examining grazing behaviors, including diet selection, patch selection, and movements. Optimal foraging theory generally assumes that ani- mal fitness is related to foraging behavior, foraging behaviors are heritable, and that a currency (e.g., energy, protein) can be identi- fied to link foraging behavior with fitness (Pyke 1984).
Relatively few optimal foraging theory studies have focussed on herbivores, primarily because of complications imposed by diges- tive constraints and the difficulty in defining discrete food items or quality. Belovsky’s linear programming models (Belovsky 1978, 1981) provided one of the first approaches for incorporat- ing the multiple constraints faced by herbivores. Linear program- ming made clear the importance of digestive constraints and the tradeoffs related to forage characteristics. However, the actual solutions produced by Belovsky’s linear models resulted from bulk limitation constraints based on water content (a pivotal com- ponent of these models) that is not consistent with empirical stud- ies of intake of large herbivores (Hobbs 1990, Huggard 1994).
Other forms of optimal foraging models have been less suc- cessful in quantitatively predicting diet selection by herbivores (Westoby 1974, Owen-Smith 1979, Stenseth and Hansson 1979, Owen-Smith and Novellie 1982), but the qualitative predictions of these models focussed attention on mechanisms that lead to observed behavior patterns. More recent optimal foraging theory models have failed, in part, because we simply do not understand the plasticity in what have traditionally been considered static constraints. Owen-Smith (1993a, 1993b, 1994) found that forag- ing behaviors of kudus were highly elastic, and increases in digestive capacity coupled with increased feeding activity largely compensated for seasonal declines in forage abundance. Static foraging models have difficulty coping with short-term changes in constraints such as gut fill, ingested food toxins, physiological state, and location (e.g., predation risk, proximity to water, etc).
Stochastic dynamic programming (Mange1 and Clark 1986) may offer a technique for incorporating multiple, interacting con- straints, and provide a means for expressing these diverse con- straints in a “common currency”. This modelling technique per- mits the analysis of behaviors that respond to forage and environ- mental conditions, animal physiological state, and predation risk over short and long time periods. Newman et al. (1995) used sto- chastic dynamic programming to investigate diet selection and daily intake by combining a simple mechanistic model of forage intake and digestion with an optimal foraging theory approach.
They developed their stochastic dynamic programming model for sheep grazing on a sward consisting of grass and clover and showed that a variety of behaviors could result from relatively small changes in environmental conditions. They predicted a mixed diet of grass and clover, with the proportions of each com- ponent changing within a day. The Newman et al. (1995) model predicted that even a small predation risk would influence forag- ing behavior. Predictions of this stochastic dynamic programming model were consistent with observations of sheep, and accounted for behaviors not adequately explained by highly detailed, purely
mechanistic models (Thomley et al. 1994, Parsons et al. 1994). If simple models can be formulated, stochastic dynamic program- ming may provide an new approach for examining large-scale foraging decisions with short and long-term consequences.
Patch selection and patch residence time by herbivores has been examined using approaches based on the marginal value theorem (Chamov 1976). Laca et al. (1993) showed that cattle optimized intake rates from patches that varied in height and spacing, consistent with marginal value theorem predictions.
Cattle modified patch residence time in response to a factorial combination of 3 patch heights and 3 interpatch distances. Distel et al. (1995) observed that cattle selected feeding stations where intake rate was higher, and time allocated to various feeding sta- tions was at least qualitatively consistent with marginal value the- orem predictions. Jiang and Hudson (1993) reported that elk left a patch when short term cropping rates declined which is consistent with marginal value theorem predictions, and they also suggested that decisions of elk to leave feeding stations are based on differ- ent rules than decisions to leave patches. Wihnhurst et al. (1995) predicted that elk would prefer patches with intermediate herbage availabilities using optimal foraging models. The application of marginal value theorem and other optimal foraging theory approaches to herbivore foraging depends critically on identify- ing an appropriate scale and currency, but little information is available to guide these decisions.
Optimal solutions to foraging problems are usually assumed to be implemented by rules-of-thumb because animals are con- strained in their ability to obtain and process information (Janetos and Cole 1981, Real 1991, Ward 1992). Rules-of-thumb provide solutions that are “optimal with constraints”, where the time or effort to obtain information is prohibitive. Simple mles-of-thumb frequently result in foraging decisions very similar to complex,
“optimal” solutions (Green 1984, Gross et al. 1995b). For exam- ple, Ward and Saltz (1994) predicted that gazelles should select plants with more and larger leaves than randomly available and that they should concentrate foraging activity in areas with higher plant densities.
Identifying how animals would implement solutions determined by optimal foraging models is important because often the under- lying behavioral mechanisms are poorly conceptualized (Senft et al. 1987). Mechanistic models attempt to identify the molecular processes that result in molar patterns. If the underlying behav- ioral mechanisms were known, robust models could be developed that predict grazing distribution patterns over a variety of land- scapes. Understanding the underlying behavioral mechanisms would also improve our ability to develop new, innovative man- agement practices for modifying grazing distribution patterns.
Constraints Imposed by Herbivore Abilities
Spatial Memory. Spatial memory is a critical assumption of the patch and feeding site selection mechanism discussed above and is essential when patches of food are distant or when topogra- phy and vegetation structure impede the use of visual and olfacto- ry cues. A simulation study by Benhamou (1994) showed that spatial memory would improve foraging efficiency of desert arthropods. Field studies using harvester ants (Johnson 1991) and fish (Noda et al. 1994) also suggest that spatial memory is used to improve foraging efficiency. Spatial memory which can last for more than 20 days, also increases the foraging efficiency of cattle (Laca 1995) and deer (Gillingham and Bunnell 1989). Spatial
JOURNAL OF RANGE MANAGEMENT 49(5), September 1996 391
memory has been incorporated into models that predict animal Working and reference spatial memory are useful at different movements during foraging (Saarermraa et al. 1988, Folse et al. levels of selection. Working memory can be important at feeding 1989). These models simulate how large herbivores learn about station, patch and even feeding site levels. The use of working habitat structure and how they use that information in subsequent memory is limited if a long time elapses between decisions.
foraging decisions. Reference memory can be used at larger levels, from patches to
Spatial memory has been represented as a two-part code, refer- home ranges. The use of reference memory at smaller levels is ence and working memory @Ion& 1978, Olton 1978, Staddon limited by the large number of alternatives to be remembered.
1983). Both types of memory are used in maze studies where the Perception. Herbivores must perceive differences among plant objective is to consume the food at each arm without reentering par&, plan&, and feeding stations so eat hey cm discrhinate
any arms. Reference memory is the map-like representation of and select among alternatives. Livestock have acute perceptual the foraging environment. In maze studies, the configuration of and discriminatory abilities (Bazely 1990). Cattle, sheep, and the arms and the relative availabilities of food at the beginning of h orses
a trial are stored in reference memory. Working memory is used
can distinguish colors and shapes and associate these cues with the locations of foods (Edwards et al. unpublished manu- to remember which arms have been visited during a trial so that
animals can avoid entering arms where food had already been
script, Entsu 1989a, 1989b; Kidunda and Rittenhouse 1992, consumed. Working memory has value only during the current Espach et al. 1993). When grazing heterogeneous SW&S, cattle trial since food is replenished before the next trial. are able to readily distinguish feeding stations that differ from the
Performance of cattle (Bailey et al. 1989a), rats (Beatty and background by less than 5 cm of height (Laca et al. 1993).
Shavalia 1980) and pigeons (Roberts and Van Veldhuizen 1985)
While it is known that grazing animals can perceive differences exceeds that expected by chance in radial mazes indicating an
among feeding stations and small patches, it is not clear whether th
accurate spatial memory. To Perform efficiently, animals use
ey are able to directly perceive large units of spatial selection.
both reference and working memory. Reference memory may fail Selection of feeding sites may be a result of information gathered at smaller sc,les.
if locations containing food are not visually distinct. Rats perform
poorly in parallel mazes because they cannot distinguish between Body Size and Interactions of Spatial and kemporal Scales.
B o d
arms (Staddon 1983). Bailey et al. (1989a) found that cattle made y size of the herbivore can affect the absolute size of impor- more mistakes in a parallel maze than a radial maze but perfor- tant spatial and temporal scales and may affect interactions that mance was above chance levels in both mazes. The parallel maze occur among scales. Linkages between spatial and temporal used for cattle was constructed in a pasture containing shrubs that scales can be imposed by physiological or mechanical processes
th
may have provided more visual cues to distinguish arms than are at occur on relatively fixed schedules or within clearly defined b oundaries
available in the more homogeneous apparatuses used in laborato- (e.g., gut volume). Digestion and assimilation of ry studies with rats. Reference memory is also used to distinguish nutrients, gut constraints, or thermoregulatory needs can limit the amounts of food found at various spatial locations (Hulse and duration of an individual feeding bout, and thereby modify the O’Leary 1982). Bailey et al. (1989b) reported that cattle could connection between the spatial distribution of forage and feeding associate a spatial location with the relative amount of food there. patterns. Such morphological or physiological limitations also Cattle could remember locations with larger and smaller amounts restrict the distance that can be transversed during a foraging of food for at least 24 hours (time between trials) and probably bout. Distance traveled during a feeding bout is also determined much longer. It took 4 to 6 days for steers to modify their behav- in part by the size of forages and their spatial distribution. When ior when the amounts of food in each location were changed forages are sparsely distributed, the size of a feeding site will (Bailey et al. 1989b). Laca (1995) examined reference memory of increase as animals move more quickly between feeding stations cattle and found that they can remember for up to 20 days the (Collins et al. 1978, Ruyle and Dwyer 1985, Wickstrom et al.
locations of 20 trays containing hidden food in a grid of 64 trays. 1984). If short-term intake rate is low, the duration of a feeding The study conducted by Bailey et al. (1989a) evaluating persis- bout can increase, permitting an animal to move farther during a tence of spatial memory of cattle differs from that of Laca (1995)
single feeding bout
in that Bailey et al. tested the persistence of working memory Recent studies have focussed on identifying mechanisms that rather than reference memory. During each trial, cattle were regulate forage intake by herbivores and on incorporating these removed from a radial maze after consuming food in 4 of the 8 mechanisms into predictive models (Ungar and Noy-Meir 1988, arms. Animals were returned to the maze after a delay interval. Spalinger and Hobbs 1992, Gross et al. 1993b, Demment and Animals were able to remember where they had foraged during a Laca 1994). These studies have shown the importance of fat-cor- trial after delays up to 8 hours. Cattle performed poorly, equiva- rected body size of animals in the regulation of forage intake.
lent to chance levels, after a 12 hour delay. Cattle may not have Thus, the scaling of feeding behaviors with body size provides an been able to distinguish between trials with long delay intervals approach for making widely applicable, quantitative predictions and new trials, because trials were conducted on successive days of the effects of forage characteristics and spatial pattern on her- and because the delay interval (12 hours) within a trial was iden- bivore foraging behaviors. When herbivores of all sizes can read- tical to the time between trials. Rather than a failure of working ily obtain large bites, intake rate increases with body size at a rate memory after 12 hours, cattle in this study may have reset work- similar to metabolic requirements (Shipley et al. 1994). Bite size ing memory in anticipation of a new trial. All these empirical may be affected by plant traits (e.g., leaf size) and animal mor- studies show that ungulates and other species have accurate spa- phology (e.g., incisor breadth, Clutton-Brock and Harvey 1983, tial memories. Large herbivores can remember the locations and Janis and Ehrhardt 1988, Illius and Gordon 1990) or determined relative availabilities of food (reference memory) for at least 20 behaviorally. Large herbivores in natural situations crop bites days and can remember which locations have been recently smaller than those they are capable of consuming (Table 1 in depleted (working memory) for at least 8 hours. Gross et al. 1993a, Table 3 in Shipley et al. 1994); smaller bites
392 JOURNAL OF RANGE MANAGEMENT 49(5), September 1996
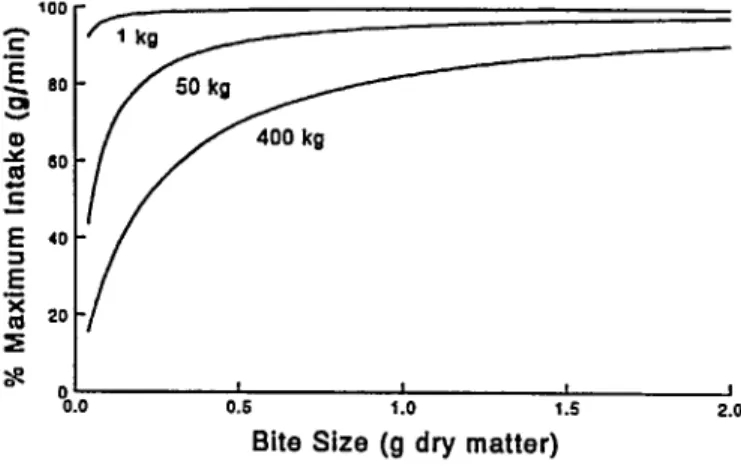
may increase diet quality. When vegetative conditions restrict maximum bite size, larger herbivores will invariably be more affected than smaller animals (Pig. 2). Large-bodied herbivores then must spend more time feeding than smaller ones (Illius and Gordon 1987, Owen-Smith 1988). This relationship occurs even though mass-specific metabolic requirements are greater for small than large herbivores (Pig. 6.4 in Owen-Smith 1988).
s 0 I 9 I I
0.0 0.5 1.0 1.5 2.0
Bite Size (g dry matter)
Fig. 2. Relationships between maximum intake rote and bite size for 3 different body sixes.
Scaling relationships provide important insights about con- straints and opportunities available to herbivores that differ in body size. Small-bodied herbivores, because they require less feeding time, have more flexibility than do large herbivores to sacrifice intake rate for search effort, and they may choose to spend relatively more time searching for high quality items, trad- ing a higher short-term intake rate for increased diet quality. In this situation, the spatial distribution of high-quality forages will more strongly influence the spatial patterns of foraging by selec- tive feeders, and forage availability as measured by short-term intake rate will determine patterns of foraging by bulk feeders (Jarman 1974, Hanley 1982, Demment and Van Soest 1985).
Digestive constraints are thought to restrict diet quality of small- bodied herbivores more than large herbivores (Demment and Van Soest 1985). Digestive constraints will thus enhance effects relat- ed to the scaling of intake rates, and smaller herbivores are likely to be more selective in their choice of forages. As a result, small- bodied herbivores can spend more time selecting forages (in con- trast to actually cropping bites). When high quality forages are limited, smaller herbivores are therefore predicted to feed in areas where they can maximize diet quality, while larger herbivores are predicted to feed in areas where they maximize intake rates (Demment and Van Soest 1985). Sex-related differences in habi- tat use by sexually dimorphic herbivores (Charles et al. 1977, Shank 1982, Clutton-Brock et al. 1987, Gross et al. 1995a), where males and females differ less in body size than do cattle and sheep or goats, lend support to proposed consequences of body size on the spatial distribution of foraging. Because smaller herbivores are physically able to spend more time searching for foods, feeding behaviors may vary with body size. When forage quality is limiting, smaller herbivores can spend less time at a feeding station, consume smaller bites (to maximize diet quality),
and move longer distances between feeding stations. Large herbi- vores must maintain intake rate and cannot afford to expend as much time selecting bites.
If we consider animals with a similar feeding style, a general relationship that identifies the scale at which a herbivore responds to spatial heterogeneity emerges from the scaling of intake rate and movement patterns to body size (BW, kg) even in the absence of controls on bite size. If meal size is a constant fraction of total gut fill, then the amount of forage consumed during a feeding bout will be proportional to BW’” (Parra 1978, Demment 1982). Because the maximum scaling exponent for intake rate is far lower (about Bp6’, Shipley et al. 1994), foraging bouts of large herbivores will be longer than those of small-bodied ones. If foraging travel rates are constant or increase with body size (Shipley et al. 1996), the area that a herbivore exploits during a feeding bout will increase at a rate proportional to at least Bw033.
The relationships outlined above are nonetheless highly subject to the influences of forage distribution. If existing patches are smaller than those potentially exploited by a herbivore during a foraging bout, effects of forage distribution will overwhelm those imposed by animal morphology. The spatial extent of foraging behaviors and forage distribution can interact to reinforce exist- ing patterns, or to reduce heterogeneity in the environment.
Abiotic Factors
Abiotic factors such as slope and distance to water are primary determinants of grazing distribution patterns observed at larger scales (Senft et al. 1987). They act as constraints within which foraging mechanisms may operate. Areas located long distances from water and on steep slopes receive less use (Vallentine 1947, Mueggler 1965). Movement between camps and home ranges may be motivated by the need to find a new water source or avoid adverse climatic conditions. Microsite characteristics, such as the presence or absence of shade and wind, affect where animals rest and can affect where they graze (Senft et al. 1985b, Stuth 1991).
Presence of pests and predators can also constrain grazing distrib- ution (Senft et al. 1987). Abiotic constraints must be combined with responses resulting from biotic factors (eg., forage quantity and quality) to adequately predict grazing distribution patterns (Senft 1989).
Landscape Grazing Distribution Model
We developed a conceptual model to demonstrate how cogni- tive foraging mechanisms can be integrated with abiotic factors to predict grazing patterns of large herbivores. It provides a frame- work for evaluating the merit of foraging mechanisms based on spatial memory. This individual-based model could also be used to evaluate site specific management practices a priori. The model focuses on processes that occur between grazing bouts or between days. The primary model output is feeding site selection by an individual animal. It is designed to apply to a variety of landscapes and can be modified to represent a variety of large herbivores.
We focus on patch and feeding site processes because most land management problems such as overgrazing, habitat deterio- ration, and riparian area degradation are more related to larger scale grazing patterns (ie., grazing use of large patches, plant communities, and landscapes) than those that occur at finer scales (grazing use of individual plants and small patches). Problems
JOURNAL OF RANGE MANAGEMENT 49(5), September 1996 393
that occur at finer scales are more difficult to measure and more difficult for management to respond to. Except for stocking rate (Senft 1989), most range management practices probably have the greatest impacts on patch, feediig site, and camp selection behaviors. Subdividing pastures and implementing rotational and other intensive grazing systems can, in some cases, reduce and possibly eliminate feeding site selection by large herbivores. If a pasture is very small, animals may graze throughout the entire pasture during a bout. Fencing, water development, riding, and other range management practices have little, if any, effect on diet selection or feeding station processes.
Model Description
Our model simulates feeding site selection at the beginning of a bout by an individual large herbivore based on expectations from previous encounters with the habitat. The effects of abiotic fac-
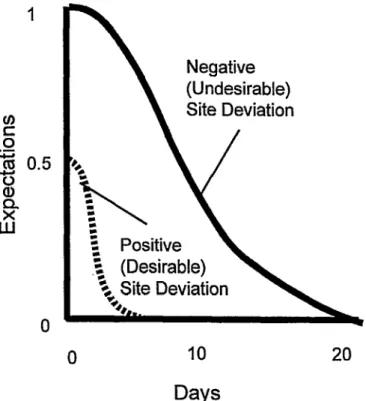
tors are integrated with forage quality, forage quantity, and sec- ondary compounds information obtained while foraging at each site. Memories of this information decay over time and the corre- sponding values, termed expectations, are used by the model to compare and select feeding sites (Fig. 3).
0.12
Ai an animal forages, it-perceives-a relative value for that feed-
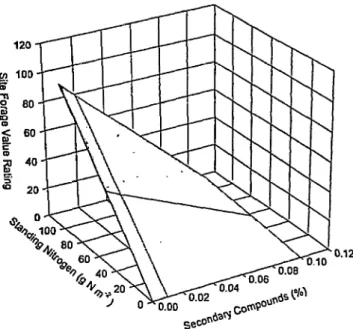
ing site. Ideally, this site forage value would be the instantaneous Fig. 4. Hypothetical site forage value rating as a function of the nutrient capture rate (eg., g N or joules of energy consumed mine’). standing nutrient availability (eg., g N rn- ) and secondary com- Unfortunately, this is extremely difficult to measure. Therefore, pound concentration. Site forage values would be calculated by species, and corresponding values for preferred species would be pooled using a weighted average.
Rating for each encounter of each feeding site
T-1
Abiotic Factors -distance to water
Perceived Site Value
-an iniegratton of forage and abiotic factors encountered during a bout
Deviation
Reference Value for an encounter of a site
-Moving average of Perceived Site Values that have been encountered during the 4 days before this visit -a relative rating of an encounter
of a site based on expsriances during the past 4 days.
Rating for all encounters of a feeding site
Current rating of all encounters of a feeding site -Above process is used
for all encounters of a s-m.
- Current value is Current Reference Value
-The Reference Value during the 4 days prior 10 tha beginning of
used as the selection
the bout is used as a standard
Fig. 3. Flow diagrams of the steps used in the conceptual landscape grazing distribution model for determining the rating for a single encounter of a feeding site and the expectation for a feeding site based on multiple encounters.
site forage value will normally be a function of the relative abun- dance of nutrients (eg., g N ha’) and secondary compounds (Fig.
4). The site forage value is multiplied by abiotic factor multipliers that vary between 0 and 1. Abiotic factors are similar to Habitat Suitability Indices and reflect factors such as distance to water, slope, prevailing winds, and probability of predation (U.S. Fish and Wildlife Service 1976). These factors adjust forage quality and quantity values of a site for the environmental conditions (abi- otic factors) in which the forage is found (Fig. 5). This ensures that sites located far from water and on steep slopes are less pre- ferred by herbivores such as cattle, even though they may have abundant forage. Abiotic factors are specific to a given herbivore species. For example, the factor for cattle on a steep slope would differ from the factor for goats. The product of the site forage value and the abiotic factors is termed the perceived site value.
Perceived Site Value = Site Forage Value * Abiotic Factors (1) The perceived site value combines the effects of forage value and abiotic factors, but its absolute value is not useful. It must be compared to a standard. The reference value used in this model is a moving average of perceived site values.
Reference Vahq = z (Perceived Site Values)
n (2)
The reference value on day i is the running average of perceived site values for all feeclmg sites encountered during the last 4 days, and n is the total number of sites visited during the previous 4 days. A moving average is used as a standard of comparison so that it will reflect temporal changes in forage quality and quanti- ty. We use a moving average of perceived site values from all sites encountered in the last 4 days rather than a moving average from all sites. Using only recently visited sites as the reference value incorporates the effects of recent experience on foraging behavior (Cuthill et al. 1990, Devenport and Devenport 1994,
394 JOURNAL OF RANGE MANAGEMENT 49(5), September 1996