LEABHARLANN CHOLAISTE NA TRIONOIDE, BAILE ATHA CLIATH
TRINITY COLLEGE LIBRARY DUBLIN
OUscoil Atha Cliath
The University of Dublin
Terms and Conditions of Use of Digitised Theses from Trinity College Library Dublin
Copyright statement
All material supplied by Trinity College Library is protected by copyright (under the Copyright and
Related Rights Act, 2000 as amended) and other relevant Intellectual Property Rights. By accessing
and using a Digitised Thesis from Trinity College Library you acknowledge that all Intellectual Property
Rights in any Works supplied are the sole and exclusive property of the copyright and/or other I PR
holder. Specific copyright holders may not be explicitly identified. Use of materials from other sources
within a thesis should not be construed as a claim over them.
A non-exclusive, non-transferable licence is hereby granted to those using or reproducing, in whole or in
part, the material for valid purposes, providing the copyright owners are acknowledged using the normal
conventions. Where specific permission to use material is required, this is identified and such
permission must be sought from the copyright holder or agency cited.
Liability statement
By using a Digitised Thesis, I accept that Trinity College Dublin bears no legal responsibility for the
accuracy, legality or comprehensiveness of materials contained within the thesis, and that Trinity
College Dublin accepts no liability for indirect, consequential, or incidental, damages or losses arising
from use of the thesis for whatever reason. Information located in a thesis may be subject to specific
use constraints, details of which may not be explicitly described. It is the responsibility of potential and
actual users to be aware of such constraints and to abide by them. By making use of material from a
digitised thesis, you accept these copyright and disclaimer provisions. Where it is brought to the
attention of Trinity College Library that there may be a breach of copyright or other restraint, it is the
policy to withdraw or take down access to a thesis while the issue is being resolved.
Access Agreement
By using a Digitised Thesis from Trinity College Library you are bound by the following Terms &
Conditions. Please read them carefully.
N o v el A p p roa ch es to B iclu sterin g and
G en e F u n ction al C lassification in
M icroarray G en e E x p ressio n D a ta
K e n n e t h B r y a n
A thesis su b m itte d to th e U niversity of D ubhn, T rinity College
in fulfillm ent of th e requirem ents for th e degree of
D octor of Philosophy
TRINITY COLLEGE
D ecla ra tio n
I, the undersigned, declare th a t this work has not previously been subm itted to this or any
other University, and th a t unless otherwise stated, it is entirely my own work. This thesis
may be borrowed or copied upon request with the permission of the Librarian, University
of Dublin, Trinity College.
The copyright belongs jointly to the University of Dublin, Trinity College and Kenneth
Bryan
Kenneth B r^ n
A cknow ledgem ents
I would like to acknowledge support my parents and family who have always encouraged
me in my studies. W ithout this unwavering positive influence a much more difficult, and
perhaps untraversable, path would have lay between my me and my goals. I would also like
to express my sincere gratitude to my supervisor Padraig for his valuable guidance during
my research. Thanks too are owed to Derek for his patience in the face of a continuous
bom bardm ent of questions on wide variety of issues from latex to diagonal dominance, or
something. Indeed th e friendship from the whole MLG group has made my research a
much more pleasant and enjoyable experience th an I had anticipated.
K e n n e t h B r y a n
A bstract
M icroarray analysis is a high-throughput experimental technique with the capacity to
measure the expressions of thousands of genes in parallel over many experimental samples
(tissues types, environmental conditions, time points etc.). To fully exploit the large
volumes of expression data produced by these experiments requires the application of
statistical analysis and machine learning methods. M icroarray datasets may contain many
genes and samples with unknown labels. New gene functional classes may also emerge as
our understanding of the underlying biological system increases. As a result, unsupervised
m ethods of analysis, such ais cluster analysis, often prove most useful in this domain.
Cluster analysis models the class structure within a dataset by grouping objects into
disjoint clusters based on their similarities over a set of features. In the gene expression
context both genes and samples may be viewed as objects depending on the aims of
the microarray experiment. However, in large, noisy gene expression datasets measuring
object similarities over all features may prove difficult. Furtherm ore, even related genes
may not exhibit similar expression profiles over all experim ental samples and may be
shared between functional classes. These issues are largely overcome by biclustering, in
which objects are grouped based on their similarities over a subset of features.
C ontents
A c k n o w le d g e m e n t s
iii
A b s t r a c t
iv
C o n te n t s
v ii
L ist o f F ig u r e s
v iii
L ist o f T a b le s
x
A s s o c ia t e d P u b lic a t io n s
x i
C h a p te r 1
I n t r o d u c tio n
1
1.1
Genes and Functional M o d u l e s ...
1
1.1.1
Gene Expression M ic ro a rra y s ...
2
1.1.2
Cluster Analysis of Microarray Gene Expression D a t a ...
3
1.2
M otivation
...
4
1.3
C o n trib u tio n s ...
5
1.4 Overview of T h e s i s ...
6
C h a p te r 2 M ic r o a r r a y G e n e E x p r e s s io n A n a ly s is
9
2.1
Introduction : M icroarray A n a ly s is ...
9
2.2
Functional G e n o m ic s ... 12
2.2.1
From Blueprint to F u n c tio n ... 12
2.2.2
Sequencing and Gene Functional A n n o t a t i o n ... 14
2.2.3
Functional D atabases ... 16
2.3 The M icroarray E x p e rim e n t... 17
2.3.2 Types of M ic r o a r r a y ... 20
2.3.3 Minimal Inform ation A bout a M icroarray Experiment (MIAME) . . 21
2.4 M icroarray D ata A n a ly s is ... 23
2.4.1 Pre-Processing M icroarray D ata ... 23
2.4.2 C om putational Analysis of M icroarray D a t a ... 28
2.5 S u m m a r y ... 32
C h ap ter 3 C lu ster A n a ly sis o f M icroarray G en e E xp ression D a ta
34
3.1
Introduction: M icroarray D a t a ... 34
3.2 Cluster Analysis ... 36
3.2.1 Distance M e tr i c s ... 36
3.2.2 Hierarchical C lu ste rin g ... 37
3.2.3 Partitional C l u s t e r i n g ... 39
3.2.4 Self Organising Maps
... 40
3.3 Cluster Analysis of Microarray D a t a ... 42
3.3.1 The biological rationale behind clustering microarray d a t a ... 42
3.3.2 Clustering M icroarray D ata : a new d iscip lin e... 43
3.3.3 Drawbacks of Clustering Gene Expression D a t a ...47
3.4 Biclustering M icroarray D a t a ... 50
3.4.1 Dehnition and C o m p lex ity ... 50
3.4.2 Heuristic Biclustering Approaches ... 51
3.5 S u m m a r y ... 62
C h ap ter 4 S im u la ted A n n ea lin g B ic lu ste r in g o f G en e E xp ression D a ta
63
4.1 In tro d u c tio n ... 63
4.2 Simulated A n n e a lin g ... 64
4.3 Biclustering using Simulated Annealing ... 67
4.3.1 SAB P a r a m e t e r s ... 67
4.3.2 The SAB A lg o r it h m ... 68
4.4 E v a lu a tio n ... 72
4.4.1 D atasets Used
... 72
4.5 Evaluation of Biclustering Using Simulated A n n e a li n g ... 75
4.5.1 Com parative Evaluation of SAB with Node D e le tio n ... 76
4.5.3 Biological In te rp re ta tio n ... 80
4.6 Conclusions &; Future W o r k ... 83
C h a p t e r 5
B o tto m - U p B ic lu s te r in g o f
G e n e E x p re s s io n D a ta
85
5.1 In tro d u c tio n ... 85
5.2 B U B B L E ... 87
5.2.1 The Bottom-Up A p p ro a c h ... 87
5.2.2 An Improved Bicluster Scoring M e t r i c ... 88
5.2.3 Seed S e a r c h ... 90
5.2.4 Seed E x p a n sio n ... 91
5.3 Evaluation of B U B B L E ... 94
5.3.1 Yeast M icroarray Gene Expression D a ta s e ts ... 95
5.3.2 Evaluation of Metrics ... 96
5.3.3 Com parative Evaluation with C lu ste rin g ... 97
5.3.4 Com parative Evaluation with Top-Down Biclustering ... 98
5.3.5 Com parative Evaluation with S A M B A ... 99
5.4 C o n c lu sio n s...102
C h a p t e r 6
F u n c tio n a l C la ss ific a tio n o f
U n a n n o ta te d O R F s
103
6.1 In tro d u c tio n ... 103
6.2 Validation of A n n o ta tio n s ... 104
6.2.1 E xternal Sources of Vahdation ... 104
6.2.2 Cross V a li d a tio n ... 105
6.3 ORF A nnotations from Analysis of B ic lu s te r s ... 106
6.4 Classification of U nam iotated Yeast O R F s ...108
6.5 C o n c lu sio n s... 114
C h a p te r 7
C o n c lu sio n s & F u tu r e W o rk
115
7.1 In tro d u c tio n ... 115
7.2 Thesis S u m m a r y ... 116
7.3 Thesis C o n trib u tio n s ...119
7.4 Future Work ...121
List o f F igu res
2.1
M icroarray p ap ers published an n ually... 10
2.2
H ierarchy of an o rg an ism ... 12
2.3
C om plem entary n a tu re of D N A ... 13
2.4
T h e C en tral D ogm a of M olecular Biology... 14
2.5
T h e chrom osom e... 15
2.6
M icroarray P re p a ra tio n ... 18
2.7
T h e M icroarray E x p e rim en t... 19
2.8
G raphical rep resen tatio n of m icroarray d a ta ... 25
2.9
Log tran sfo rm atio n of m icroarray d a ta ... 26
2.10 T he gene expression d a ta after tra n s fo r m a tio n ... 27
3.1
C luster sim ilarity m easures... 38
3.2
H ierarchical clustering... 39
3.3
k - m e a n s ... 40
3.4
T he self-organising m ap (SOM) p ro ced u re...41
3.5
Functional m odules...43
3.6
Tam ayo
et al.'s SOM results (1999)... 45
3.7
Illu stratio n of th e coupled two-way clustering approach... 49
3.8
Illu stratio n of bicluster overlap... 50
3.9
Spectral biclustering... 52
3.10 O rdering th e eigenvectors of th e d a ta m atrix to reveal th e ‘checkerboard’
s tru c tu re ... 53
3.11 C orrespondence of a bicluster and biclique... 55
3.12 C heng and C h u rch ’s greedy node deletion a p p ro ach ...59
4.2
The probabihty of accepting a reversal in SA... 65
4.3
SA vs. hill cHmbing... 66
4.4
The SAB algorithm, generation of new bicluster solution... 68
4.5
The generate new solution step of SAB... 69
4.6
The SAB Algorithm... 70
4.7
SAB algorithm, Node Addition Step... 71
4.8
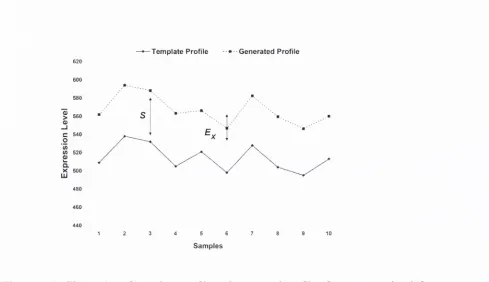
Generation of bicluster from gene real tem plate... 74
4.9
The biclusters embedded within the synthetic dataset... 75
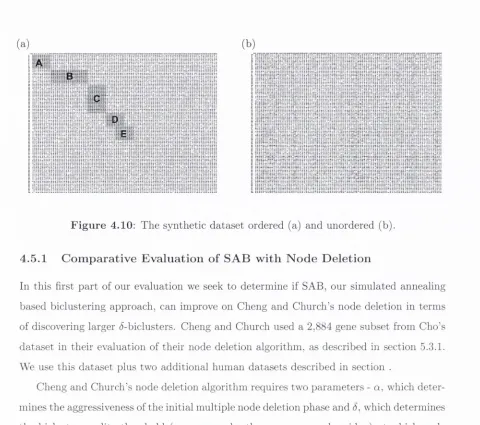
4.10 Synthetic d atase t... 76
4.11 Simulated Annealing Biclustering (SAB)... 77
4.12 SAB evaluation on the yeast d atase t... 78
4.13 Biological interpretation of three biclusters discovered by SAB... 82
5.1
Bias of the
H-Scove over different scales... 89
5.2
The effect of increasing scale on bicluster scores... 90
5.3
Seed Search... 92
5.4
The Seed Expansion phase of BUBBLE... 93
5.5
Stopping criterion in Seed Expansion... 94
5.6
Bicluster score evaluation... 96
5.7
Comparison of best biclusters of SAMBA and BUBBLE... 101
6.1
BUBBLE biclusters th a t capture gene functional modules... 107
6.2
Cross validation of ORF classification... 108
List o f Tables
2.1 An idealized microarray dataset of four genes whose expression is measured
over ten experimental samples... 23
2.2 Table 2.1 after transform ation to normality and standardization of experi
mental samples (columns)... 26
3.1 A typical microarray d atase t... 35
4.1 Comparison of 5-biclusters discovered in each real d atase t... 79
4.2 A comparison of the percentage of biclusters discovered from the synthetic
dataset by each biclustering m ethod... 80
4.3 Known functional modules (FM) found by SAB in the annotated gene dataset. 81
5.1
97
5.2 A comparison between CLARITY and BUBBLE... 98
5.3 A comparison of BUBBLE against previous top-down biclustering approaches. 99
5.4 Comparison between SAMBA and BUBBLE on the yeast cell cycle dataset 100
6.1 Classification of unannotated yeast
o r f s...I l l
6.2 Open reading frames (ORFs) th a t show consistent classified across all three
A sso cia ted P u b lication s
B ryan, K., C unningham P., (2006) B ottom -U p B iclustering of E xpression D ata.
In Pro
ceedings o f the 2006 IE E E Sym posium on C om putational Intelligence in B ioinform atics
and C om putational Biology, (C IB C B 2006) Toronto, Ontario, Canada, pp. Pages
232-249.
B ryan, K., C unningham P. Bolshakova, N., (2006) A pplication of Sim ulated A nnealing
to th e B iclustering of Gene Expression D ata.
IE E E Transactions on In fo rm a tio n Tech
nology in B iom edicine. 10 pp. 519-525.
B ryan, K., C unningham ,P . and Bolshakova,N., (2005) B iclustering of Expression D a ta
Using Sim ulated A nnealing.
In Proceedings o f the 18th IE E E Sym posium on C om puter-
Based Medical System s, (C B M S 2005) Dublin, Ireland, pp. 383-388.
C hapter 1
In trod u ction
1.1
G en es and F u n ction al M o d u les
T h e tra d itio n al reductionist approach to biology aim s to u n d e rsta n d living organism s
by reducing th em to th eir co n stitu e n t parts. By characterizing th e functions of these
individual p a rts we m ay th en explain th e n a tu re of th e higher level organism . T h is has
been th e p redom inant prem ise in biology th ro u g h o u t the 20th century. In th e last few
decades w ith th e advances in biology have led us to th e verge of fully realising th is goal.
We have now identified the fundam ental functional u n its of living organism s, th e genes
and th e proteins th ey encode, and our focus is now on identifying and elucidating their
individual functions.
higher level functions. Large functional modules such as those th a t govern metabolism,
protein synthesis and the cell cycle interact to carry out the cells basic processes such as
growth, repair and reproduction.
Fortunately recent advances have allowed the experimental technology to keep pace
with this higher level m odular view of molecular biology. The maisses of genomic sequence
inform ation now available combined with standard methods from molecular biology and
new microscopic arraying techniques has enabled the development of new global analysis
experiments. The classic ‘one gene, one experim ent’ approach can now be supplanted by
powerful
microarray experiments, in which the expression of many, if not all, of the genes
w ithin an organism, may be analysed in parallel.
1.1 .1
G e n e E x p r essio n M icro a rra y s
M icroarrays allow us to simultaneously measure the expression levels of thousands of
genes over many samples, all within the one experiment. This global analysis of gene
expression not only contributes to functional characterisation of individual genes but also
to the identification co-regulated groups, which aids in the elucidation of gene functional
modules. Individual samples too, such as tissue types, may be characterised and grouped
on the basis of their distinctive gene expression patterns.
1 .1 .2
C lu ste r A n a ly sis o f M icro a rra y G e n e E x p r essio n D a ta
Cluster analysis is an unsupervised grouping technique th a t partitions a dataset into dis
joint clusters of similar objects. Similarity is com puted over a set of object attrib u tes or
features. In this way the distinct classes in the d ata may be modelled. Such a technique,
combined w ith a an appropriate similarity metric, may be used in an attem p t to model
the natural gene functional modules within a gene expression dataset.
The co-regulated genes within functional modules may be expressed at different mag
nitudes but may change in tandem over different experimental conditions. For example, a
multimeric protein may be comprised of two gene encoded subunits, A and B th a t always
combine in a fixed ratio in the functioning multimer, say 2:1 respectively. In this case
gene A will always be expressed at a level twice th a t of B. Otherwise there would be a
waste of energy and resources which would reduce the fitness of the organism (the ability
of an organism to grow and reproduce in a given environment). This organism would
then be out-com peted by more efficient organisms. As a result, a suitable metric for gene
expression d ata would measure the similarity of correlation of objects (such as P earson’s
r) rather th an their absolute distances (such as Euclidean). Cluster analysis, however, has
some drawbacks when applied to these large gene expression datasets:
• In standard clustering, similarity between objects in measured over the full set of
features. As th e number of dimensions of a dataset increases, however, it becomes
increasingly unlikely th a t objects (genes) will retain similarity over all features (ex
perim ental samples).
• It is not uncommon for genes, even those th a t are functionally related genes, to act
independently within some experimental samples. Therefore, measuring similarity
over all samples may fail to capture some significant relationships within th e data.
• A gene may be involved in more than one functional module. Therefore, hard par
titioning of the data, via clustering, may lead to loss of information.
• Gene expression datasets are generally quite noisy. Again, this may affect the ability
standard clustering to detect object similarities within the dataset.
to be discovered. T his also allows for th e m odelling of overlapping gene functional m odules,
as different subsets of features m ay c a p tu re sim ilarities betw een different su b sets of genes.
F u rth e rm o re such an approach would be able to disregard irrelevant or noisy features.
Such a two-way clustering approach has been referred to as biclustering and was first
in tro d u ced to th e a rea of gene expression analysis by C heng and Church.
In biclustering th e num ber of possible su b -m atrix solutions, p o ten tia l
biclusters, w ithin
a d a ta m atrix increases exponentially w ith th e size of th e m atrix. As a result C heng and
C h u rc h ’s original technique was a based on a greedy heuristic developed around a bicluster
scoring m etric, th e
m ean squared residue score. T his m etric sim ultaneously m easures th e
correlations of th e rows and colum ns w ithin a selected sub-m atrices of a d a ta se t. To aid
th e m odelling of th e entire bicluster, and c a p tu re th e com plete gene functional m odule, a
top-dow n approach was employed. B eginning w ith th e full d a ta m atrix , th e w orst fitting
rows and colum ns were iteratively removed.
1.2
M o tiv a tio n
T h e original C heng and C hurch biclustering technique is based on a greedy search strategy.
T h is search traverses th e solution space considering all possible moves b u t only accepts
th e solution th a t represents th e g reatest im provem ent for a given criterion, in th is case
th e m ean squared residue. No solutions outside this search p a th m ay be accepted. A
po in t is finally reached a t which no im provem ents can be m ade, and this solution is th en
retu rn ed . However it m ay be th e case, especially in large d a ta se ts, th a t th e best possible
solution overall, th e global optim um m ay be unreachable by such an always im proving, ‘hill-
clim bing’, ro u te. T h e global optim um m ay lie a t th e end of an u n d u latin g b u t generally
im proving search p a th along which some disim provem ents are accepted. In such cases a
hill clim bing approach will always re tu rn a
local optim um
or im perfect solution. In th e
context biclustering w ithin gene expression d a ta an incom plete bicluster th a t m odels only
p a rt of a gene functional m odule would represent such a locally optim al solution. This
would represent a less accu rate rep resen tatio n of th e underlying system .
bi-clusters. As a top-down approach always begins from the same global starting point, it
may have difficulty uncovering the full range of bicluster solutions.
Although widely adopted, the mean squared residue bicluster metric itself contains
inherent biases which lead it to favour certain types of bicluster solutions. As with the
top-down search strategy, this may lead to an inaccurate and incomplete representation
of the set of relationships we are attem pting to model.
The evaluation of many biclustering techniques applied to gene expression d ata tends to
be quite limited. For example, although there is a general understanding th a t biclustering
may improve upon clustering no direct comparisons have been carried out in this domain.
The main failing in the evaluations, however, is the general lack of biological validation
of the bicluster results. Although biclusters are evaluated in term s of improvements on
bench marks using a quality m etric (such as the mean squared residue) few papers look
into the correspondence of the biclustered genes to real functional modules.
A related failing in this area is th a t of developing the knowledge discovery aspects of
the research. An accurate bicluster model has the potential to contribute toward discovery
of new functional classes and the classification of functionally unlabelled genes.
1.3
C o n t r ib u t io n s
In this thesis we attem p t to tackle each of the above mentioned issues with regard to
biclustering within the field of gene expression d ata analysis.
• We attem p t to improve upon previous hill-climbing biclustering strategies, namely
the Cheng and Church bench m ark by developing a Simulated Annealing based
biclustering approach (SAB). We show th a t SAB has the ability retrieve more sig
nificant bicluster solutions in microarray expression data, in term s of size and quality,
than both the original Cheng and Church greedy approach and two improved ver
sions of this algorithm.
• W'e develop an improved bicluster scoring metric free from the biases exhibited by
the popular mean squared residue score. We use this new metric to discover more
significant bicluster signals within microarray gene expression data.
cluster-ing and biclustercluster-ing benchmarks by retrievcluster-ing a set of biclusters th a t b etter reflect
the n atural set of gene functional modules within m icroarray gene expression data.
• We incorporate the BUBBLE biclustering algorithm within a newly developed clas
sification approach and attem p t to functionally annotate unclassified yeast open
reading frames (ORFs) i.e. potential genes, using microarray gene expression data.
We evaluate this classification approach both internally, using cross validation, and
externally, using protein sequence inform ation and existing ‘wet lab’ experimental
evidence.
1,4
O verview o f T h esis
• C h a p t e r 2 - M ic r o a r r a y G e n e E x p r e s s io n A n a ly s is : Here we review the fun
dam ental molecular biology required to understand the microarray gene expression
experiment and the significance the resultant datasets. We then discuss the underly
ing premise microarray gene expression experim ental technique, the two main types
of m icroarray and the im portance of developing standards within this emerging do
main. We discuss the various pre-processing steps th a t need to be carried out on
the raw m icroarray d ata prior to d ata analysis. We finish by discussing the various
types com putational analysis m ethods applied to microarray d ata and the specific
objectives supported by each technique.
plaid m odel biclustering have been employed, however, approaches based on C heng
and C h u rch ’s m ean squared residue rem ain m ost popular. We review th e various
m ean squared residue based biclustering approaches. We th en propose th e stochas
tic Sim ulated A nnealing (SA) search technique, which has th e p o ten tia l to b e tte r
explore solution space, as a possible successor to th e C hurch and C heng’s greedy
approach.
• C h a p t e r 4 - A p p l i c a t io n o f S i m u l a te d A n n e a l in g t o t h e B i c l u s t e r i n g o f
G e n e E x p r e s s i o n D a t a : In this ch ap ter we develop a bicluster search approach
for gene expression d a ta based on th e sim ulated annealing o p tim ization stra te g y
(SAB). We th e n perform a com parative evaluation of SAB and C heng and C h u rc h ’s
greedy approach using th ree m icroarray gene expression d atasets. To fully te s t SAB
we also evaluate it against two augm ented versions of C heng and C h u rch ’s node
deletion algorithm . In th e second p a rt of our evaluation we co n stru ct a synthetic
d a ta s e t containing seeded biclusters. T he sy n th etic d a ta s e t allows us to investigate
th e ability of SAB to discover th e full set of bicluster signals w ithin a d a ta se t. A fter
th is assessm ent of th e co m p u tatio n al im provem ents we a tte m p t, in th e final section of
th e evaluation , to garner some biological su p p o rt for our SAB biclustering algorithm
by rim ning on a fully a n n o ta ted d a ta se t. We end th is ch ap ter by outlining p o ten tial
enhancem ents to th is biclustering technique to achieve im proved m odelling of the
various gene functional m odules.
• C h a p t e r 5 - B o t t o m - U p B i c l u s t e r i n g o f G e n e E x p r e s s i o n D a t a : In this
ch ap ter we develop th e b o tto m -u p BU BB LE (B ottom -U p B iclustering By Locality
Expansion) biclustering technique. BU BB LE builds on th e research outlined in the
previous c h a p te r by incorporating th e sim ulated annealing aspect of SAB. B U B B LE
also m akes use of new bicluster scoring m etric, th e
Hv-score, th a t we develop to
aid in th e discovery of m ore significant bicluster signals. We evaluate B U B B LE
ag ain st previous clustering and top-dow n biclustering approaches. W^e also evaluate
B U B B LE ag ain st a widely used b o tto m -u p biclustering bench m ark called SAA-IBA.
We evaluate our results in term s of th e correspondence of th e discovered biclusters
to th e a ctu al gene functional m odules.
function-ally classifying unclassified ORFs. We then develop a semi-supervised classification
strategy based on BUBBLE and attem p t to classify unclassified yeast O R Fs using
three different microarray datasets. We examine a shortlist of our m ost significant
classifications and attem p t to validate them using protein sequence inform ation and
existing ‘wet lab ’ experimental evidence.
C h a p ter 2
M icroarray G ene E xpression
A n alysis
2.1
In tr o d u ctio n : M icroarray A n a ly sis
Microarray analysis refers to a recently developed high through-put experimental technique
for measuring gene expression within an organism. The advantage of this new approach
is its increased capacity over previous m ethods, enabling the expression of thousands of
genes to be measured within the one experiment.
The first microarray experiment was performed in 1995 by Patrick Brown and col
leagues at Stanford and was rather more modest in scale. Their prototypic microarray
was used to measure the activity of 45 genes from
Arabidopsis thaliana
(a small flowering
plant used as a model in plant biology) over different cell tissue samples (Schena et al.,
1995). This work dem onstrated th a t the expressions of many genes could be examined
simultaneously within one experiment. The parallel aspect of this experiment is im portant
as it allows one to identify genes which are expressed, and possibly regulated, together
under specified growth conditions. It was suggested at the time th a t the number of genes
th a t could be interrogated was only limited by the technology, and th a t future experi
ments may be able to m onitor the entire expression repertoire (the whole genome) of an
organism.
3500
3000
2500
£
2000
0) Q .S.
1500
1000
500
0
N ^ CV CP* C v Cr^ Cy^ Ct^ Cy^
Year
F ig u r e 2.1: The number of papers published annually th a t refer to ‘gene expression
m icroarrays’.
can be seen in Figure 2.1.
These figures are taken from the Pubmed^ database. The chart gives some idea of
the extent of this rapid increase in studies involving m icroarray experiments. Initially
the high cost of this new technology and technical difficulty of the experim ent was pro
hibitive. However, by the late 1990’s, fueled in p art by contem porary advances in genomic
sequencing technology, microarrays were gradually becoming the experim ent of choice for
researchers wishing to study gene expression.
As predicted too, the scale of microarray experiments has greatly increased since their
initial inception. In 1997 the first whole genome microarray analysis was carried when the
expression of th e 6116 genes of yeast,
Saccharomyces cerevisiae, was measured on a single
microarray (DeRisi et al., 1997). By 2003 the technology had advanced sufficiently to
allow the expression of all 26,000 genes of the whole human genome to be analysed within
a single m icroarray experiment. Microarrays have been used to study gene expression
within a myriad of different organisms from bacteria to man. The scale and the parallel
nature of the experiments enables us to investigate the global regulation of gene expression
as well as the functions of individual genes.
Although the objectives of microarray experiments vary greatly they can generally be
divided into three main aims:
1
F u n ctio n a l C la ssification o f U n la b elle d G enes:
Using microarray analysis the
function of a gene may be inferred via two methods: (i) Function may be assigned
to a gene
ab initio by identifying the conditions (experimental samples) th a t affect
its expression. This type of analysis is generally known as
differential expression
analysis, (ii) Gene function may also be inferred by comparing the expression of the
gene in question to th a t of other genes of known functions. This may be accomplished
by
supervised classification.
2
Id en tifica tio n o f C o -R eg u la ted G en es (F u n ction al M od u les):
Groups of
genes th a t are expressed in a similar m anner over experimental samples may be
co-regulated to carry out a common function i.e. they may be involved in the same
cellular process or cellular structure. Therefore, identification of co-regulated genes
aids th e elucidation and discovery of functional modules. Identification of groups of
co-regulated genes may be accomplished by
unsupervised classification.
3
C la ssification o f U n la b elled Sam ples:
In the microarray context a sample refers
to the cell or tissue whose gene expression is being analysed. A sample may be from
a specific growth condition (tem perature, chemicals, drugs, time series etc.) or
represent a distinct cell type (normal, diseased etc.). A sam ple’s specific expression
profile may be examined and used to classify the sample. The application most
abim dant in the literature is th a t of the molecular classification of cancer.
2.2
F u n ction al G en om ics
2.2.1
From B lu ep rin t to Function
A living organism is organised in an hierarchical fashion. Higher level organisms span
the full height of this hierarchy being composed organ systems, organs, tissues, cells,
organelles. Simpler organisms such as a single celled am oeba or a prokaryotic bacterial
cell may occupy only the first rung of this hierarchy. The characteristics and function of a
cell itself are defined by its structural and enzymatic proteins and their actions within th a t
cell. A brain cell or neuron produces neurotransm itters; a hair cell produces the protein
keratin to form the hair shaft. So at the lowest level an organism may be defined in terms
of its characteristic set of proteins produced in its cells. The information for making and
O rganism
O rgan
Cell
Organelle (Nucleus)
DNA
F ig u r e 2.2: An organism is composed of a hierarchy of organization.
regulating these proteins is stored within the
nucleus‘s
of the cell on a blueprint. This
blueprint is in the form of a very long double stranded molecule called deoxyribonucleic
acid or DNA. Despite its length DNA is only composed of four types of chemical imits called
nucleotides. Each nucleotide contains one of four bases Adenine, Guanine, Cytosine and
Thymine, abbreviated as A,G,C and T respectively. The double stranded DNA molecule
may be thought of as a ‘zipper’ like structure in th a t it is composed of two complementary
strands where A is always paired with T and G always paired with C, see Figure 2.2.1.
This im portant fact allows reproduction of the entire molecule or replication from just
one strand of DNA and ultim ately allows cells to replicate and organisms to grow and
reproduce. It also allows two complementary strands to recognize each other and bind
(hybridize) in an heterogeneous mixture. This latter fact is fundamental to the microarray
experiment and will be further discussed shortly.
Top Strand
^ I ^ A G C T A G G T G A T T G C C G A T T G C C G • ^ ^ T C C A T C C A C T A A C C G C T A A C G G C
Complementary Bottom Strand
F ig u r e 2.3:
DNA is com posed of a two com plem entary stra n d s of nucleotides.
is term ed a gene. Each gene is com posed of a unique sequence of nucleotides which code
described by th e "Central D ogm a of M olecular Biology’ , see Figure 2.4. In th e first step
in th is process th e ruicleotide sequence is read and tran scrib ed into a m essenger molecule
called m essenger ribonucleic acid, m ore often abbrev iated as m RN A , in a process called
transcription. T his molecule is sim ilar in s tru c tu re to a single stran d ed DNA molecule
except th e base Thym ine is replaced by a sim ilar base called Uracil. T his niR N A th en
tra n s p o rts th e inform ation out of th e nucleus to th e m achinery th a t m akes proteins called
th e ribosom e. T he ribosom e reads th e m RNA m olecule and co n structs a unique string
of m olecules called am ino acids in a j)rocess called
translation. In this process three
nucleotides in the m RNA encode one am ino acid in th e am ino acid sequence. T his string
of am ino acids, which m ay be hundreds of m iits in length, th en folds in on itself to yield
th e th re e dim ensional protein. T h e way in which th is strin g folds depends on th e types
am ino acid in th e strin g which in tu rn d ictates th e stru c tu re and therefore th e function
of th e protein molecule. T he function of some proteins is to regulate and carry out these
processes of tra n sc rip tio n and tra n sla tio n (regulators). G enerally th e function of th e rest
of th e proteins m ay be split into stru c tu ra l and enzym atic. S tru c tu ra l proteins are those
which form th e physical fram ew orks of th e body e.g. k eratin (hair) and collagen (skin) and
enzym atic proteins are those involved in th e life processes e.g. m etabolism an d respiration.
All cells in an organism contain th e full com plem ent of genes b u t only c e rtain genes
are expressed, producing proteins. These expressed genes alone determ ine th e ty p e of cell
th a t develops, w hether it be a muscle, skin or nerve cell etc. To gain an insight into a cell’s
specific fim ction one m ay directly analyse th e types and am ounts of proteins expressed in
th a t cell. However, as it tu rn s out, one can m ore easily exam ine th e types and am ounts
of th e interm ediary m RN A molecule present in a cell. So by m easuring th e levels of the
different types of m RN A produced in a cell one m ay form a detailed picture of th e functions
^Sonie genes encode ‘splice variants' i.e. different proteins derived from splicing together different parts o f th e sam e gene.
Transcription
I
TranslationDNA
mRNA
Amino Acids
Functional Protein
F ig u re 2.4:
The Central Dogma of Molecular Biology. DNA is transcribed to mRNA
which is in turn translated to a string of amino acids. These amino acids then fold to form
the functional protein.
and nature of th a t cell^. This is the key point of this section and the premise upon which
m icroarray gene expression analysis technology is founded. Next we will look at how w^e
read the nucleotide sequence of a genome, locate the genes and characterize their function.
2 .2 .2
S e q u en cin g an d G en e F u n ctio n a l A n n o ta tio n
Before w^e can identify the functions of the genes in a genome it is first necessary to read the
genome and locate the genes. This process is known as genome sequencing and, naturally
enough, it is easier to sequence smaller genomes such as those of viruses or bacteria.
In 1977 a bacterial virus, called bacteriophage phi-x]74, became the first organism to
have its genome, of 5386 base pairs (bp), fully sequenced. Thirteen years elapsed before
the first non-viral organism was sequenced completely. In July 1995, Fleischmann and
colleagues reported the completion of Haemophilus influenzae (l,830,137bp), the first free-
living organism to be sequenced.
At the tim e of the writing of this chapter the count of sequenced genomes stands
at an impressive 394 organisms. W ith many thousands of sequencing projects currently
underway this number is increasing on an almost daily basis. The list includes a few
higher multicellular organisms, such as the roundworm,
Caenorhabditis elegans, the fruit
fly.
Drosophila melanogaster, and the mouse,
Mus musculus, and hundreds of species of
microbes. A recent enough addition is th a t of Homo sapiens, the first draft of which was
completed by the Human Genome Project and published in 2001 (Lander & et al., 2001).
Once a genome is sequenced we must then look for the protein coding genes. This
search is analogous to trying to isolate the sentences in a book with no spaces. To do th a t,
we might first look for a capital letter to identify the start of a sentence and then identify
the full stop th a t signifies the end. Similarly, there are certain features within a genomic
sequence th a t delimit the boundaries of a gene’s reading frame. For example, typically the
reading frame of a gene begins with an ‘ATG’ (start codon) and ends with ‘TAG’, ‘TAA’,
or ‘TG A ’ (stop codon) , the coding sequence between these markers is know'n as the open
reading frame (ORF) of the gene. Usually this ORF codes for a specific protein and is
referred to as a gene. These ORFs are arranged into "chapters’ called chromosomes, which
are very long continuous pieces of DNA. These chromosomes typically contain thousands
of genes and arrange in homologous pairs. The number of chromosomes may differ between
species, the human genome contains 23 pairs of chromosomes. Once these ORFs have been
Protein X
A T G C G T A G C T a 1 u A G T IG G A A T G C C A G T A C C A T G A C G A T G A C A G T A T A aaC A G A T A C A G A T A C A C A T A T A C A C A C A A C C C A A A A G C G T T A T T A I AO A TG A C G A
Gene X
Chromosome
F ig u re 2.5: The DNA is composed of several chromosomes which are in tu rn composed
of discrete units called genes. Each gene holds the information needed to produce one
protein. The boundaries of genes are delimited by specific nucleotide sta rt (green) and
stop (red) codons.
looking a t phenotypic change in response to a genetic change. A nother way to analyse gene
function, w ith o u t tinkering w ith th e system , is to observe th e changes in gene expression
in response to a specified change in grow th conditions or cell type.
As m entioned in th e last section we can do th is by directly exam ining th e protein con
te n t or indirectly by m easuring th e level of m R N A present in a cell. M icroarray technology
allows us to m easure th e m RNA from th o u san d s of genes sim ultaneously over specified
sam ples e.g. different grow^th conditions or known cell types. Using th is inform ation we
can not only elucidate th e functions of individual genes b u t also m odel th e groups of
genes th a t act to g ether w ithin functional m odules. Before we illu strate th e m icroarray
ex p erim ent itself, in section 2.3, we shall outline how th is functional inform ation is stored.
2 .2 .3
F u n c tio n a l D a ta b a se s
As O R F s are investigated to discern w h ether or not th ey represent a functional gene, and
ex perim ental papers are published, th e resu lta n t fim ctional inform ation is stored w ithin
central repositories. W hen this inform ation is deem ed to be sufficiently su p p o rtiv e of a
function, a form al functional classification ensues. Because of th e stru c tu re of living o rgan
ism s these d a ta b a ses are also hierarchical in architecture. One such functional d a ta b a se is
ru n by G ene O ntology (GO) C onsortium . In th is is a d a ta b a se of genes and gene pro d u cts
are described by a controlled vocabulary.
A n other functional d ata b a se which is used in section 4.5.3 is th e K yoto Encyclopaedia
of Genes and G enom es (K EG G ) (K anehisa
k.
G oto, 2000). T his d a ta b a se contains an
interface to analyse th e correspondence of groups of genes to known pathw ays. A lthough
GO is com prehensive th e an n o ta tio n s som etim es lack specificity, each a n n o ta tio n having
a th re e descriptions under the headings - biological process, cellular com ponent and mole
cular function. T h e su b ject of how to calculate th e sim ilarity betw een GO term s is also
a research area in itself. K E G G , on th e o th er hand, is less com prehensive only covering
well described, established pathw ays.
prehen-sive M IPS O RF annotations were later adopted and employed in the main evaluations in
C hapters 5 and 6. Also used in C hapter 6 is the Saccharomyces Genome D atabase (SGD).
Unlike the other databases mentioned above, the SGD contains information on nucleotide
and protein sequences and information on unclassified yeast ORFs. The information on
unclassified ORFs is utilized to support our functional analysis in C hapter 6. In the next
section we now discuss the microarray gene expression analysis experiment in detail.
2.3
T h e M icroarray E x p erim en t
2.3.1
T h e P rem ise B eh in d M icroarray T echnology
To analyse gene expression via the measurement of mRNA levels the to tal mRNA first
needs to be isolated from the cell samples we wish to investigate. This is achieved by
the standard mRNA extraction protocol. However, as mRNA is easily degraded in the
environm ent, it is usually first ‘reverse transcribed’ into its more stable, single stranded
DNA equivalent. This DNA is referred to as cloned DNA (cDNA) as it is a copy of the
original mRNA transcript. At this point we have an heterogeneous m ixture of different
cDNAs th a t represent all the genes th a t were being expressed in the cell or tissue at
the tim e of extraction. We now need a way then to specifically measure the amount of
each type of cDNA present in this sample. We achieve this by exploiting the natural
tendency of single stranded DNA molecules to recognize and uniquely hybridize to their
com plem entary strands in an heterogeneous m ixture (as described in section 2.2).
Microarray
Attach p r(* e s from
Unique probes in each spot will attach to
cDNA library
complementary gene sequence
F ig u r e 2.6: M icroarray Preparation. The sequences of the genes whose expression we
wish to investigate are selected from the sequence library and attached to the m icroarray
shde.
metliods. The premise however is the same - th a t we can detect the am ount of cDNA
present (and therefore the expression level of the gene) by measuring the light intensities
of the attached fluorescent markers. This allow's us to determine the genes expressed in
the cell from a certain sample. The interesting step however, conies when w'e compare the
expression of a gene across multiple samples i.e. varying growth conditions, time points or
cell types. If we compare two samples, one which represents the gene expression of a cell
growTi under normal conditions to another sample that represents a cell grown under ad
verse conditions, we may detect differences in gene expression in response to the differing
growth conditions. If a gene shows increased expression under the new conditions it is said
to be up-regulated and if it shows reduced expression it is said to be down-regulated. The
change in gene expression occurs in response to the change in em ironment and enables
the cell to adapt to this change. The nature of our experimental condition dictates the
nature of this adaption and may provide evidence as to the function of the gene. For
example, if our sample represents a cell grown at high a tem perature, genes th a t show
up-regulated expression levels may produce proteins whose function is to protect th e cell
from tem perature damage (heat shock proteins).
Sample A
Microarray Experiment
mRNA
CDNA
qqojaa
U
e
§g
QD
Sample B
Q
mRNA
cDNA
Addition of Cy3
(Red Dye)
C o m p e titiv e m