Multitask Learning for Adaptive Quality Estimation
of Automatically Transcribed Utterances
Jos´e G. C. de Souza?†, Hamed Zamani‡, Matteo Negri†, Marco Turchi†, Daniele Falavigna† ?University of Trento, Italy
†Fondazione Bruno Kessler, Italy
‡School of ECE, College of Engineering, University of Tehran, Iran {desouza, negri, turchi, falavi}@fbk.eu
Abstract
We investigate the problem of predicting the quality of automatic speech recognition (ASR) output under the following rigid con-straints: i) reference transcriptions are not available,ii)confidence information about the system that produced the transcriptions is not accessible, andiii)training and test data come from multiple domains. To cope with these constraints (typical of the constantly increas-ing amount of automatic transcriptions that can be found on the Web), we propose a domain-adaptive approach based on multitask learning. Different algorithms and strategies are evaluated with English data coming from four domains, showing that the proposed ap-proach can cope with the limitations of previ-ously proposed single task learning methods.
1 Introduction
The variety of applications for large vocabulary speech recognition technology (LVCSR) is rapidly growing. For instance, automatic transcriptions are now used, either as-is or as rough material to be checked and corrected by humans, for captioning and subtitling DVD movies, Youtube videos, TV programs and recordings in noisy environments such as meetings and teleconferences. To enable fur-ther integration in these and ofur-ther scenarios, the im-provement of the core automatic speech recognition (ASR) technology should go hand in hand with the development of evaluation methods adequate to ad-dress new needs and constraints. Indeed, the stan-dard evaluation protocol, based on computing the
word error rate of transcription hypotheses against reference transcripts,1 is not always a viable
solu-tion.
In terms of needs, the aforementioned appli-cations call for efficient and replicable evaluation methods suitable for real-time processing. While the availability of manually-created reference tran-scripts is a core ingredient for system development, tuning and lab testing, their use for on-field evalu-ation (i.e. during the actual use) is impractical for obvious reasons (i.e.the need of a quick response).
In terms ofconstraints, the problem is that ASR technology is often used as a black-box, that is, with-out any knowledge of how the transcriptions are gen-erated.2 This calls for techniques capable to
esti-mate ASR output quality under the rigid constraint of having, as a basic source of information, only the spoken utterance (the acoustic signal) and the tran-scription itself. Indeed, the invaluable information provided by current confidence estimation methods (e.g. word posterior probabilities (Evermann and Woodland, 2000; Wessel et al., 2001), consensus de-coding (Mangu et al., 2000) and minimum Bayes-risk decoding (Xu et al., 2010)) is not accessible when evaluating the output of an unknown system.
1The word error rate (WER) is the minimum edit distance
between an hypothesis and the reference transcription. Edit distance is calculated as the number of edits (word insertions, deletions, substitutions) divided by the number of words in the reference.
2For instance, as announced by Google, in 2012 about
157 million YouTube videos in 10 languages already fea-tured captions generated by a black-box ASR system (source: http://techcrunch.com/2012/06/15/ youtube-launches-auto-captions-in-spanish/).
To cope with these issues, Negri et al. (2014) proposed a reference-free ASR quality estimation
(QE) method capable to operate both in a glass-box (i.e. having access to confidence information) and in a black-box fashion (i.e. without any knowledge about the ASR system’s inner workings). According to the authors, despite the promising evaluation re-sults, the supervised learning approach adopted has a main limitation: the degradation in performance when models are trained on non-homogeneous data that comes from different domains, speakers, or sys-tems. However, although empirical evidence of this limitation is provided, the robustness of ASR QE systems to the heterogeneity of training and test data is left as an open issue.
Filling this gap, which is the goal of this paper, would be a significant step towards real-time ASR output evaluation, and its seamless integration in a number of application frameworks. Along this di-rection, we propose and evaluate a supervised do-main adaptation technique based onmultitask learn-ing(Caruana, 1997). Our approach aims to exploit training data coming from different “domains” (in a broad sense, e.g. different genres, speakers, top-ics, styles, etc.) and to obtain ASR QE models that are robust to differences with respect to the test data. Experiments are carried out with English data com-ing from four domains, and by comparcom-ing different algorithms and strategies.
Overall, our contributions can be summarized as follows:
• Multitask learning (MTL) is investigated for the first time in the ASR QE scenario, as a way to cope with the dissimilarity between training and test data coming from multiple domains.
• The QE problem is approached both as a re-gression (assignment of real-valued quality la-bels) and as a binary classification task (as-signment of ‘good’/‘bad’ labels according to a given, arbitrary WER threshold). The latter task is introduced as a preliminary study.
• Results are thoroughly analyzed, considering both the amount of training data coming from the different domains and the relative distance between their distributions.
2 Related Work
In the ASR field, most prior works that address the reference-free estimation of output quality fall into the confidence estimation (CE) framework. In this framework, the reliability of a transcription is es-timated from the system’s standpoint, that is, as a function of the process that generated the transcrip-tion (Sukkar and Lee, 1996; Evermann and Wood-land, 2000; Wessel et al., 2001; Sanchis et al., 2012; Seigel, 2013, inter alia). In CE, the information available to the estimator covers all the aspects of the decoding process (e.g.word posterior probabili-ties, n-best lists, hypotheses density, language model scores). Although related to our problem, CE hence builds on a strong assumption (i.e. the ASR system is known), which does not hold in many situations.
Quality estimation, instead, operates in the least favorable condition in which, besides the lack of ref-erences, the ASR system is regarded as a “black-box”. To our knowledge, the study proposed in (Ne-gri et al., 2014) is the most relevant related work along this direction. In their investigation, the au-thors run a set of experiments aimed to predict the WER of automatically transcribed utterances in dif-ferent testing conditions (by varying the distance be-tween training and test data), with different state-of-the-art learning algorithms (all for regression), and with different groups of features (the so called “black-box” and “glass-box” feature groups). The major problem emphasized in their analysis is the strong dependency between QE models and the de-gree of homogeneity of training and test data. From the application perspective, this is a severe limita-tion since (as in any other supervised learning set-ting) the similarity of training and test sets is a strong requirement that should be bypassed (possibly with minimal loss in performance). This issue, which has not been addressed yet, is the starting point of our investigation.
labels based on a fixed, application-dependent qual-ity criterion defined a priori (a threshold set on train-ing data). Since the way to present the quality esti-mates can have interesting effects on their practical use, the impact of the aforementioned learning prob-lem on a supervised classification setting is another aspect that deserves investigation and motivates our work.
3 Multitask Learning for Adaptive ASR Quality Estimation
The problem of dealing with different distributions between training and test data is broadly investi-gated by the machine learning community. In par-ticular, approaches for dealing with domain drift are proposed within the scope oftransfer learning, whose aim is to explore knowledge from one or more source tasks (henceforth, we use the terms do-main and task interchangeably) and apply it to a tar-get task (Pan and Yang, 2010). In this paper we use a transfer learning technique calledmultitask learn-ing(MTL), which explores domain-specific training signals of related tasks to improve model generaliza-tion (Caruana, 1997).
MTL is an inductive transfer method that assumes that the tasks are related and share a certain struc-ture that allows knowledge transfer. In early works, for instance, these shared structures are the hid-den layers of a neural network (Caruana, 1997).3
The authors showed that MTL improves over ing each task in isolation (called single task learn-ing, STL henceforth) for different problems. Sev-eral approaches to MTL have been proposed and each makes different assumptions about the struc-ture shared among the tasks. In this work we ex-plore three different MTL algorithms that deal with task relatedness in different ways.
Before defining each one of the three approaches, we introduce some basic notation previously used by Chen et al. (2011). In MTL there are K ∈ N
tasks and each task k ∈ [1, K]hasmk training
in-stances {(x1, y1), . . . ,(xmk, ymk)}, withxi ∈ Rd
where d is the number of features and yi ∈ R is
the output (the response variable or label). For each
3Another intuitive example of transferable knowledge is the
fact that, for some domains, a fraction of the extracted features can show a correlated behavior.
task, the input features and labels form two different matrices X(k) = [x1,(k), . . . ,xmk,(k)]and Y(k) = [y1,(k), . . . , ymk,(k)], respectively. The weights of
the features for all tasks are represented by matrix
W, where each column corresponds to a task and each row corresponds to a feature. The function
L(W,X,Y) is the loss function defined for each algorithm. We work with two loss functions:
• Least squares (for regression), defined as
(XT
(k)Wk−Y(k))2, wherekis the task
identi-fier andWkis thek-th column ofW;
• Logistic Regression (for classification), defined aslog(1 + exp(−Y(k)XT(k)Wk)).
MTL Lasso. This algorithm extends the idea of
the Lasso (Tibshirani, 1996) to the MTL setting. In MTL Lasso the `1-norm (the sum of the absolute
values of the weights vector, given by Pd
i=1|wi|) is
applied to all the tasks at once (the||W||1
compo-nent in Eq. 1). The λ ∈ [0,1]parameter controls the level of regularization applied to the model. In other words, the sparsity of the predicted model is controlled viaλwhich weights the `1-norm across
all tasks.
min
W K
X
k=1
L(Wk,X(k),Y(k)) +λ||W||1 (1)
MTL L21. This algorithm (Argyriou et al., 2007)
learns a low-dimensional representation of the tures across tasks, and induces sparsity on the fea-ture weights for all the tasks at the same time. This is achieved through the use of a group regularizer that penalizes the weights matrixW with the `2,1
-norm (Eq. 2). This -norm is defined as ||W||2,1 = d
P
i=1||Wi||2, wheredis the number of features and Wi is the i-th row of W. It is obtained by first
computing the2-norm of each row inW (the fea-tures) and then computing the 1-norm over the re-sulting vector. The2-norm of a vector is given by
||x||2 = qPix2i. The parameterλ ∈ [0,1]
min
W K
X
k=1
L(Wk,X(k),Y(k)) +λ||W||2,1 (2)
Robust MTL. This algorithm does not assume
that all the tasks share the same feature representa-tion as the previous two algorithms do (Chen et al., 2011). Moreover, RMTL uses two different struc-tures: one for grouping related tasks to share knowl-edge; the other for identifying irrelevant tasks and keeping them in a different group that does not share information with the first one. This is to cope with situations in which, since tasks are not related, neg-ative transfer of information across tasks might oc-cur, thus harming the generalization of the model. The algorithm approximates task relatedness via a low-rank structure and identifies outlier tasks us-ing a group-sparse structure (column-sparse, at task level). RMTL minimizes the expression described in 3. It employs a non-negative linear combination of the trace norm (the task relatedness componentL) and a column-sparse structure induced by the `1,2
-norm (the outlier task detection componentS). If a task is an outlier it will have non-zero entries inS.
min
W K
X
k=1
L(Wk,X(k),Y(k))+λl||L||∗+λs||S||1,2 (3)
In Eq. 3Wis subject toL+S, where||.||∗is the
trace norm, given by the sum of the singular values
σi of W, and ||S||1,2 is the group regularizer that
induces sparsity on the tasks. It is obtained by first computing the`1-norm over the columns ofW and
then applying the`2-norm over the resulting vector.
Theλlandλs parameters control the level of regu-larization ofLandS, respectively.
All the MTL algorithms presented in this section are linear, with different regularization terms. While RMTL is only defined for regression, the other algo-rithms are defined for both regression and classifica-tion.
4 Experimental Setting
Our experiments aim to measure the capability of MTL methods to learn across different domains. To this aim, the algorithms4 previously described are
4In our experiments we used the implementations available
in the Malsar toolkit (Zhou et al., 2012)
compared with the STL baseline, both in regression and in binary classification. Given a set of(signal, transcription, WER)tuples as training instances, our task is to label new unseen (signal, transcription)
test pairs with a WER prediction (regression mod-els) or with a good/bad tag (classification modmod-els) depending on the quality of the transcription.
In classification, the class boundary is defined a priori, according to an arbitrary threshold τ set on the WER of the instances: those with aW ER ≤τ
will be considered as positive examples while the others will be considered as negative examples. Dif-ferent thresholds can be set to experiment with test-ing conditions that reflect a variety of application-oriented requirements. We work at one extreme, in which a value ofτ close to zero (0.05) emphasizes systems’ ability to precisely identify high-quality transcriptions (those withW ER≤τ). Any applica-tion that requires precise judgments to isolate high-quality ASR output can potentially benefit of such optimization (e.g.data selection for acoustic model-ing usmodel-ing a QE-based active learnmodel-ing model). The investigation of other thresholding schemes, how-ever, is certainly an aspect that we want to explore in the future.
The small value ofτ selected produces a skewed distribution of classes, with a ratio of good to bad labels across the four domains of about 75% “good” and 25% “bad”. To cope with this issue, we use a sample weighting technique while training the clsification models (Veropoulos et al., 1999). We as-sign a weight w to each of the training instances, computed as the inverse of its class frequency in the training set. In other words, w is obtained by di-viding the total number of training samples by the number of training samples belonging to the class of the given utterance.
4.1 Data
News Legal Weather TED Total dur. (min) 150 338 108 340
# running words 26,282 53,846 23,722 41,545
# utterances 737 2,922 1,290 2,245
# speakers 178 95 36 28
Avg. utt. dur. (s) 12.2 6.9 5.0 9.1
[image:5.612.72.303.60.142.2]WER 17.7 20.4 11.9 22.9
Table 1: Some characteristics of the four domains.
News. We use the HUB45 corpus, which contains
104 hours of broadcasts from different television and radio networks. We selected the 1999 test set of the DARPA Hub-4 evaluation, consisting of two record-ings acquired in TV studios and containing speech of professional speakers reading news.
Legal. This audio database6 contains recordings
of European Parliament members speaking in ple-nary sessions, as well as recordings of interpreters (non-native speakers). Speech is hence quite sponta-neous, and a relevant level of reverberation is present due to the usage of table-mounted microphones. The data that we used for our experiments are both the English EPPS development (dev06) and evaluation (eval07) sets of the 2007 TC-STAR ASR evaluation campaign (Hamon et al., 2007).
Weather. This dataset is formed by recordings of
weather reports broadcasted by the BBC English TV channel, and contains both national and local weather forecasts. There are roughly 50 native speakers and the speech is delivered very quickly. Although the speakers are native and the recordings are performed in a controlled environment, there are some hesitations, grammar errors or lengthy formu-lations in the recordings which are corrected in the captions (which can thus be considered as loose ref-erence transcripts (Mohr et al., 2013)).
TED. This dataset contains audio recordings of English speakers (28 different talks) and was used within the IWSLT 2013 evaluation campaign (Cet-tolo et al., 2013). This domain presents large vari-ability of topics (hence a large, unconstrained vocab-ulary), presence of non-native speakers, and a rather
5distributed by the Linguistic Data Consortium and
avail-able at https://catalog.ldc.upenn.edu/docs/ LDC2000S88/
6http://catalog.elra.info/product_info.
php?products_id=1032
informal speaking style.
Given their diverse nature, the four domains present a big challenge both for ASR and QE sys-tems. From Table 1 it is possible to grasp several differences among them. One aspect that reflects such differences is the WER of the ASR system we used to transcribe the utterances (described in Sec-tion 4.2). The lowest WER is for Weather, a do-main in which the speech is planned. This is also the domain with the shortest average utterance dura-tion (5 sec.), the lowest number of speakers (36) and the lowest number of running words (23,722). The higher WER achieved on the other domains is due to the more challenging conditions posed by each of them. TED and News include speeches about un-constrained topics, and their average utterance dura-tions tend to be longer than for the other two do-mains. News is the shortest domain in duration and the smallest in number of utterances (150 min. for 737 utterances), but has the highest number of speakers. This means that there are very few utter-ances for each speaker, in average, and that both the ASR and the QE system must cope with the differ-ences in speech for all these subjects. Legal presents the second largest number of speakers, both native and non-native, using a specific terminology on a varied number of topics.
4.2 ASR System
auto-matic transcription of the data presented in Table 1 is generated with the corresponding word and time boundaries that are aligned with the reference utter-ances. This allows us to compute the utterance WER and the features for the various prediction models.
4.3 Features
Our models are trained with the same 52 “ black-box” features proposed by Negri et al. (2014), which can be categorized in three groups: Signal, Hybrid and Textual. The first group aims to capture the diffi-culty to transcribe the input and is extracted by look-ing at the signal segment as a whole. Hybrid features provide a more fine-grained way to capture the tran-scription difficulty, by linking the signal to the out-put transcription. Textual features aim to capture the plausibility/fluency of a transcription considering its surface word information.
4.4 Evaluation Metrics
Regression. Our regression models are evaluated
in terms of mean absolute error (MAE). The MAE, a standard error measure for regression, is the average of the absolute difference between the predictionyˆi
of a model and the gold standard responseyifor all instances in the test set. As it is an error measure, lower values indicate better performance.
Classification. To handle the imbalanced class
distribution, and equally reward the correct classi-fication on both classes, our evaluation is carried out in terms of balanced accuracy (BA – the higher the better), which is computed as the average of the ac-curacies on the two classes (Brodersen et al., 2010). When the distribution of classes is balanced, BA is equal to the accuracy metric.
4.5 Baselines
Regression. We compare the MTL methods
against two baselines. The first one, simple but often hard to beat for regression models, is computed by labeling all the test instances with the Mean WER value calculated on the training set. The second baseline is an STL algorithm trained on data from the target domain. The algorithm that we used (STL Elastic henceforth) is the elastic net (Zou and Hastie, 2005). Parameter estimation is performed with 5-fold cross-validation.
Classification. In this setting we also consider two
baselines. The first one (Majority) is computed by labeling all the test instances with the most frequent label in the training set and, by definition, corre-sponds to a score of 0.5 in terms of balanced accu-racy. The second classification baseline is the logis-tic regression (STL LogReg henceforth), also known as maximum entropy algorithm (Hastie et al., 2009). We perform parameter optimization for LogReg us-ing stratified 5-fold cross-validation in a randomized search process (Bergstra and Bengio, 2012).
For both STL baselines we selected algorithms7
that induce linear models and use the same loss func-tions (least squares for regression and logistic re-gression for classification) of the MTL methods.
5 Results and Discussion
To mitigate the effect of having considerably differ-ent amounts of training data in the four domains, and equally weight their contribution to the learn-ing task, all our models (STL and MTL) are trained using the same number of instances from all the do-mains and, at most, half of the data available for the smallest domain, News (i.e.362 instances). To ana-lyze performance variations with different amounts of data, we create subsets of the 362 instances, for 10 different sizes ranging from 10% to 100% of the instances for each domain.8 We repeat this process
30 times by randomly shuffling all the data avail-able for each domain. For each of the resulting learning curves, the plots in this section present the confidence intervals9 (at 95%) for the 30 different
train/test splits.
In addition to the STL model trained only on in-domain data, we also experiment with an STL model trained on the concatenation of the training data of all domains. Its results are, on average, statistically comparable to, or worse than, STL in-domain for both regression and classification.
Regression. Among the three MTL regression
al-gorithms, RMTL achieves the best results in all our
7We used the implementations available in Scikit-learn
(Pe-dregosa et al., 2011).
8That is, for instance, with 10% of training data from four
domains, the total amount of instances is 144 (36*4).
9The confidence intervals are used to show whether there
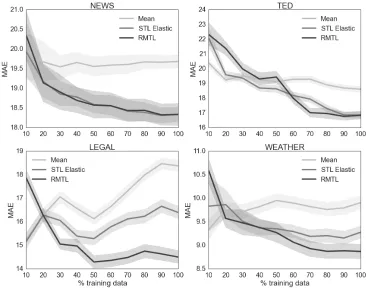
Figure 1: Learning curves for the regression models evaluated on the four domains. The evaluation metric is MAE (↓).
tests. This suggests that its capability to handle do-main divergence, thus avoiding negative transfer, is required to increase performance. For the sake of visualization, in the plots in Figure 1 we hence omit the curves of the other MTL methods, keeping only those of RMTL and the two baselines.
As shown in the figure, for the Legal domain, RMTL results are better than those of both the base-lines (lower MAE) even with 30% of the data and, except in one case (40% of the data), the improve-ment over STL (always the stronger baseline) is sta-tistically significant. For Weather and TED, the im-provement is less evident: more data are required to outperform the STL baseline (respectively 50% and 60%), the improvements are not always statisti-cally significant and, for TED, the MAE results con-verge to those of STL with 100% of the data. For the News domain RMTL’s performance is always com-parable to STL. An interesting behavior can be ob-served in the Legal domain, in which the Mean base-line degrades as we add training data. This suggests that, even internally to the domain, training and test labels have very different distributions. A smaller
degradation is observed for the STL model, which improves over the Mean baseline as it also uses the information captured by the features. The two base-lines, however, assume that both training and test data come from similar distributions. Instead, by taking advantage also of the knowledge transferred from the other domains, RMTL allows to cope with the differences between training and test.
Classification. In this setting we compare the
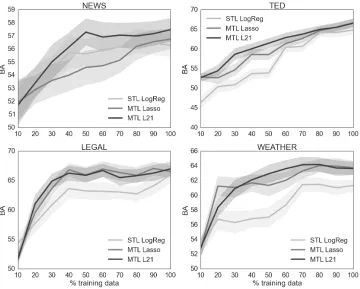
statis-Figure 2: Learning curves for the classification models evaluated on four domains for WER scores with threshold at 0.05. Evaluation is calculated with balanced accuracy (↑).
tically significant only for TED. For the News do-main, similar to the regression setting, the improve-ment of MTL over STL is less evident. Indeed, only L21 outperforms the single task baseline but the dif-ference is not statistically significant.
Our classification results can be explained taking into consideration the distribution of positive and negative instances in each domain. Weather, for which MTL always outperforms STL, has the most balanced distribution (35% good and 65% bad). In the other three domains, instead, the proportion of negative samples is always above 77%. Although in this penalized condition all algorithms are supported by sample weighting, MTL seems to better exploit this technique when the target domain is balanced.
The challenging nature of the data we are using (described in Section 4.1) is corroborated by the moderate performance achieved by STL. Although it is trained with in-domain data, the best STL clas-sification model (for the Legal domain) does not ex-ceed a BA of 66%. In this difficult scenario, the use-fulness of MTL is demonstrated by its capability of
reaching the best performance of STL with smaller amounts of data in most of the cases (e.g. 30% of the data for the Legal domain).
Domains divergence. To further analyze the
per-formance of MTL in regression and classification, following previous works on MTL and domain adaptation in computer vision (Costante et al., 2014; Samanta et al., 2014), we use maximum mean dis-crepancy (MMD) as a measure of divergence be-tween domains. MMD is an effective way to com-pare two multivariate distributionspandq by mini-mizing the difference in Reproducing Kernel Hilbert Space (RKHS) between the means of the projected distributions (Gretton et al., 2012). It is defined as
supf∈FEp[f(p)]−Eq[f(q)]wherepandqare points
sampled i.i.d. from two domains andf(.)is a con-tinuous bounded function onpandq (usually a unit ball function). We measure the pairwise divergences among the domains described in Section 4.1 using the features extracted and a radial basis function ker-nel. The divergences are presented in Figure 3.
[image:8.612.127.487.60.349.2]di-vergent pair is News-Weather, which is followed by News-Legal. The distance between News and the other domains indicates that, when it is used as target, knowledge transfer from the other domains might be problematic. In fact, looking at the re-sults obtained by classification and regression mod-els for News, we notice that none of the MTL meth-ods achieves significant improvements over the STL baselines. Furthermore, the RMTL regression learn-ing curve (Figure 1) for News shows that RMTL fol-lows the same curve of STL, meaning that it is able to handle the high divergence between News and the other domains and hence, it learns mostly from in-domain data.
[image:9.612.90.300.425.582.2]In general, the divergence measurements between the domains are relatively high (the values are closer to 1 than to 0). This is not surprising given the intra- and inter-domain variability of speakers and topics, the different conditions in which speech was recorded, and the WER differences across domains. However, the interesting aspect evidenced by the measurements is that MMD allows to successfully approximate such domain differences (and, likely, other more implicit diversity indicators), thus being a useful instrument to measure domain relatedness.
Figure 3: Domains divergence given by MMD (0 means similar and 1 means dissimilar).
6 Conclusion
We presented a supervised approach to ASR qual-ity estimation aimed to cope with large differences between training and test data. To achieve
robust-ness and adaptability to such differences, we ex-ploited the capability of multitask learning, which allows QE models to make the best use of train-ing data comtrain-ing from multiple domains by trans-ferring knowledge across them. The MTL learn-ing paradigm was applied both in regression mode (WER prediction) and, in a preliminary inves-tigation, for binary classification (assignment of ‘good’/‘bad’ quality labels). In both settings, we ex-perimented with different amounts of English data coming from four very diverse domains (different genres, speakers, topics, and styles).
Our results indicate that MTL, which we used for the first time in ASR QE10, is able to take advantage
of data coming from such heterogeneous domains and to significantly improve over single-task learn-ing baselines both in regression and in classification. Although the extent of the improvement depends on the divergence between the domains (a major is-sue for any supervised learning task), our results show that in the worst case MTL performance con-verges to the results of single-task learning. Overall, by suggesting a way to overcome the main limita-tions of previous approaches, our study opens in-teresting research avenues towards reference-free, system-agnostic and real-time ASR output evalua-tion.
Acknowledgments
The work of Hamed Zamani was supported by the FBK-HLT Summer Internship Program 2014.
References
[Argyriou et al.2007] Andreas Argyriou, Theodoros Ev-geniou, and Massimiliano Pontil. 2007. Multi-task feature learning. InAdvances in Neural Information Processing Systems 19, pages 41–48.
[Bergstra and Bengio2012] James Bergstra and Yoshua Bengio. 2012. Random Search for Hyper-Parameter Optimization.Journal of Machine Learning Research, 13:281–305.
[Brodersen et al.2010] Kay Henning Brodersen, Cheng Soon Ong, Klaas Enno Stephan, and
10Previous works (Cohn and Specia, 2013; C. de Souza et
Joachim M. Buhmann. 2010. The balanced ac-curacy and its posterior distribution. InProceedings of the 2010 20th International Conference on Pattern Recognition, ICPR ’10, pages 3121–3124.
[C. de Souza et al.2014a] Jos´e G. C. de Souza, Jes´us Gonz´alez-Rubio, Christian Buck, Marco Turchi, and Matteo Negri. 2014a. FBK-UPV-UEdin participa-tion in the WMT14 Quality Estimaparticipa-tion shared-task. In Proceedings of the Ninth Workshop on Statistical Ma-chine Translation, pages 322–328.
[C. de Souza et al.2014b] Jos´e G. C. de Souza, Marco Turchi, and Matteo Negri. 2014b. Machine Transla-tion Quality EstimaTransla-tion Across Domains. In Proceed-ings of the 25th International Conference on Compu-tational Linguistics, COLING ’14, pages 409–420. [Caruana1997] Rich Caruana. 1997. Multitask Learning.
Machine learning, 28(28):41–75.
[Cettolo et al.2013] Mauro Cettolo, Jan Niehues, Sebas-tian Stuker, Luisa Bentivogli, and Marcello Federico. 2013. Report on the 10th IWSLT Evaluation Cam-paign. InProceedings of the International Workshop on Spoken Language Translation.
[Chen et al.2011] Jianhui Chen, Jiayu Zhou, and Jieping Ye. 2011. Integrating Low-rank and Group-sparse Structures for Robust Multi-task Learning. In Pro-ceedings of the 17th ACM SIGKDD International Con-ference on Knowledge Discovery and Data Mining, KDD ’11, pages 42–50.
[Cohn and Specia2013] Trevor Cohn and Lucia Specia. 2013. Modelling Annotator Bias with Multi-task Gaussian Processes: An application to Machine Trans-lation Quality Estimation. InProceedings of the 51st Annual Meeting of the Association for Computational Linguistics, pages 32–42.
[Costante et al.2014] G. Costante, E. Bellocchio, P. Valigi, and E. Ricci. 2014. Personalizing Vision-based Gestural Interfaces for HRI with UAVs: a Transfer Learning Approach. InProceedings of the 2014 International Conference on Intelligent Robots and Systems, IROS ’14, pages 3319–3326.
[Evermann and Woodland2000] G. Evermann and P. C. Woodland. 2000. Large vocabulary decoding and confidence estimation using word posterior probabil-ities. InProceedings of the 2000 International Con-ference on Acoustics, Speech, and Signal Processing, ICASSP ’00, pages 1655–1658.
[Gretton et al.2012] Arthur Gretton, Karsten M. Borg-wardt, Malte J. Rasch, Bernhard Scholkopf, and Alexander Smola. 2012. A kernel two-sample test. Journal of Machine Learning Research, 13:723–773. [Hamon et al.2007] Olivier Hamon, Djamel Mostefa, and
Khalid Choukri. 2007. End-to-End Evaluation of a Speech-to-Speech Translation System in TC-STAR.
In Proceedings of Machine Translation Summit XI, pages 223–230.
[Hastie et al.2009] Trevor Hastie, Robert Tibshirani, and Jerome Friedman. 2009. The Elements of Statistical Learning.
[Lamel et al.2001] Lori Lamel, Jean-Luc Gauvain, and Gilles Adda. 2001. Investigating lightly supervised acoustic model training. In Proceedings of the 2001 International Conference on Acoustics, Speech, and Signal Processing, volume 1 of ICASSP ’01, pages 477–480. IEEE.
[Mangu et al.2000] Lidia Mangu, Eric Brill, and Andreas Stolcke. 2000. Finding consensus in speech recog-nition: word error minimization and other applica-tions of confusion networks.Computer Speech & Lan-guage, 14(4):373–400.
[Mehdad et al.2012] Yashar Mehdad, Matteo Negri, and Marcello Federico. 2012. Match without a Ref-eree: Evaluating MT Adequacy without Reference Translations. In Proceedings of the Seventh Work-shop on Statistical Machine Translation, pages 171– 180, Montr´eal, Canada, June. Association for Compu-tational Linguistics.
[Mohr et al.2013] Christian Mohr, Christian Saam, Kevin Kilgour, Jonas Gehring, Sebastian St¨uker, and Alex Waibel. 2013. Slightly supervised adaptation of acoustic models on captioned bbc weather forecasts. InProceedings of the First Workshop on Speech, Lan-guage and Audio in Multimedia (SLAM), pages 32–36. [Negri et al.2014] Matteo Negri, Marco Turchi, Jos´e G. C. de Souza, and Daniele Falavina. 2014. Qual-ity Estimation for Automatic Speech Recognition. In Proceedings of the 25th International Conference on Computational Linguistics, COLING ’14, pages 1813–1823.
[Pan and Yang2010] Sinno Jialin Pan and Qiang Yang. 2010. A Survey on Transfer Learning. IEEE Transactions on Knowledge and Data Engineering, 22(10):1345–1359.
[Parker et al.2011] Robert Parker, David Graff, Junbo Kong, Ke Chen, and Kazuaki Maeda. 2011. English gigaword fifth edition, june. Linguistic Data Consor-tium, LDC2011T07.
[Samanta et al.2014] Suranjana Samanta, Tirumarai A. Selvan, and Sukhendu Das. 2014. Modeling Sequen-tial Domain Shift through Estimation of Optimal Sub-spaces for Categorization. InProceedings of the 2014 British Machine Vision Conference.
[Sanchis et al.2012] Alberto Sanchis, Alfons Juan, and Enrique Vidal. 2012. A Word-Based Na¨ıve Bayes Classifier for Confidence Estimation in Speech Recog-nition. IEEE Transactions on Audio, Speech and Lan-guage Processing, 20(2):565–574.
[Seigel2013] Mathew Stephen Seigel. 2013. Confi-dence Estimation for Automatic Speech Recognition Hypotheses. Ph.D. thesis, University of Cambridge. [Specia et al.2009] Lucia Specia, Nicola Cancedda, Marc
Dymetman, Marco Turchi, and Nello Cristianini. 2009. Estimating the Sentence-Level Quality of Ma-chine Translation Systems. InProceedings of the 13th Annual Conference of the EAMT, number May, pages 28–35.
[Sukkar and Lee1996] Rafid A. Sukkar and Chin-Hui Lee. 1996. Vocabulary independent discriminative ut-terance verification for nonkeyword rejection in sub-word based speech recognition. IEEE Transactions on Audio, Speech and Language Processing, 4(6):420– 429.
[Tibshirani1996] Rob Tibshirani. 1996. Regression shrinkage and selection via the lasso. Journal of the Royal Statistical Society. Series B (Methodological), 58(1):267–288.
[Turchi et al.2014] Marco Turchi, Antonios Anastasopou-los, Jos´e G. C. de Souza, and Matteo Negri. 2014. Adaptive Quality Estimation for Machine Translation. InProceedings of the 52nd Annual Meeting of the As-sociation for Computational Linguistics (Volume 1: Long Papers), pages 710–720, Baltimore, Maryland, June. Association for Computational Linguistics. [Veropoulos et al.1999] K. Veropoulos, C. Campbell, and
N. Cristianini. 1999. Controlling the sensitivity of support vector machines. In Proceedings of the In-ternational Joint Conference on Artificial Intelligence, IJCAI ’99, pages 55–60.
[Wessel et al.2001] Frank Wessel, Ralf Schluter, Klaus Macherey, and Hermann Ney. 2001. Confidence mea-sures for large vocabulary continuous speech recogni-tion. IEEE Transactions on Audio, Speech and Lan-guage Processing, 9(3):288–298.
[Xu et al.2010] Haihua Xu, Dan Povey, Lidia Mangu, and Jie Zhu. 2010. An improved consensus-like method for Minimum Bayes Risk decoding and lattice combi-nation. InProceedings of the 2010 International Con-ference on Acoustics Speech and Signal Processing, ICASSP ’10, pages 4938–4941.
[Zhou et al.2012] Jiayu Zhou, Jianhui Chen, and Jieping Ye. 2012. MALSAR: Multi-tAsk Learning via Struc-turAl Regularization.