A Study of
Progression in
Irish Higher
A Study of
Progression in
Irish Higher
Education
A report by the Higher Education Authority
October 2010
Mr. Oliver Mooney, Dr. Vivienne Patterson, Mr. Muiris O’ Connor and Dr. Abigail Chantler
Acknowledgements
The Authority wishes to thank
Dr. Selina McCoy and Dr. Delma Byrne,
the Economic and Social Research Institute
Mr. Joseph O’ Grady,
Operations Manager, Central Applications Office
Mr. Fergal Noone, Dr. Dawn Carroll and
Dr. Dorota Migocka-Sendlak,
Statistics Section, Higher Education Authority
Higher education institution staff involved in returning student record data to the Higher Education Authority
1
A
S
tu
dy
o
f P
ro
gre
ssi
on
in
Ir
ish
H
ig
he
r E
du
ca
tio
n
Foreword
This report is published days after the first ‘World Statistics Day’ declared by the United Nations to emphasise the importance of reliable impartial public information and to promote public trust in official statistics. Across the public service in recent years, it is acknowledged that administrative data is not always sufficient or adequate to inform the implementation of policy or to evaluate the effectiveness of interventions. This has inhibited our ability to develop evidence-based approaches to social and economic development.
The improvement of data gathering systems is an explicit objective of the HEA’s current Strategic Plan and of the National Plan for Equity of Access to Higher Education 2008-2013. Significant progress has already been made and this publication marks the end of the beginning for the student record system developed over recent years. Great credit is due to those in the universities, institutes and the HEA who have contributed to the successful development of this valuable statistical resource. For a knowledge-based society, we need a knowledge base. The student record system now operating within Irish higher education compares favourably with the best systems internationally.
To build on Ireland’s considerable achievements in the expansion of higher education opportunities, this report provides an updated snapshot of the progression of full-time students in the Irish higher education system between 2008 and 2009. This fills a gap in our evidence base that extends back to the sectoral studies of retention undertaken in the 1990s. The report will serve as a reference document to inform institutional strategy and national policy. It will also underpin and enrich ongoing strategic dialogue about the future evolution of the Irish higher education system. Full cohort studies of completion will become possible as the student record system matures. The HEA will publish updates of the analysis contained in this report on a routine basis from now onwards.
This report provides a solid basis for the exchange of good practice. It is intended to underpin a constructive and collective engagement with the challenges faced by the system in ensuring progression and successful completion of undergraduate studies. I hope it will refine our understanding of the impact of existing education strategies and ultimately enhance the quality of the student experience in Irish higher education.
Tom Boland
Chief Executive
2
1
3
3
2A
S
tu
dy
o
f P
ro
gr
es
si
on
in
Ir
is
h
H
ig
he
r E
du
ca
ti
on
Table of Contents
Executive Summary 5
Chapter 1: Introduction 8
Section 1.1: Introduction 9 Section 1.2: Data Sources and Methodology 13
Chapter 2: Non-Progression of 2007/08 Full-Time
Undergraduate New Entrants 15
Section 2.1: Non-Progression of New Entrants by
Sector and NFQ Level 16 Section 2.2: Non-Progression by Grant Eligibility 18
Chapter 3: Leaving Certificate Attainment in
Mathematics and English 20
Section 3.1: Leaving Certificate Examination Points 21 Section 3.2: Mathematics Attainment 21 Section 3.3: English Attainment 23 Section 3.4: Mathematics Attainment and Technology
Disciplines 25
Chapter 4: Field of Study 29
Section 4.1: Non-Progression among 2007/08 New Entrants by Field of Study across all
Sectors and NFQ Levels 30 Section 4.2: Profession-Oriented Courses 31
Chapter 5: Student Characteristics 33
Section 5.1: Non-Progression and Gender 34 Section 5.2: Non-Progression and Age 37 Section 5.3: Non-Progression and Nationality 37 Section 5.4: Non-Progression and Socio-Economic
Group 38
Chapter 6: Non-progression among Higher
Education New Entrants: 40
Section 6.1: Introduction 41 Section 6.2: Methodology 41 Section 6.3: Results 44
6.3.1 Characteristics of Students
Who Do Not Progress 44 6.3.2 Non-Progression across All
Institutions 48 6.3.3 Non-Progression across Institutes
of Technology (NFQ Level 6 & 7 Courses only) 49 6.3.4 Non-Progression across the Universities
(NFQ Level 8 Courses only) 49 Section 6.4: Discussion 50
Chapter 7: An Analysis of Student Progression
Beyond First Year 54
Section 7.1: Non-Progression by Course Year 55 Section 7.2: Non-Progression of Repeating Students 56 Section 7.3: Transfer Students 57
Chapter 8: Concluding remarks 58
Bibliography 64
Appendices 67
Appendix A: Overall Non-Presence Rates by Institution, NFQ Level and Prior
Education Attainment 68 Appendix B: Overall Non-Presence Rates by
Institution and NFQ Level 76 Appendix C: Overall Non-Presence Rates by
Institution and NFQ Level and
Field of Study 77 Appendix D: Supplementary Data to Multi
2
1
3
3
3
A
S
tu
dy
o
f P
ro
gre
ssi
on
in
Ir
ish
H
ig
he
r E
du
ca
tio
n
Tables and Figures:
Chapter 2: Non-Progression of 2007/08 Full-TimeUndergraduate New Entrants
Table 2.1: Non-Presence Rates by Sector and
NFQ Level 16
Table 2.2: Non-Presence Rates by Prior Educational
Attainment 17
Figure 1: Non-Presence Rates by Prior Educational Attainment and NFQ Level 18 Table 2.3: Non-Presence Rates by Grant Eligibility 18
Chapter 3: Leaving Certificate Attainment in Mathematics and English
Table 3.1: Leaving Certificate Grade Points 21 Figure 2: Proportion of 2007/08 Undergraduate
New Entrants with 60+ Points in Leaving Certificate Mathematics 21 Figure 3: Non-Presence Rates by Points Attainment
in Leaving Certificate Mathematics 22 Table 3.2: Non-Presence Rates by Leaving Certificate
Attainment in Mathematics, Sector, &
NFQ Level 22
Figure 4: Proportion of 2007/08 Undergraduate New Entrants with 60+ Points in Leaving Certificate English 23 Figure 5: Non-Presence Rates by Leaving Certificate
English Points Attainment 24 Table 3.3: Non-Presence Rates by Leaving Certificate
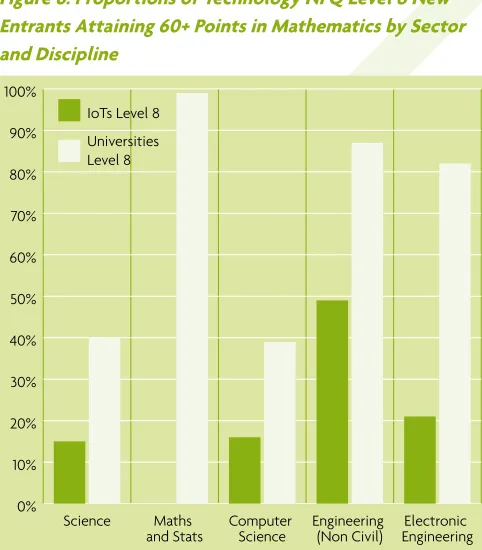
Attainment in English, Sector, & NFQ Level 24 Figure 6: Proportions of Technology NFQ Level 8
New Entrants Attaining 60+ Points in
Mathematics by Sector and Discipline 25 Table 3.4: Non-Presence Rates of New Entrants to
NFQ Level 8 Technology by Leaving Certificate Attainment in Mathematics and by Sector 26 Figure 7: Proportions of New Entrants to NFQ
Level 6 & 7 Technology Courses Attaining 60+ Points in Mathematics by Sector and
Discipline 27
Table 3.5: Non-Presence Rates of New Entrants to Level 6 & 7 Technology Courses By Leaving Certificate Attainment in
Mathematics and by Sector 27
Chapter 4: Field of Study
Figure 8: Non-Presence Rates by Field of Study 30 Table 4.1: Non-Presence Rates by Field of Study,
Sector and NFQ Level 31 Figure 9: Non-Presence Rates in Profession-Oriented
Courses 31
Table 4.2: Non-Presence Rates in Selected Profession-Oriented Courses By Leaving Certificate Points Attainment 32
Chapter 5: Student Characteristics
Figure 10: Gender Balance of New Entrants by
Sector and NFQ Level 34 Figure 11: Non-Presence by Gender, Sector and
NFQ Level 34
Table 5.1: Non-Presence by Gender and Prior
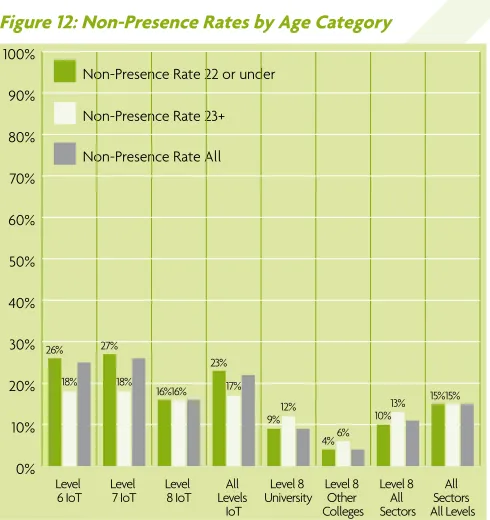
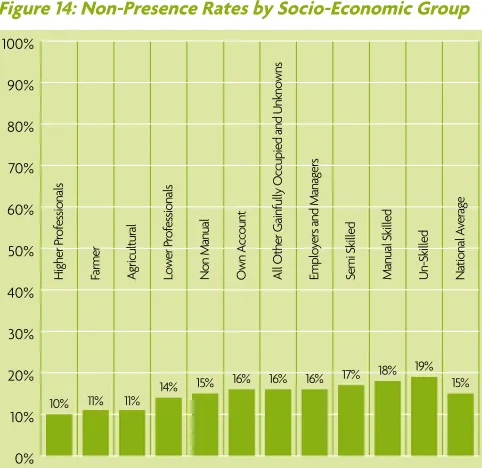
Educational Attainment 35 Figure 12: Non-Presence Rates by Age Category 37 Figure 13: Non-Presence Rates by Nationality 38 Figure 14: Non-Presence Rates by Socio-Economic
Group 38
Table 5.2: Non-Presence Rates by Socio-Economic Group, Sector and NFQ Level 39
Chapter 6: Non-progression among Higher Education New Entrants: a Multivariate Analysis. Selina McCoy & Delma Byrne, ESRI
Figure 15: Overall Non-Progression Odds by Leaving Certificate Points 46 Figure 16: Overall Non-Progression Rates by Leaving
Certificate Attainment in English, Irish and
2
1
3
3
4A
S
tu
dy
o
f P
ro
gr
es
si
on
in
Ir
is
h
H
ig
he
r E
du
ca
ti
on
Figure 17: Non-Progression Odds by Field of Study, Controlling for Social Background and
Leaving Certificate Performance 47 Figure 18: Non-Progression Odds for Institute of
Technology and ‘Other College’ Students Relative to University Students, Controlling for Individual Characteristics 47
Figure 19: Non-Progression Odds across Institutions, Unadjusted and Controlling for Additional Individual Characteristics 48 Figure 20: Non-Progression Odds for Institutes of
Technology, Unadjusted & Controlling for Additional Individual Characteristics 49
Figure 21: Non-Progression Odds for Universities, Unadjusted and Controlling for Additional Individual Characteristics 50
Chapter 7: An Analysis of Student Progression Beyond First Year
Table 7.1: Non-Presence Rates by Course-Year,
Sector, NFQ Level and Course Duration 55 Table 7.2: Non-Presence Rates of Repeating Students
by Course-Year, Sector, NFQ Level and
2
1
3
3
5
A
S
tu
dy
o
f P
ro
gre
ssi
on
in
Ir
ish
H
ig
he
r E
du
ca
tio
n
Executive Summary
A Study of Progression in Irish Higher Education is a report by the Higher Education Authority (HEA) which presents empirical evidence relating to the issue of progression through higher education in Ireland. The report is intended as a reference document that will serve to inform policy and the development of interventions to improve rates of completion and graduation. The analysis draws from the Student Record System (SRS) developed in the HEA over recent years and complements this with Leaving Certificate examination data from the Central Applications Office (CAO) database. The current analysis focuses primarily on the developments in the academic years 2007/08 and 2008/09 between two census dates—1st March 2008 and 1st March 2009—and specifically on the issue of non-presence rates over that period. Full evaluation of completion rates will become possible as the SRS matures.
The issue of progression and completion is one of growing importance in the higher education debate both nationally and internationally. It has resonance with other key issues in higher education, ranging from the promotion of greater equality to the pursuit of greater efficiency and the development of skills required for the ‘knowledge economy’. The report is aimed at everybody with an interest in these issues but particularly academics, higher education policy-makers, access practitioners, and senior management within higher education institutions. It is intended to underpin a constructive and collective engagement with the challenges presented by progression and successful completion of undergraduate studies.
The report examines the issue of progression across a range of fields of study, NFQ levels and institutions. Significant attention is paid to the extent to which individual students’ characteristics, such as gender, age, socio-economic background and prior educational attainment, have an impact on progression. While the main focus of this report is on new entrants, it also examines progression in the later years of undergraduate programmes. The key findings of the report are summarised below.
Chapter 2:
Non-Progression of 2007/08
Full-Time Undergraduate New Entrants
• The proportion of new entrants in 2007/08 who are not present one year later was 15% on average across all sectors and NFQ levels.
• The rates of non-presence vary strongly according to the NFQ level, ranging from 25%/26% at levels 6/7 to between 4% and 16% at level 8. They also differ according to the sector, ranging from 22% in an institute of technology to 9% in the university sector and 4% in teacher training colleges.
• There is a clear and strong link between prior educational attainment and successful progression. Educational attainment is a very strong factor influencing whether or not a new entrant progresses beyond the first year of their course of study.
2
1
3
3
6A
S
tu
dy
o
f P
ro
gr
es
si
on
in
Ir
is
h
H
ig
he
r E
du
ca
ti
on Figure 1: Non-Presence Rates by Prior Educational
Attainment and NFQ Level.
0% 10% 20% 30% 40% 50% 60% 70% 80% 90% 100%
All L8 L7 L6
550+ 505 to
550 455 to
500 405 to
450 355 to
300 305 to
350 255 to
300 205 to
250 155 to
200 105 to
150 55 to
100 0 to
50
Chapter 3:
Leaving Certificate Attainment
in Mathematics and English
• Prior educational attainment is the strongest predictor of successful progression through higher education.
• This is reflected most clearly in Mathematics which is the strongest predictor of successful progression among higher education students. New entrants with higher points in Mathematics are most likely to progress. Attainment in English in the Leaving Certificate examination is also a strong indicator of progression, albeit not as direct as attainment in Mathematics.
Chapter 4:
Field of Study
• Rates of non-presence vary greatly across the different fields of study. Profession-orientated courses tend to display the highest rates of progression while the lowest progression rates are found among Engineering, Construction and Computer Science courses.
• At 27%, Computer Science has the highest rate of non-presence across all sectors and levels; Medicine has the lowest non-presence rate of 2%.
Chapter 5:
Student Characteristics
• At aggregate level, females display higher rates of progression through higher education than males. • Mature students display higher rates of progression at
levels 6 and 7 in the institute of technology sector and lower rates at level 8 for all sectors.
• The socio-economic groups with the highest entry rates tend to display the highest rates of progression.
Chapter 6:
Non-Progression among Higher
Education New Entrants:
A Multivariate Analysis.
Selina McCoy & Delma Byrne, ESRI
• At an overall level males are less likely to successfully progress in their course. However this difference largely reflects lower levels of Leaving Certificate performance among males and their greater entry into higher
education sectors and courses with higher dropout levels. • Grant support plays an important role in student
2
1
3
3
7
A
S
tu
dy
o
f P
ro
gre
ssi
on
in
Ir
ish
H
ig
he
r E
du
ca
tio
n
• Students in Computer Science experience a much greater risk of dropout, while those enrolled in education and healthcare courses have significantly lower non-progression rates, even taking account of the gender, ‘ability’ and social class intake of these courses.
• In comparing retention levels across institutions, the analysis points to the crucial importance of taking account of the composition of the institutions, to allow a like-for-like comparison. Wide overall differences between the institutions decline dramatically once the results are adjusted for the characteristics of the students enrolled. • Once these adjustments are made, the main differences emerging are between the three main sectors, rather than within them. Retention rates are significantly higher in the colleges of education (and the National College of Art and Design), while the institutes of technology display lower retention levels.
Chapter 7:
An Analysis of Student Progression
Beyond First Year
• For all levels and sectors, students are significantly more likely to be present the following year the more advanced they are in their course of study. Non-presence rates for new entrants are 15% compared to 7% for second-year students, 4% for third-year students, and 5% for fourth-year students.
Chapter 1:
9
A
S
tu
dy
o
f P
ro
gre
ssi
on
in
Ir
ish
H
ig
he
r E
du
ca
tio
n
Section 1.1:
Introduction
Ireland has been remarkably successful in pursuing its ambitious goals ‘to widen participation and increase student and graduate numbers’ in higher education in order to position itself within the front rank of OECD countries.1 Participation
in higher education in Ireland has risen steadily over recent decades and this is clearly reflected in the % age of the Irish population that has attained higher education qualifications. At present, one-third of the Irish adult population (aged 25– 64 years) has a higher education qualification—12% at NFQ levels 6 or 7 and 22% at NFQ level 8 or above.2 The expansion
of opportunities for higher education in Ireland is reflected best in the attainment levels of young adults (aged 25–34 years), 45% of whom have now acquired a higher education qualification.3 The proportion of 18 year olds entering higher
education is approaching two thirds. From a position of relative weakness in terms of the educational attainment of the population a few decades ago, Ireland now ranks highly internationally in terms of attainment in higher education.
Internationally comparable measures of student progression and completion in higher education are difficult to develop because of the variety of systems of entry and access to higher education that exist across countries. These difficulties are compounded by methodological and definitional issues. As Van Stolk and his colleagues note, ‘it is challenging to make comparisons between retention rates of countries given the differences in how retention and completion rates are defined and calculated’.4 The difficulties attendant
1 Government of Ireland, National Development Plan 2007–2013: Transforming Ireland: A Better Quality of Life for All (Dublin: The Stationery Office, 2006), 202.
2 NFQ refers to the National Framework of Qualifications. Level 8 of the NFQ refers to Bachelors’ Honours degrees and Higher Diplomas. See http://www.nfq.ie/nfq/en/FanDiagram/nqai_nfq_08.html
3 Organisation for Economic Cooperation and Development, Education at a Glance 2010: OECD Indicators (Paris: OECD, 2010), 36.
4 Christian van Stolk, Jan Tiessen, Jack Clift, and Ruth Levitt, Student Retention in Higher Education Courses: International Comparison (Rand, 2007), xii.
upon making such comparisons are exacerbated by the range of terms used synonymously with ‘retention’. Some terms implicitly attribute responsibility to the student (as exemplified by ‘persistence’, ‘withdrawal’, and ‘drop-out’) but much of the focus in more recent literature on retention has broadened to the learning environment, with responsibility for attrition shifting to the higher education institution or more broadly to the government.5 Notwithstanding the
difficulties in interpreting international comparisons, OECD estimates of higher education completion published in 2007 suggested that Ireland was among the best-performing countries for university completion, and that, at ‘sub-degree level’ within the institutes of technology, completion rates were just above international averages.6
The issue of successful progression and completion of higher education has become increasingly important against the background of expanding educational opportunities and explicit commitments to promote greater equality in the extent to which different groups in society derive benefit from higher education. Ireland has achieved considerable progress in increasing participation in higher education among students from diverse socio-economic backgrounds. The range of initiatives set up to support greater access have highlighted awareness of the importance of successful completion, particularly among groups traditionally under-represented in higher education. Improving student retention represents an ‘on-going challenge because as the
5 Robert Jones, ‘Widening Participation/ Student Retention and Success’, EvidenceNet Synthesis (Higher Education Academy, U.K., April 2008), 1. 6 OECD, Education at a Glance 2007: OECD Indicators (Paris: OECD, 2007),
72. The estimated ‘survival rates’ reported by the OECD for Ireland in 2004 were 83% at degree level (NFQ level 8) and 69% at sub-degree level (NFQ levels 6&7) compared to estimated OECD averages of 70% and 67% respectively. The OECD define the survival rate as the proportion of those who enter a programme and go on to graduate from it. The estimates flatter Irish universities somewhat because the reference date for the recording of first year students was March 1st. The reference dates for the
institutes of technology was October 31st. Recent analysis undertaken
2
1
3
3
10A
S
tu
dy
o
f P
ro
gr
es
si
on
in
Ir
is
h
H
ig
he
r E
du
ca
ti
on goal of increased student diversity is being embraced, the
needs of the student body are shifting’.7
The current difficult economic context, and the growing needs for upskilling and reskilling opportunities, have created an unprecedented demand for higher education in Ireland at a time of extreme fiscal tightening. This has amplified an already strong emphasis on efficiency in Irish higher education. Minimising students’ non-completion of courses is an important part of ensuring that the resources available to the higher education sector are utilised with maximum efficiency. That the issue of completion has also featured in debates about accountability is reflected in the use of completion data in the accountability mechanisms of some higher education systems (notably in the US), as well as in the increasing number of surveys and audits undertaken internationally in recent years.8
In seeking to address issues of progression and student success in Irish higher education, there is an ongoing need for vigilance in relation to the quality of learning delivered and the standards of education achieved. Making qualifications easier to obtain would contribute to improvements in completion but would do nothing to enhance the real levels of competence and the learning achievements of Irish graduates. The quality of our graduates is paramount and it is in the national interest to preserve and promote the highest standards. Ireland’s National Framework of Qualifications provides an architecture within which the education community in Ireland can explore and articulate the learning outcomes associated with each of the levels of achievement that it sets out. In our pursuit of excellence, the objective is to achieve genuine improvements in the capacity of Irish citizens to acquire the highest levels of skill, competence and understanding in the disciplines of their choice. It cannot ever be about lowering the standards to achieve nominal (and artificial) expansions in the numbers of people with higher education qualifications.
7 L. Thomas, J. Quinn, J. Slack, and L. Casey, Student Services: Effective Approaches to Retaining Students in Higher Education (Stoke-on-Trent: Institute for Access Studies, Staffordshire University, 2002), 77. 8 For a recent review of the international literature on student retention
in higher education see Jones, ‘Widening Participation’.
At a more personal level, successful completion is important to the educational and intellectual development of
individual students as well as to their self-esteem. As the Director of the U.K.’s Higher Education Policy Institute, Bahram Bekhradnia, recently remarked:
In almost all respects dropping out does you no good at all. [The Wider Benefits of Learning Group] looked at things like mental health, physical health, parenting, social attitudes […], but also attitudes to gender and race equality. In pretty well all respects people who drop out are no better off than people who didn’t go to university at all, and often actually worse off. It’s a dangerous fiction that dropping out doesn’t matter. It does, and we should be doing all we can to help young people succeed.9
The national context
Given the increasing importance of retention and progression in higher education policy and practice, the publication of this report is timely because it fills a gap in our evidence-base on these important issues. It is the first report on the subject that includes information from almost all publicly-funded higher education institutions in Ireland, and which therefore has national coverage. A number of sector-wide studies of retention already exist—notably the cohort studies conducted by the Educational Research Centre and published at the turn of the century.10
Morgan and his colleagues’ university-sector Study of Non-Completion (2001) examined the completion rates of full-time undergraduates who first entered higher education in the 1992–93 academic year. Based on retrospective data obtained directly from the universities, the study examined
9 Bahram Bekhradnia, ‘Higher Education Policy Making: Hope, Prejudice and Wishful Thinking’, lecture at City University, London, 26th January 2010.
2
1
3
3
11
A
S
tu
dy
o
f P
ro
gre
ssi
on
in
Ir
ish
H
ig
he
r E
du
ca
tio
n
completion rates by discipline, gender, and in relation to course entry requirements, as well as the destination of students who did not progress to their second year of study.11 The headline results of that study estimated that
68% of university students graduated on time, a further 15% graduated late, and the remaining 17% did not complete their programmes of study. Direct comparisons made between the results of the study and those of an earlier, HEA-commissioned study of students entering university in 1985, suggested that completion rates had improved over time across the university sector.12
The Educational Research Centre conducted an equivalent study of completion in the institutes of technology sector focusing retrospectively on full-time entrants to ab initio programmes of study in 1995.13 This study found that 52% of
students graduated on time, 5% graduated late and almost 43% did not complete their courses; and that there were “very substantial” gender differences in completion rate, as well as large differences between fields of study. The authors remark: [The] results indicate that non-completion of courses
by students is a matter of serious concern for Institutes of Technology. They also indicate that it is a complex phenomenon, in which Institute, field of study, entry requirements, level of award, and gender all are implicated.14
In 2002 a follow-up study of the institute of technology sector was undertaken which explored the possible causes of non-completion by examining the experience of first-year
11 Mark Morgan, Rita Flanagan, and Thomas Kellaghan, A Study of Non-Completion in Undergraduate University Courses (Dublin: Higher Education Authority, 2001), 8–9. The questionnaire circulated to the universities as the mechanism by which this data was obtained is reproduced in Appendix A of the report. Ibid., 74.
12 While completion rates improved at aggregate level, the trends over time varied across institutions. See Educational Research Centre, An Investigation of Factors Associated with Non-Completion of University Courses (Dublin: Higher Education Authority, 1997).
13 See note 11 above. Ab initio programmes of study are those that are set over a certain number of years from their point of commencement, such as a two-year certificate, a three-year diploma, and a four-year degree. 14 Morgan et al, A Study of Non-Completion in Institute of Technology
Courses: Part One , v.
students across six courses of study.15 The study found that
few students had a good understanding of their course at the point of application and that in a third of all cases the workload was greater than had been anticipated. The main reason cited for non-completion related to the difficulty of the course, and such difficulties frequently arose in relation to one particular subject (often mathematics). These challenges, relating to underlying competence, were more severe in some fields of study than in others, with much lower levels of difficulty and detachment found in business studies than in electronics and computing. The gravity of the challenges facing the sector that emerged from the study led the Council of Directors (now the Institutes of Technology, Ireland (IOTI)) to commission a further study on the issue which was published in 2006.16 This report
estimated completion rates between 73 and 75% for the years between 2002 and 2004.17
While the earlier sectoral studies of retention were based on retrospective surveys of institutions, the current study is more comprehensive and more definitive because it is a census-based study of all full-time undergraduates (NFQ levels 6–8) in HEA-funded higher education institutions.18 This information is
derived primarily from the student record system (SRS), which has been developed by the HEA and rolled out to institutions in recent years. The inclusion of the institutes of technology in the SRS is a relatively recent development that occurred subsequent to the designation of the institutes of technology
15 See Morgan et al, Non-Completion in Institutes of Technology: An Investigation.
16 Eamonn Kinsella, Julie Roe, and Torlach O’Connor, Completion Rates for Students Taking Full-Time Programmes of Study in Institutes of Technology: A Study Carried Out for the Council of Directors of Institutes of Technology and the Dublin Institute of Technology (Dublin: The Circa Group, 2006).
17 Ibid., ii. The questionnaire, sent to the institutes in 2004, is reproduced in the Appendix B of the report. Ibid., 57.
2
1
3
3
12A
S
tu
dy
o
f P
ro
gr
es
si
on
in
Ir
is
h
H
ig
he
r E
du
ca
ti
on under the aegis of the HEA in the Institutes of Technology
Act, 2006. While the current study is based on a very robust and comprehensive database that allows for a wide ranging exploration of the issue of progression, the analysis focuses on the level of progression in a one-year period (between the 1st March 2008 and the 1st March 2009) rather than on full completion/graduation rates for a particular cohort of students. It is therefore only the beginning of a significant improvement in the quality and policy-relevance of our student statistics, and the HEA will undertake full-cohort completion studies as the database matures in the coming years.
Risks of outcomes focussed analysis
The earlier studies of retention in Irish higher education demonstrated substantial differences in retention rates between the university and institute of technology sectors. However there is a need for caution in drawing from this any conclusions in respect of the quality of teaching and learning in particular institutions and sectors. Such conclusions would be based solely on ‘raw outputs’ without regard for the fact that the context and the student body differ so considerably across institutions.
There are clear distinctions in the profiles of students enrolled in the university and institute of technology sectors in Irish higher education. In terms of gender, in the academic year 2007/08, females comprised 60% of full-time undergraduate new entrants to the university sector by comparison with 45% female full-time undergraduate new entrants to the institute of technology sector.19 Whilst
the majority of such students entering both sectors in 2007 were aged 18 or 19 (70% in the university sector and 63% in the institute of technology sector), a slightly greater proportion of mature students entered the institutes of technology (13.3%) than the universities (10.4%).20
19 HEA, Higher Education Key Facts and Figures 07/08 (Dublin: HEA, 2009), 16. 20 Ibid., 60, 64.
The strongest differences between universities and institutes of technology lie in the prior educational attainment levels of entrants (as denoted by performance in the Leaving Certificate examination). In 2007 the most common range of points attained in the Leaving Certificate examination by new full-time undergraduate entrants to NFQ level 8 courses of four years’ duration was 450–500 in the university sector and 300–350 in the institute of technology sector;21 the
most common points range for level 6 and 7 courses in the institutes of technology was 250–300. Given the inequalities that persist in the extent to which different socio-economic groups derive benefit from second-level education in terms of school completion and in terms of the attainment of Leaving Certificate points, the lower entry requirements for most institute of technology programmes results in contrasting socio-economic profiles among the students between the universities and institutes of technology. While students from the traditionally under-represented groups (the non-manual, skilled-manual, semi-skilled manual, and unskilled backgrounds) are more numerous in the institutes of technology, the student composition in the university sector tends to be skewed toward the middle and upper ends of the socio-economic spectrum.22 This general pattern of intake is
also reflected in the higher proportions of new entrants in receipt of maintenance grants in the institutes of technology (34%) compared with 25% in the universities in 2007.
In addition to differences in the prior educational attainment of students and in the composition of the student body across the universities and institutes of technology, the sectors also differ substantially in terms of the balance of programmes and disciplines which they teach, and in the NFQ levels of the programmes. More new entrants to the university sector commenced courses
21 It should be noted that the average number of points obtained in the Leaving Certificate examination by new entrants to NFQ level 8 courses in Dublin City University and the National University of Ireland, Maynooth in 2007/08 was closer to the most common points range of the institute of technology sector than to that of the university sector. See Chart A, Chapter 2.
2
1
3
3
13
A
S
tu
dy
o
f P
ro
gre
ssi
on
in
Ir
ish
H
ig
he
r E
du
ca
tio
n
in the Humanities and Social Sciences (60.7%), and fewer commenced courses in the Sciences (36.6%) in 2007 than in the institute of technology sector, in which 39.3% enrolled in the Humanities and Social Sciences and 51% in the Sciences.23
The remainder of this chapter describes the data sources, analytical methodology, and terminology utilised within this report.
Section 1.2:
Data Sources and Methodology
The student data used in this analysis was extracted from the HEA’s in-house database of information pertaining to students in all HEA-funded institutions – the Student Record System (SRS), which contains an individual record for each student in each academic year. The SRS was established in the university sector in 2004, and in the institutes of technology, the National College of Ireland and Tipperary Institute in 2007. The data on which this analysis is based was extracted from the SRS by tracking student IDs within institutions and across academic years.
The census dates used for this analysis – 1st March 2008 and 1st March 2009 – span the academic years 2007/08 and 2008/09. Students who repeated a year or who changed course or programme type within their original institution were identifiable and are grouped with those deemed to be still present. Although the SRS does not permit the tracking of students across institutions, the proportion of undergraduate students who transferred to a different institution during these years is estimated to be less than 2% of all undergraduate new entrants. These are included among those deemed not to have progressed.
23 Ibid., 22, 24. These%ages were obtained by categorising the ISCED categories ‘education’, ‘humanities and arts’, and ‘social sciences, business, and law’ as the humanities and social sciences; and ‘science’, ‘engineering, manufacturing, and construction’, ‘agriculture’, and ‘health and welfare’ as science. (The ISCED categories ‘general programmes’, ‘services’ and ‘combined’ were included in neither the humanities and social sciences nor the sciences, and account for the remainder of the enrolments of new entrants in 2007–2008.)
For the purposes of this report, only student data pertaining to full-time undergraduates (NFQ levels 6–8) was analysed: student records pertaining to undergraduates studying at NFQ levels 6 and 7 in the universities and other colleges were not analysed since such courses are not HEA-funded.
The CAO supplied the HEA with Leaving Certificate
examination record data on individuals applying for a higher education place through the CAO application process in 2007 with one or more Leaving Certificates (or equivalent exit examination results). This data-set includes individuals who applied to the CAO for the first time in 2007 supplying Leaving Certificate examination results from the period 2000–2007. Students who applied to the CAO in previous years were excluded from the data-set. Data obtained from the CAO was linked to the SRS data by matching CAO ID numbers.24
A CAO applicant’s most recent Leaving Certificate examination result comprising six or more subjects was selected as the most likely to reflect the applicant’s strongest academic achievement. Leaving Certificate examination results comprising fewer than six subjects were assumed to be solely for the purposes of meeting specific course entry requirements rather than reflecting the sum of Leaving Certificate points accumulated by candidates over a number of examination sittings.
Applicants were matched with 2007 examination records comprising results in six or more subjects. Successful matches were removed and the remainder matched with 2006 examination records comprising results in six or more subjects. This method was repeated until all the examination years (back to 2000) were matched.
The socio-economic data in the SRS was collected by surveying the student body during the registration process in 2007. The non-mandatory nature of this element of the data collection resulted in wide variations in response rates across institutions.
14
A
S
tu
dy
o
f P
ro
gr
es
si
on
in
Ir
is
h
H
ig
he
r E
du
ca
ti
on
Categorisation of Students
New Entrants
The majority of the analysis was carried out on full-time undergraduate new entrants to higher education. New entrants are defined as students entering higher education for the first time.
Re-enrolling Students
Students classified as re-enrolling are those students progressing to the next year of study on the same course without any interruptions. This category does not include repeat students or transfer students.
Repeat Students
A repeat student is classified as being present in the institution on their original course the following year but enrolled in the same year of study as the previous year.
Internal Transfer Student
Students transferring from their original mode or course of study to another programme within an institution at the start of the new academic year are described as internal transfer students.
External Transfer Students
Students transferring from a course of study in their institution to another institution are described as external transfer students. These students cannot be identified or tracked in the absence of full coverage of a national-level identifier covering all students such as a PPS number.25
25 The HEA has made significant progress in the collection of PPS numbers from registered students in higher education. Coverage of PPSN is now in the region of between 70% and 85% in the SRS. Complete coverage will in the future allow for identification of those students that transfer between institutions.
Not Present/Non-Presence
In instances in which a student’s ID does not appear in their institution’s data return for the following academic year, the student is described as being ‘not present’. While re-enrolling, repeat and internal transfer students are identified separately in the analysis, it is not possible to distinguish external transfer students from those described as ‘not present’.
In summary this study examines the progression of undergraduate new entrants in the academic year 2007/08 to the second year of their original course at a given NFQ level. The data for this cohort is examined by sector, NFQ level, prior educational attainment, grant eligibility status, field of study, gender, age, socio-economic background and nationality. The data also allows for the analysis of the progression of re-enrolling, repeat and internal transfer students. The progression of students in their second, third and subsequent years of study was also examined.
The reader should be aware of the limitations that the data set poses for analysis. Since the census dates used are 1st March 2008 and 1st March 2009, this report does not take into account those students that left their institution prior to 1st March 2008. However previous analysis of the data set undertaken by the HEA showed that just 4% of new entrants dropped out of their original course of study prior to 1st March of the academic year in which their course commenced.26 In addition, as indicated above, the absence
of full coverage of a national-level identifier covering all students, the absence of CAO student IDs in some institutional returns to the SRS, and the incompleteness of the socio-economic data returned to the SRS are all factors that have hindered the presentation of a more comprehensive analysis.
Chapter 2:
2
1
3
3
16A
S
tu
dy
o
f P
ro
gr
es
si
on
in
Ir
is
h
H
ig
he
r E
du
ca
ti
on
Introduction
This chapter provides estimates of the level of non-progression among full-time 2007/08 new entrants to HEA-funded institutions by sector, NFQ level, prior educational attainment and grant eligibility status. New entrants are classified as ‘not present’ if they do not appear in the statistical returns of that institution in the following academic year (2008/09).
Other entrants and students transferring between later years are examined in Chapter 7.
Section 2.1:
Non-Progression of New Entrants by
Sector and NFQ Level
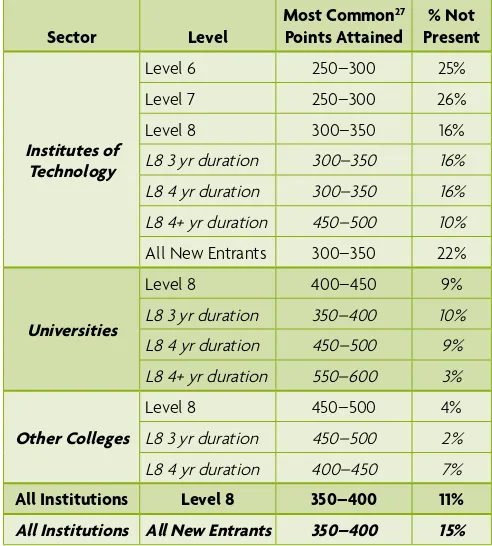
Table 2.1 illustrates the non-presence rates of new entrants in their second year of study by sector, NFQ level and course duration. The column entitled ‘Most Common Points Attained’ shows the most common prior educational attainment in the Leaving Certificate examination by students entering higher education by NFQ level, while the column entitled ‘% Not Present’ shows the percentage of new entrants absent from their second year of study by NFQ level within each sector. The most common points range varies by sector & level: there is a gap of two hundred points between level 6 entrants to the institutes of technology and level 8 entrants to the Other Colleges. Even within the same sector, there is a considerable gap between level 6 and level 8 in terms of points required for entry. The lower level courses tend to enter students on a lower points range. The most common points attained at level 6 and 7 is 250–300 compared with 300–350 at level 8 in an institute of technology.
[image:18.624.336.582.103.376.2]Differences in most common points attained also vary across sectors at the same NFQ level. The most common points scored by an institute of technology student studying a level 8 course is 300–350 points compared to 400–450 in a university and 450–500 in an Other College.
Table 2.1: Non-Presence Rates by Sector and NFQ Level
Sector Level Most Common
27
Points Attained Present% Not
Institutes of Technology
Level 6 250–300 25% Level 7 250–300 26% Level 8 300–350 16% L8 3 yr duration 300–350 16% L8 4 yr duration 300–350 16% L8 4+ yr duration 450–500 10% All New Entrants 300–350 22%
Universities
Level 8 400–450 9% L8 3 yr duration 350–400 10% L8 4 yr duration 450–500 9% L8 4+ yr duration 550–600 3%
Other Colleges
Level 8 450–500 4% L8 3 yr duration 450–500 2% L8 4 yr duration 400–450 7%
All Institutions Level 8 350–400 11% All Institutions All New Entrants 350–400 15%
While there does not appear to be a significant difference in rates of progression between three-year and four-year courses at level 8, courses of greater than four years’ duration show significantly higher progression rates beyond the first year. This is probably due both to the high level of prior educational attainment required to enter, and the unambiguous career qualification awarded on completion in disciplines such as Architecture, Medicine, and Dentistry.28
Even at this initial aggregate level of analysis there is evidence of a clear link between prior educational attainment on entry and progression rates. Lower educational attainment on entry is associated with a greater incidence of non-progression. Within the institute of technology sector, non-presence rates at level 6 and level 7 are 25% and 26% respectively, while non-presence rates at level 8 are 16%.
27 ‘Most Common Points Attained’ is the points bracket with the most students applying in that category.
2
1
3
3
17
A
S
tu
dy
o
f P
ro
gre
ssi
on
in
Ir
ish
H
ig
he
r E
du
ca
tio
n
Differences between sectors in the typical points required to enter courses at level 8 may explain the accompanying differences in rates of progression. At level 8, for example, the non-presence rates vary from 16% in the institute of technology sector to 9% in the university sector to 4% in the Other Colleges. Whether a level 8 course is of three or four years’ duration seems to have no effect on progression. However there is a clear difference in the progression rates on courses of greater than four years’ duration: non-presence rates diminish from 16% for four-year courses to 10% for courses of greater than four years’ duration in the institute of technology sector (although numbers are very small); and from 9% to 3% for courses of greater than four years’ duration in the university sector.31
29 The term ‘Other’ refers to new entrants entering in 2007/08 on a basis other than the Leaving Certificate.
30 Table 2.2 includes 0–50 and 55–100 point ranges. In most cases these students present additional evidence via recognition of prior learning and experience gained in the workplace. Such non-traditional students may not be in a position to progress annually year-on-year regardless of academic ability. 31 There are no level 8 courses of greater than four years’ duration in the
Other Colleges.
Table 2.2 examines undergraduate new entrant non-progression from 2007/08 to 2008/09 by sector, NFQ level and prior educational attainment. It elaborates on the previous table by showing the non-presence rates by points brackets across all sectors. In this table the column entitled ‘Points Range’ refers to the actual points attained by new entrants by contrast with the ‘Most Common Points Attained’ column included in Table 2.1 above.
The analysis shows that regardless of the sector or level at which a student enters higher education, those with the least Leaving Certificate examination points are the most likely to not progress to the following academic year. At all levels and across all sectors the higher a student’s prior educational attainment the less likely they are to not progress to the following academic year.32
32 New entrants to level 8 courses in the institute of technology sector are an exception to this but the numbers involved are very low. In addition, students in this points range are much more likely to attempt to repeat the Leaving Certificate examination than students in the lower points range. (See Table 24 in Vivienne Patterson and Oliver Mooney, Discipline Choices and Trends for High Point CAO Acceptors 2006 (Dublin: Higher Education Authority, 2007).
Table 2.2: Non-Presence Rates by Prior Educational Attainment29
Points Range
All New Entrants % Not Present
Institutes of Technology
Uni L8 % Not Present
Other Colleges L8 % Not
Present Not PresentAll L8 % IoT Level
6 % Not Present
IoT Level 7 %
Not Present Not PresentIoT L8 % Not PresentAll IoT %
0 to 50 50% n/a 75% 33% 57% 0% n/a 25% 55 to 100 49% 50% 57% 38% 52% 0% n/a 27% 105 to 150 37% 37% 43% 22% 39% 13% 0% 18% 155 to 200 40% 41% 44% 19% 42% 10% 0% 14% 205 to 250 38% 34% 42% 25% 39% 19% 0% 22% 255 to 300 26% 28% 28% 21% 27% 19% 8% 20% 305 to 350 19% 17% 20% 20% 20% 19% 0% 19% 355 to 400 14% 14% 14% 14% 14% 14% 2% 14% 405 to 450 9% 8% 9% 12% 11% 8% 5% 9% 455 to 500 6% 11% 9% 8% 8% 6% 2% 6% 505 to 550 4% 0% 0% 31% 24% 4% 1% 4% 550+ 4% n/a 0% 57% 44% 3% 0% 4% Other29 14% 21% 23% 15% 18% 10% 5% 11%
2
1
3
3
18A
S
tu
dy
o
f P
ro
gr
es
si
on
in
Ir
is
h
H
ig
he
r E
du
ca
ti
on Figure 1: Non-Presence Rates by Prior Educational
Attainment and NFQ Level
0% 10% 20% 30% 40% 50% 60% 70% 80% 90% 100%
All L8 L7 L6
550+ 505 to
550 455 to
500 405 to
450 355 to
300 305 to
350 255 to
300 205 to
250 155 to
200 105 to
150 55 to
100 0 to
50
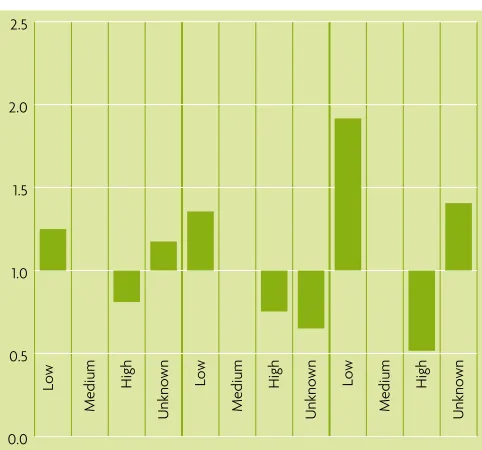
Appendix A presents a detailed assessment of non-progression of new entrants to each publicly aided institution by prior educational attainment. The charts allow for a visual comparison of cohort size by points bracket, institution and sector. The length of the red bar
in each Leaving Certificate examination points bracket shows non-presence, while the green bar shows presence in the following academic year. Also of interest are the relative cohort sizes per points bracket attending each institution. For example Trinity College Dublin receives the highest proportion of students who attained 550 or more points in the Leaving Certificate examination. The relative size of each institution’s intake is also readily apparent and is influenced by the disciplines that they offer: not all universities offer courses that require a high points score, such as Medicine or Dentistry, although in the larger universities a considerable number of new entrants enter courses with a higher points score than is required.
Section 2.2:
Non-Progression by Grant Eligibility
[image:20.624.72.316.92.350.2]The grant is the main source of financial assistance available from the Irish state for students in full-time higher education, eligibility for which is determined on the basis of family and/or personal income. Table 2.3 compares aggregate progression rates of new entrants in receipt of a grant with those not in receipt of a grant by sector and NFQ level.
Table 2.3: Non-Presence Rates by Grant Eligibility
Grant Status
All New Entrants % Not Present
Institutes of Technology
Uni L8 % Not Present
Other Colleges L8 % Not
Present All L8 % Not Present IoT Level
6 % Not Present
IoT Level 7 % Not
Present Not Present IoT L8 % Not PresentAll IoT %
YES 16% 22% 23% 14% 20% 10% 3% 11% NO 14% 27% 27% 17% 23% 9% 4% 10%
ALL 15% 25% 26% 16% 22% 9% 4% 11%
Grant Holders as % of New Entrants
2
1
3
3
19
A
S
tu
dy
o
f P
ro
gre
ssi
on
in
Ir
ish
H
ig
he
r E
du
ca
tio
n
On average 32% of students are in receipt of a grant
nationally, although there is wide variation across the sectors and levels. In 2007/08 40% of new entrants to the institutes of technology were in receipt of a grant compared to just 25% of new entrants to the universities. Meanwhile over 40% of new entrants to level 6 and 7 courses in the institute of technology sector were in receipt of a grant.
Grant aid contributes to progression in the institute of technology sector: at level 6, the progression rates of grant-aided new entrants are 5% better than those of non-grant-aided students, at level 7 they are 4% better, and at level 8 they are 3% better. Thus overall in the institute of technology sector being in receipt of a grant increases a student’s chance of progressing and has a positive effect on non-presence rates. We know from the Equal Access Data Survey completed at registration by new entrants to HEA-funded higher education institutions for the past three years that the participation of students from the lower socio-economic groups is much better in the institute of technology sector than in any other sector.33
The socio-economic breakdown of students in the university sector outweighs the positive impact grant aid has on overall progression rates, though the multivariate analysis later in this report indicates that grant aid has a positive impact regardless of sector.
Educational attainment is also influenced by social class: the higher social classes attain higher points in the Leaving Certificate examination on average.
33 See Higher Education Authority, Higher Education Key Facts and Figures 08/09 (Higher Education Authority (Dublin: HEA, 2009).
Key points in this chapter include:
• The proportion of new entrants in 2007/08 who are not present one year later was 15% on average across all sectors and NFQ levels.
• The rates of non-presence vary strongly according to the NFQ level, ranging from 25%/26% at levels 6/7 to between 4% and 16% at level 8. They also differ according to the sector from 22% in an institute of technology to 9% in the university sector and 4% in teacher training colleges.
• Courses at NFQ levels 6/7 generally tend to enter students on a lower points (250–300) range than NFQ level 8 programmes (350–400).
• There is a clear and strong link between prior educational attainment and successful progression. Educational attainment is a very strong factor in whether or not a new entrant progresses past the first year of their course of study.
• Regardless of the sector or level that a student enters, students with lower Leaving Certificate examination points are less likely to progress to the following academic year.
• Progression of NFQ level 8 new entrants does not vary greatly between programmes of three and four years’ duration. However courses whose duration is greater than 4 years display significantly higher levels of progression.
Chapter 3:
Leaving Certificate
Attainment in
21
A
S
tu
dy
o
f P
ro
gre
ssi
on
in
Ir
ish
H
ig
he
r E
du
ca
tio
n
Introduction
This chapter examines progression in higher education within the context of students’ prior attainment in the Leaving Certificate examination in Mathematics and English.
Section 3.1:
Leaving Certificate Examination Points
In advance of examining progression, Table 3.1 below outlines the points assigned by the CAO to grades achieved in the Leaving Certificate examination.
Table 3.1: Leaving Certificate Grade Points
Grade Higher Ordinary
A1 100 60
A2 90 50
B1 85 45
B2 80 40
B3 75 35
C1 70 30
C2 65 25
C3 60 20
D1 55 15
D2 50 10
D3 45 5
As will be apparent from Table 3.1 there is some overlap in the points awarded at Ordinary and Higher level in the Leaving Certificate examination, namely in the 45–60 points range. While the data presented later in this chapter does not distinguish between points attained at Ordinary and Higher levels, scores from 60 upwards refer to a C3 grade or higher at Higher level or to an A1 grade at Ordinary level.
Section 3.2:
Mathematics Attainment
This section provides an overview of the non-presence rates of new entrants to higher education relative to their performance in Mathematics in the Leaving Certificate examination.
[image:23.624.309.552.310.546.2]Figure 2 outlines the proportion of full-time undergraduate new entrants to higher education in 2007/08 by NFQ level and sector that obtained 60+ points in Mathematics in the Leaving Certificate examination. This point’s bracket is the equivalent of a C3 grade or higher in Higher Mathematics and an A1 in Ordinary level Mathematics.
Figure 2: Proportion of 2007/08 Undergraduate New Entrants with 60+ Points in Leaving Certificate Mathematics
0% 10% 20% 30% 40% 50% 60% 70% 80% 90% 100%
University L8 Other Colleges L8 IoTs
L8 IoTs
L7 IoTs
L6 All Sectors and Levels
43% 35%
15% 7%
4% 28%
2
1
3
3
22 A S tu dy o f P ro gr es si on in Ir is h H ig he r E du ca tion Figure 3, which covers all sectors and NFQ levels, outlines the
[image:24.624.336.580.118.537.2]percentage of 07/08 full-time undergraduate new entrants who were not present in their second year by their attainment in Mathematics in the Leaving Certificate examination.
Figure 3: Non-Presence Rates by Points Attainment in Leaving Certificate Mathematics
0% 10% 20% 30% 40% 50% 60% 70% 80% 90% 100% 100 95 90 85 80 75 70 65 60 55 50 45 40 35 30 25 20 15 10 5
The figure shows that the higher the points attained in Mathematics in the Leaving Certificate examination by new entrants to higher education, the more likely it is that they will be present in the second year of their course of study. This very strong link between prior academic achievement in Mathematics and successful progression to the second year of higher education is further emphasised in the multivariate analysis presented in Chapter 6.
Table 3.2 provides the data on which Figures 2 and 3 (above) are based: it aligns the non-presence rates of new entrants to higher education to their points attainment in Mathematics in the Leaving Certificate examination, by sector and level.
Table 3.2: Non-Presence Rates34 by Leaving Certificate
Attainment in Mathematics, Sector, & NFQ Level Sector
Level Maths Points34
IoTs 6 % NP IoTs 7 % NP IoTs 8 % NP Uni 8 % NP Oth 8 % NP All All % NP 0 36% 38% 3% 14% ~ 27%
5 37% 48% 26% 15% ~ 39%
10 40% 39% 32% 21% 0% 35%
15 31% 35% 20% 19% 0% 29%
20 37% 34% 24% 18% 6% 28%
25 26% 26% 17% 17% 0% 21%
30 23% 22% 18% 13% 2% 17%
35 20% 21% 20% 11% 6% 16%
40 12% 21% 16% 11% 2% 13%
45 18% 15% 14% 10% 2% 12%
50 19% 13% 11% 9% 0% 10%
55 21% 23% 19% 6% 0% 11%
60 11% 10% 10% 7% 4% 7%
65 0% 7% 3% 5% 5% 5%
70 0% 6% 8% 7% 0% 6%
75 0% 6% 10% 5% 4% 6%
80 n/a 5% 18% 5% 5% 6%
85 ~ 25% 31% 4% 6% 6%
90 n/a ~ 25% 4% 13% 5%
95 n/a n/a n/a n/a n/a n/a
100 n/a ~ ~ 3% 0% 3%
Other 21% 24% 15% 10% 5% 14%
% of new entrants with Higher C3 (or Ordinary A1) or better in Higher Maths (excluding Other)
4% 7% 15% 43% 35% 28%
34 ~ represents cell size less than 5 students.
[image:24.624.72.312.163.414.2]2
1
3
3
23A
S
tu
dy
o
f P
ro
gre
ssi
on
in
Ir
ish
H
ig
he
r E
du
ca
tio
n
The proportion of students not presenting in their second year of study drops below the national rate for the university sector once a student has attained at least 55 points in Mathematics in the Leaving Certificate examination. However there are some anomalies at level 8 in the institute of technology sector, mainly because the actual numbers with more than 80 points in Mathematics in the Higher level Leaving Certificate examination are very small.
Section 3.3:
English Attainment
Attainment in English in the Leaving Certificate examination is another strong indicator of the likelihood of students being present in their second year of higher education, albeit to a lesser extent than prior attainment in Mathematics.36
Figure 4 outlines the proportion of 07/08 full-time undergraduate new entrants to higher education by NFQ level and sector that obtained 60+ points in English in the Leaving Certificate examination. This point bracket is the equivalent to a C3 grade or higher in Higher English and to an A1 in Ordinary level English.
36 The caveat, outlined in Section 3.1. (above), pertaining to the overlap between points attained in the Leaving Certificate at Ordinary and Higher levels also applies here.
Figure 4: Proportion of 2007/08 Undergraduate New Entrants with 60+ Points in Leaving Certificate English
0% 10% 20% 30% 40% 50% 60% 70% 80% 90% 100%
Other Colleges L8 University
L8 IoTs
L8 IoTs
L7 IoTs
L6 All Sectors and Levels
93% 90%
36% 30%
70%
67%
2
1
3
3
24A
S
tu
dy
o
f P
ro
gr
es
si
on
in
Ir
is
h
H
ig
he
r E
du
ca
ti
on Figure 5, which covers all sectors and NFQ levels, outlines
the percentage of 07/08 full-time undergraduate new entrants to higher education who were not present in their second year of study by points attainment in English in the Leaving Certificate examination.
Figure 5: Non-Presence Rates by Leaving Certificate English Points Attainment
0% 10% 20% 30% 40% 50% 60% 70% 80% 90% 100%
100 95 90 85 80 75 70 65 60 55 50 45 40 35 30 25 20 15 10 5
This chart shows that, just as high prior attainment in Mathematics increases students’ chances of progressing in higher education, so high prior attainment in English is also correlated with higher retention rates, albeit to a lesser extent.
Table 3.3 provides the data on which Figures 4 and 5 (above) are based: it aligns the non-presence rates of new entrants to higher education to their points attainment in English in the Leaving Certificate examination by sector and NFQ level.
Table 3.3: Non-Presence Rates by Leaving Certificate Attainment in English, Sector, & NFQ Level
Sector Level English Points
IoTs 6 % NP
IoTs 7 % NP
IoTs 8 % NP
Uni 8 % NP
Oth 8 % NP
All All % NP 0 29% 40% 23% 17% ~ 33%
5 33% 43% 20% 0% ~ 33%
10 35% 32% 14% 9% n/a 29%
15 46% 36% 35% 18% n/a 37%
20 29% 30% 22% 9% ~ 27%
25 34% 33% 17% 16% ~ 30%
30 34% 31% 16% 12% n/a 29%
35 33% 33% 25% 14% 17% 29%
40 18% 28% 18% 11% 0% 22%
45 31% 29% 16% 14% 0% 24%
50 31% 30% 18% 14% 0% 24%
55 27% 26% 22% 12% 0% 20%
60 25% 24% 17% 11% 3% 17%
65 20% 19% 15% 11% 6% 13%
70 19% 21% 13% 10% 2% 12%
75 12% 16% 14% 10% 4% 11%
80 8% 21% 17% 8% 2% 9%
85 12% 16% 15% 7% 2% 8%
90 12% 16% 18% 6% 1% 7%
95 n/a n/a n/a n/a n/a n/a
100 ~ 0% 27% 6% 2% 6%
Other 20% 22% 15% 10% 5% n/a
% of new entrants with C3 (or Ordinary A1) or better in Higher English (excluding Other)