THE ECONOMIC AND SOCIAL RESEARCH INSTITUTE COUNC~
* W.G.H. QUIGLEY CB, President of the Institute. * JOSEPH F. HARFORD, Chairman of the Council
G.T. PAUL CONLON, Chairman, ESRl Fund-Raising Committee 1995-2000. SEAN CROMIEN, Former Secretary, Department of Finance.
DONAL DE BU1TLEIR, General Manager, Office of the Chief Executive, AIB Group plc. * CONNELL FANNING, Professor, Department of Economics, University College, Cork.
MARY FINAN, Managing Director, Wilson Hartnell Public Relations Limited. MAUREEN GAFFNEY, Chairperson, The National Economic and Social Forum. DONAL GARVEY, Director General, Central Statistics Office.
PATRICK GEARY, Professor, Department of Economics, National University of Ireland, Maynooth.
BRIAN GEOGHEGAN, Director of Economic Affairs, Research and InJbrmation, IBEC. PAUL HARAN, Secretary General, Department of Enterprise, Trade and Employment. * JOHN HURLEY, Secretary General, Department of Finance.
ALFIE KANE, Group Chief Executive, eircom plc.
MICHAEL KELLY, Secretary General, Department of Health and Children. EDWARD F. McCUMISKEY, Chief Executive & Secretary, Advertising Standards
Authority for Ireland.
ALAN MATTHEWS, Professor, Department of Economics, Trinity College Dublin. MICHAEL J. MEAGHER, Former Director, Bgmk of Ireland.
STEPHEN MENNELL, Professor, Department ~of Sociology, University College Dublin. * DONAL NEVIN, Former General Secretary, Irish Congress of Trade Unions.
* TOM~S F. 0 COFAIGH, President of the Institute, 1987-1995. MAURICE O’CONNELL, Governor, Central Bank of Ireland. * MARIE O’CONNOR, Partner, PricewaterhouseCoopers.
KEN O’HARA, Chief Executive, Electricity Supply Board.
WILLIAM ROCHE, Professor, The Michael Smur.fit Graduate School of Business, University College Dublin.
ROELOF SCHIERBEEK, Chairman, Northern lreland Economic Research Centre. * NOEL SHEEHY, Professor, Department of Psychology, Queen’s University of Belfast.
EDMOND SULLIVAN, Secretary General, Department of Social, Community and Family Affairs.
T.K. WHITAKER, President of the Institute 1971-1987. * BRENDAN J. WHELAN, Director of the Institute.
* PADRAIC A. WHITE, Chairman, Northside Partnership Limited.
*Members of Executive Committee
REVIEW
2001-2007
DAVID DUFFY JOHN FITZ GERALD
IDE KEARNEY JONATHAN HORE CONALL MACCOILLE
SEPTEMBER 2001 NUMBER 8
Copies of this paper may be obtained from The Economic and Social Research Institute (Limited Company No. 18269). Registered Office." 4 Burlington Road, Dublin 4.
www.esri.ie
Authors
John Fitz Gerald is a Research Professor, Ide Kearney is a Research Officer, David Duffy is a Research Analyst, Jonathan Hore and Conall MacCoille are Research Assistants with The Economic and Social Research Institute.
Contributors
REVIEW
2001-2007
DAVID DUFFY JOHN FITZ GERALD
IDE KEARNEY JONATHAN HORE CONALL MACCOILLE
© THE ECONOMIC AND SOCIAL RESEARCH INSTITUTE DUBLIN, 2001
ACKNOWLEDGEMENTS
Work on this year’s Medium-Term Review has been an ongoing process, which involved many experts both from within and outside of The Economic and Social Research Institute. Significant contributions to this Review have come from Denis Conniffe, John Eakins, Sue Scott, Edgar Morgenroth, Miriam Wiley, Brendan Whelan, all of the ESRI, and from Aedin Doris, of NUI Maynooth, and Frances Ruane of TCD, a visitor at the ESRI. The editors are veW grateful to Danny McCoy, editor of the Quarterly Economic Commentary, for assistance with the interface between the QEC and the Review. In preparing the Review for publication the authors have drawn heavily on the expertise of the Director and staff of the ESRI.
Over the last six months, we have been in contact with several leading institutions and experts from various fields of the economy. Such meetings as always proved to be more than useful. In particular we would like to thank the Departments of Finance, Public Enterprise, Trade and Employment, Environment and Local Government, Teagasc, Forffts, the CSO, the ESB, SIPTU, IBEC, EIRGRID, BORD
Gfi,IS, John Beggs, Marian Finnegan, Patrick Honohan, Jim O’Leaw, Jim Power and Brendan Riordan. Once again the National Institute of Economic and Social Research, London, proved to be invaluable in offering advice and in allowing us access to their global econometric model, NiGEM which enabled us to fommlate the External Environment section of this year’s Review, as well as
allowing us to carry out various shocks in the model.
The cartoons that appear in the summary were prepared by Jirmny Burns.
The last word of thanks goes to Pat Hopkins, Regina Moore, Mary Cleary and Deirdre Whitaker all of the ESRI, because without their professionalism, expertise and attention to detail, publication would simply not have been possible. Finally, the authors themselves are solely responsible for the views and
A CKNO1~EDGEMENTS SUMMARY
Chapter 1 2 3 4 5 6 7
INTRODUCTION GROWTH IN THE 1990s
THE EXTERNAL ENVIRONMENT THE BENCHMARK FORECAST ALTERNATIVE SCENARIOS POLICY IMPLICATIONS CONCLUSIONS
APPENDIX TABLES
Page iv vii
SUMMARY
Introduction This Review has been finalised in the aftermath of the appalling events of the 11th of September 2001. The full significance of these events will obviously take some time to sink in and it is too early to assess their short-term implications for the world economy, or for Ire’land. However, the focus of this Review is on the medium term out to 2007 and our analysis suggests that, whatever serious temporary difficulties the Irish economy may face over the next two years, it is probable that the eventual recovery phase will see a return to rapid growth. While the world economy experienced a severe shock, for example, at the time of the Gulf War, longer-term trends ultimately reasserted themselves. Given the underlying strength of the Irish economy, it is likely that it will also make up for any lost ground over the course of the decade.
The detailed analysis in the Review was undertaken before the 11’’1 of September, but because of the uncertainty that already existed, two scenarios were considered: a reasonably benign scenario, as in our Benchmark forecast (Chapter 4), and an alternative Slowdown scenario (Chapter 5, Section 5.2). When undertaking the analysis it was anticipated that the most likely outturn would be closer to the Benchmark forecast. However, it now seems more likely that the Slowdown scenario may be closer to reality. In the case of both scenarios the medium-term growth rate for the economy over the decade is very similar, the main differences being over the timing of future improvements in living standards.
The last five years of growth have finally convinced doubters that the process of accelerated economic convergence is not a mirage and that the Irish economy has come of age. The last Review, published two years ago, proved unduly pessimistic in that it expected the exceptional growth rates of the 1995-1998 period could not continue into the present decade. The record shows that growth in 1999 and 2000 remained at exceptional levels and that it continued into this year. However, a change in pace was inevitable, even without a shock to the world economy. The unused resources, especially in the labour market, that made exceptional growth possible, are almost used to capacity, and infrastructural constraints are apparent to all.
In this Review we explain why the Irish economy still has the capacity to grow more rapidly than most of its EU neighbours, albeit at a slower pace than in the last five years. This analysis shows a reassuringly robust economy facing into an uncertain external environment. However, because of ominous external developments, the economy may have a difficult period in the immediate future. Provided that prudent domestic policies are followed, the damage done by a temporary slowdown should not be too serious, and any negative effects should be readily reversible.
Growth in the 1990s
A key factor in expanding the growth potential of the economy over the 1990s was the very rapid growth in labour supply. For centuries Ireland had "too much" labour and not enough jobs. Chapter 2 shows that what made the last decade different was that the combined benefits of improved access to the EU market and increased foreign direct investment raised the demand for
goods and services produced in Ireland, while Irish productivity was greatly increased by investment in human capital.
The velT large inflow of young people into the labour force was further augmented by the rapid rise in female labour supply. In addition, over the last five years substantial immigration of skilled labour expanded the productive capacity of the economy, facilitating the employment of many of the less skilled who had been unemployed.
The External Environment
The changing structure of the Irish economy has, if anything, made it more dependent on developments in the EU and world economies. Thus in Chapter 3 we give detailed consideration to the prospects for the US, the EU and the UK economies. In the case of the US, the imbalance between domestic savings and investment, reflected in the US balance of payments deficit, has been increasing steadily over recent years. While the US economy has slowed this year, it seems unlikely that this structural problem will be solved without a major change in the external value of the dollar. Under these circumstances it is assumed that the current period of low growth in the US continues through 2002 with the euro reaching parity with the dollar. This change in the exchange rate will help move the US economy back onto a sustainable growth path.
For the Euro area, the appreciation of the currency will adversely affect competit-iveness, aggravating the ,problems arising from the .weakness .o£ world trade, While euro interest rates will fall substantially as inflation rates fall, it will be 2003 before the. EU returns to a growth rate in line with its potential. For the UK the weakness in world, demand will be partly offset by
a weakening in sterling.
The Benchmark Forecast
SUMMARY IX
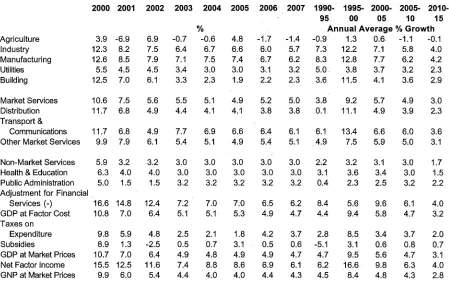
Table 1: Benchmark Forecast, Growth in Major Aggregates
2000’ 200
GNP 9.9: ~ 6:0 : 5:4 :’~4,4 40
Consumption
Deflator 5:8 4,8, 3:
Employment, April 4~.8 413 Real After ~Tax Non-,
Agricultura wage 2,1 5.2,, 5.8 4.2," 2J Per Cent of GI Bala nce of Payments
Surplus, ~0:7,-0,9
Debt- GNP Rati0 42,! General GOvernment ,
Surplus 5A
Unemployment Rate 4,3 3.8> , 3,6
2005-~ 2010, 1o~ 15
GroWth
3 2.8
) 3:2
0:7
2.5 2.4
2015’
0.8 ,2:3
.... 0;9 ’1.5
)O 2005: 2010: 2015 &0 4.1
In this Review our Benchmark forecast, presented in Chapter 4, assumes that the economy slows gently from the exceptional growth rate of the last five years. This must be considered a relatively benign scenario as there is the veW real possibility that the US economy will face an unpleasant adjustment process over the next few years. If the economic difficulties of the US continue into next year, other aspects of the external environment will turn sour and the alternative Slowdown scenario, discussed in Chapter 5, may turn out to be correct.
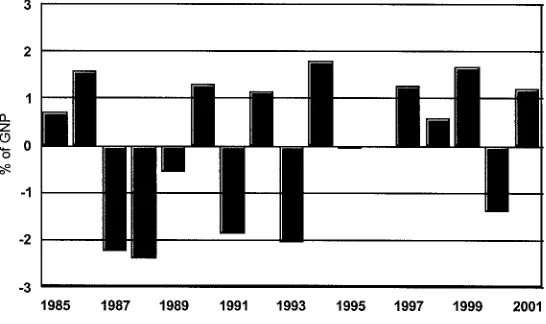
In the Benchmark forecast, shown in Table 1, growth in GNP over the period 2000 to 2005 is projected at an average of 4.8 per cent a year (see Figure 1), compared to the annual growth in potential output of around 5 per cent. The result will be some rise in unemployment, peaking in 2005 at around 5.8 per cent of the labour force. In the subsequent five year period the economy could grow more rapidly than potential, averaging 4.3 per cent a year,..returning the labour market to full employment. However, as in the past,, the labour market will be slower than output to respond both to a slowdown and a recovery, and once unemployment rises temporarily, it will take a number of years before "full employment" is restored.
Figure 1: Average Annual Volume Growth Rates in GNP o
Average Annual Yo Growth 9
1985-90 1990-95 1995-00 2000-05 2005-10 2010-15
Over the next three years the general government surplus is likely to fall by around 2.5 percentage points of GNP (Table 1).1 This reduction is expected as the economy grows below its long run potential. It is assumed
that throughout this period the government neither tightens its belt nor stimulates the economy, adopting a broadly "neutral" fiscal policy.
The prolonged growth of the 1990s has moved Ireland from being one of the least developed members of the EU to a position where it enjoys a GNP per head that is roughly at the EU average. While on this basis Ireland could enjoy an income per head 8 per cent above the EU average in 2010, because of the infrastmctural deficit that exists, the standard of living, broadly defined, will still only approach the EU average in 2010.
In the medium term, the growth in employment will be significantly slower than over the last decade. The growth over the five years 2000 to 2005 will average 2 per cent a year, compared to almost 5 per cent a year between 1995 and 2000. In the 1990s the very rapid growth in employment needed to move the economy to full employment, in turn, required a considerable improvement in competitiveness. This was achieved through moderate wage growth and a resulting rise in the profit rate. However, with the economy currently close to full employment, this situation has changed dramatically. Wage rates are now rising rapidly relative to our competitors and the resulting loss of competitiveness will restrain future employment growth. There remains the danger that we could find that too much competitiveness has been lost, especially in the face of a serious downturn. However, in our Benchmark forecast we assume that market circumstances produce a moderation in wage inflation in the medium term and that the growth in productivity, while slower than in the late 1990s, still greatly exceeds that in our competitors.
The rapidly rising population in the young adult age groups will continue to put pressure on the housing market. It is anticipated that around 45,000 dwellings a year will be needed to meet demand over the course of the decade.
The growth in the economy, while much less energy intensive than in the 1970s, will result in a continuing rise in the demand for energy. While policies in place will see some savings in greenhouse gas emissions compared to a business as usual scenario, on the Benchmark scenario forecast emissions will still be over 21 per cent above 1990 levels in 2010 compared to the limit under the Kyoto protocol of 13 per cent.
Alternative
Scenarios
In Chapter 5 we consider a number of different scenarios for the future. In the Slowdown scenario we assume that the US economy undergoes a more severe economic adjustment than in the Benchmark forecast and that it does not return to a satisfactory growth rate until 2003. The result would be a major ,’eduction in foreign direct investment into Ireland. This, combined with the fall in world trade, would create an atmosphere of considerable uncertainty. With rising unemployment many would feel insecure and the result would be a rise in personal saving and a temporary fall in the demand for housing. The consequence could be a fall in house prices of 25 per cent, further aggravating the atmosphere of insecurity. While the analysis in this Review would suggest that this would be a temporary setback, the domestic response by firms and households fearing a more permanent reversal of economic fortunes could aggravate the slowdown.
SUMMARY XI
Table 2: Slowdown Forecast, Major Aggregates
2010-Ge
Figure 2: Alternative Forecasts for GNP
80
o~ 70
~ 65
8 6o 55 502000 2001 2002 2003 2004 2005 2006 2007 Benchmark m Slowdown m.. High - a, Low
Under this scenario growth next year would fall to just under 2 per cent (Table 2). However, the economy would begin to recover in 2003 and, from 2004 onwards, growth would be more rapid than in the Benchmark. The loss of potential output would be made up by 2005. The result of such a shock would be a small fall in employment next year and a significant rise in the unemployment rate. The unemployment rate would peak at around 7.6 per cent of the labour force in 2003, before returning to the full employment level at the end of the forecast period. This scenario could also push the general government balance into deficit in 2004.
As shown in Figure 2, while this scenario implies much slower growth in GNP in the next two years than in the Benchmark, the eventual rapid recovery phase would, before the end of the decade, return the Irish economy to where it would have been without the serious external shock. The ultimate economic cost would be the temporary rise in unemployment and the loss of output and income in the intervening years.
We also consider scenarios where the average annual growth in potential output of the economy over the decade is either one per cent higher or one per cent lower than in the Benchmark forecast (see Figure 2). The simulation involving higher growth suggests that if that higher growth were achieved through much higher rates of immigration there would be a need for a considerably larger investment in infrastructure over the course of the decade. On the other hand, if it were achieved through higher productivity growth there would be a significant positive impact on the standard of living.
Policy Implications
The analysis in the Review suggests that, over the course of the coming decade, a number of domestic constraints may prevent the economy achieving its potential growth rate. The most obvious constraint arises from the inadequacy of current infrastructure. There are not enough dwellings to accommodate the growing population of adults, augmented by the likely continuing net immigration of skilled labour. The shortage will directly affect the standard of living and will reduce the incentive for Irish emigrants (or new immigrants) to return. However, the problems in the housing market are a symptom of a wider infrastructure deficit in sanitary services, in public transport, in roads and in many other areas of public infrastructure.
The second related constraint on the econonly arises from the deceleration in labour supply growth. It is only through further increasing participation or immigration above the levels assumed in the Benchmark that this constraint can be relaxed. However, this might not significantly increase income per head in the economy.
The uncertainty about the forecasts suggests that future governments should aim for policies that will be robust in the face of surprises. Attempting to fine tune the economy could result in incorrect forecasts producing inappropriate policies. Robust policy would suggest a concentration on areas where public policy can impact on the supply potential of the economy in the medium term:
¯ It is important that fiscal policy is prudent, pursuing a broadly neutral stance. This would involve significant restraint compared to the experience of the last five years. However, if such an approach is adopted, even in the Slowdown scenario the public finances would only show a small deficit before returning to surplus by 2005. This would not pose a problem, allowing the National Development Plan (NDP) programme of accelerated investment in infrastructure to continue. It would also be well within the Maastricht criterion and the requirements of the Stability and Growth Pact. In the medium term it is appropriate to aim for an average general government surplus of 1 per cent of GNP each year, equal to the contribution to the national pension fund.
¯ The forecasts here assume a limited improvement in public services in the medium term. However, depending on public preferences, a more rapid improvement in seladces, including health services, could be achieved at the cost of higher taxes, or taxes could be cut further at the cost of a lower quality of public services.
¯ The full implementation of the infrastructural investment under the NDP will play a vital role in expanding the capacity of the economy to grow in the future. It remains essential that all such investment represents good value for money.
¯ Immigration of skilled labour in the past has expanded the capacity of the economy, and it is likely to continue to do so in the future. However, there is a need to develop a transparent and fair policy on immigration that also covers unskilled labour. Such a policy should be administered directly by the state and it should allow immigrants the freedom to choose their own employment.
SUMMARY XIII
of adversity. This could require downward flexibility in wage rates should a deterioration in the economy prove more severe than expected. ¯ While significant progress has been made in advancing competition and
regu!atolT reform, with beneficial effects on productivity growth, it will be important to make further progress in the medium term in important areas such as energy, transport and local authority services.
¯ Rapid economic growth will put continuing pressure on the quality of our environment. In taking action to tackle these problems it will be important that suitable fiscal instruments, such as taxes and charges, are used to ensure that the desired environmental objectives are met at minimum cost.
The exceptionally rapid rate of economic growth in the last five years has meant that Ireland has not yet fully adjusted to its position as one of the wealthiest countries in the world. This new affluence provides a range of opportunities to improve the standard of living.
While in the past the priority has been the maximisation of the growth in GNP to deal with the problem of unemployment, the advent of near full employment may change priorities. The experience elsewhere in Europe has been that citizens chose to take some of the increase in their standard of living in the form of increased leisure, rather than in increased nominal incomes. Over the coming decade Irish citizens will have the same choice. Another choice made by many of our EU neighbours was to take some of the increase in their standard of living in the form of more family friendly policies, such as flexible working arrangements. This too is an option for Ireland. While the move to vew low unemployment rates has made a significant contribution to reducing poverty, the new found wealth of the current decade will provide the opportunity to make significant further progress in coming years.
The population will age quite rapidly over the coming decade. While it will not bring major problems for the health services in the forecast period, it will impact on the economy and society. It will make the economy less flexible and it will see a change in the pattern of demand for goods and services. The rapid rise in the average educational attainment of the population will also change behaviour and aspirations.
1.1 Introduction
This Review has been prepared in the aftermath of the appalling events of the 11’h of September 2001. The full significance of these events will obviously take some time to sink in and it is too early to assess their short-term implications for the world economy, or for Ireland. However, the focus of this Review is on the medium term out to 2007 and our analysis suggests that, whatever serious temporary difficulties the Irish economy may face over the next two years, it is probable that the eventual recovery phase will see a return to rapid growth. While the world economy experienced a severe shock, for example, at the time of the Gulf War, longer-term trends ultimately reasserted themselves. Given the underlying strength of the Irish economy, it is likely that it will also make up for any lost ground over the course of the decade.
The detailed analysis in the Review was undertaken before the 11’h of September, but because of the uncertainty that already existed, two scenarios were considered: a reasonably benign scenario, as in our Benchmark forecast based on the July Quarterly Economic Commentary (Chapter 4), and an alternative Slowdown scenario (Chapter 5, Section 5.2). When undertaking the analysis it was anticipated that the most likely outturn would be closer to the Benchmark forecast. However, it now seems more likely that the Slowdown scenario may be closer to reality. In the case of both scenarios the medium-term growth rate for the economy over the decade is very similar, the main differences being over the timing of future improvements in living standards.
The last five years of growth have finally convinced doubters that the process of accelerated economic convergence is not a mirage and that the Irish economy has come of age. The last Review published, two years ago, proved unduly pessimistic in that it expected the exceptional growth rates of the 1995-1998 period could not continue into the current decade. The record shows that growth in 1999 and 2000 remained at exceptional levels and that it continued into this year. However, a change in pace was inevitable, even without a shock to the world economy. The unused resources, especially in the labour market, that made exceptional growth possible, are almost used up, and infrastructural constraints are apparent to all.
2 MEDIUM-TEIhM REVIEW 2001-2007
market. Looking to the prospects for the economy over the coming decade, we have assumed that no change in policy in Ireland or outside will seriously endanger this fruitful relationship.
Recent economic growth in Ireland has not rewritten the laws of economics and, in the short to medium term, whatever policies we adopt, Ireland will not be able to avoid a major international downturn, should it occur. Thus, we have aveW keen interest in seeing policies pursued at a wider EU level that will help minimise the problems caused by any temporaW slowdown.
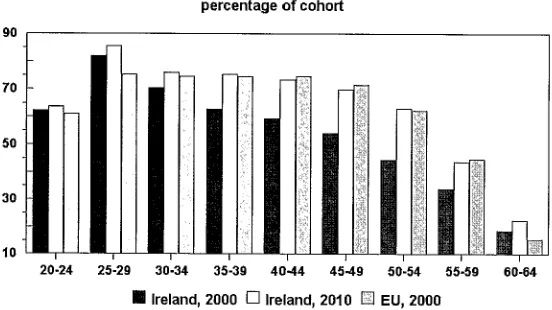
Whether or not the h’ish economy achieves a "soft landing" in the next two or three years, the medium-term prospects out to the end of the decade remain bright, with the economy having the potential to grow more rapidly than its EU neighbours. Thereafter, the special factors that are currently enhancing its growth potential, will be spent. The labour force growth rate, excluding migration, will fall steadily over the decade as the population ages. Also by 2010, female labour force participation will be veW high - broadly comparable to the rest of the EU members in Northern Europe. In addition, as the labour force and the population as a whole age, the current degree of labour market flexibility will diminish.
However, such outperformance is not inevitable and domestic policies will play an important part in ensuring that this potential is realised in practice. Over the next three years it will be important that domestic policies act to stabilise the economy in the face of the uncertain external environment. This will involve a cautious approach to fiscal policy, combined with a continuing focus on suitable infrastructural investment.
The prolonged growth of the 1990s has moved Ireland from being one of the least developed members of the EU to a position where it enjoys a GDP per head that is well above the EU average. However, in Ireland’s case, GDP provides a misleading indication of the growth in the standard of living. As discussed in Chapter 4, when GNP per head is used as the income measure, Ireland’s convergence is seen to be slower, approximating the EU average this year. Indeed, even using the more appropriate measure of GNP per head, the Benchmark forecast shorting .Ireland could enjoy an income per head 8 per cent above the EU average in 2010, is also something of an exaggeration. The rest of the EU is currently investing around 21 per cent of its income to maintain or upgrade its infrastructure, while Ireland is spending closer to 28 per cent. This higher investment rate is necessary to raise the private capital stock and to provide the necessary public infrastructure. Even with this higher level of investment, Irish infrastructure, and the related welfare enhancement that it provides, will still be inferior to the EU average in 2010. This reflects the fact that, while Ireland may now enjoy an EU average income per head, in terms of wealth it remains a poorer neighbour. It is only after a sustained period of above average investment has closed this gap, likely to occur after 2010, that the higher income per head will translate into a higher standard of living.
1.2
Outline of
Review
The success of the economy over the last decade is analysed in Chapter 2. The results provide an essential basis for the rest of the Review.
the euro is assumed to reach parity with the dollar next year, and this will help move the US economy back onto a sustainable growth path.
For the Euro area, the appreciation of the currency will adversely affect competitiveness, aggravating the problems arising from the weakness of world trade. While euro interest rates will fall substantially as inflation rates fall, it will be 2003 before the EU economy returns to a growth rate in line with its potential. For the UK the weakness in world demand will be partly offset by a weakening in the value of sterling.
All of this indicates a temporary deterioration in the external environment facing the Irish economy next year. However, if the world economy bounces back in 2003 there should be no long-term damage to the domestic economy. Chapter 4 describes the Benchmark forecast for the h’ish economy out to 2007. The forecasts for 2001 and 2002 are taken directly from the July Quarterly Economic Commentary. In the short term this scenario must be seen as moderately optimistic. However, for the medium term it provides our best estimate of the potential growth rate of the economy.
The growth in potential output over the period 2000-2005 seems likely to be around 5 per cent a year - unchanged from our estimate in the last Review. In the second half of the decade it is likely to fall to 4 per cent a year and to 3 per cent a year in the early years of the next decade. This forecast decline in the potential growth rate is primarily due to the changing demographic profile of the population.
The short-term unfavourable external situation may see the economy growing somewhat less rapidly than its potential out to 2005. The consequence could be some limited rise in unemployment. Thereafter, more rapid growth should return the economy to full employment.
The implications of this forecast for the housing market and for energy demand and emissions of greenhouse gases are explored at the end of Chapter 4.
In Chapter 5 we examine a range of alternative scenarios, a range within which the actual future outturn should fall. In the first scenario we consider the possible impact of a major slowdown in the world economy in the next few years. The results suggest that the Irish economy is fairly robust and, with good management, should weather the effects of a slowdown without any long-term damage.
We also consider scenarios where the growth in potential output of the economy is either 1 per cent higher or 1 per cent lower than in the Benchmark forecast. These scenarios show that bad management of the domestic economy could result in serious underperformance in the medium term. Success is not guaranteed. The simulation involving higher growth suggests that if that higher growth were achieved through much higher rates of immigration, there would be a need for a considerably larger investment in infrastructure over the course of the decade. On the other hand, if it were achieved through higher productivity growth there would be a significant positive impact on the standard of living.
In Chapter 6 we first consider how the likely improvement in living standards in the medium term may be used. While the prospect of higher GNP per head will mark an improvement in living standards, it is not a perfect measure of welfare. Wider quality of life issues are likely to pose new choices for society. Second, we explore the policy options and we discuss what measures will be needed to steer the economy through the possibly unsettled waters of the next few years. The growing wealth of the economy and the rapidly changing demographic profile will alter the environment in which the economy operates. There will be a need to look anew at the strategic priorities for the economy.
4 MEDIUM-TEPdvl REVIEW 2001-2007
1.3 Methodology
1999. Any temporary loss of output and rise in unemployment in the short run can be reversed within the time horizon of this forecast. There is a danger that essentially transient difficulties could lead to a panic reaction, further aggravating the temporary problems.
In this Review we have chosen to emphasise the forecast changes in major aggregates over a number of years, generally five-year averages, rather than the forecasts for individual years. That is because we feel that much wider margins of en’or attach to the forecasts for individual years than to the forecast trend growth rates.
As discussed in the Appendix to Chapter 4, our forecasting record, while better than average, is still not perfect. As a result, in preparing our forecasts we have presented a number of scenarios reflecting the range of uncertainty that surrounds our forecast of the growth in the potential output of the Irish economy.
The forecast presented in this Review, and the analysis underlying the range of different scenarios, has been developed with the assistance of four different economic models.
In developing our forecast for the world economy and the external environment for the Irish economy we have used the NiGEM world model of the National Institute of Economic and Social Research in the United Kingdom. Using this model allows us to simulate different options on how the US economy is likely to cope with its internal imbalances and how these different options are likely to affect the rest of the world. It also allows us to examine how changes in exchange rates may affect the economic prospects for the major world economies. The benefit of such a model is that it allows "what if" experiments to see how sensitive our forecasts are to changes in different underlying assumptions. This model has proved an essential tool in preparing a consistent set of forecasts for the major world economies of relevance to Ireland.
In analysing changes in the population structure that are taking place we have used a demographic model of the Irish economy. This model uses very detailed data from successive CSO Labour Force Surveys and Quarterly National Household Surveys on labour force status broken down by level of education, age and sex. The model is driven by the educational attainment of the population. In the model individuals, as they reach the age of 20, are assigned a level of education based on current trends. This level of education has a major impact on their labour force behaviour. The model is used to pro-je-& births, deaths, the population, the labour force, the number of households, and the human capital of the work force. The level of migration is input into the demographic model having itself been determined in the macroeconomic model.
The HERMES macroeconomic model3 has been used for over a decade in preparing successive Medium-Term Reviews. While any forecast involves many assumptions-that rely on the authors’ judgement, this model is an essential tool in ensuring the internal consistency of the resulting forecast. In addition, the model is an indispensable tool for undertaking the kind of sensitivity testing we have used extensively in the Review, and in developing a range of scenarios that are internally consistent.
The latest version of HERMES has been re-estimated using data from National Income and Expenditure, 1999. A number of significant changes
3 Tile first version of the model is described in Bradley, J., J. Fitz Gerald, D. Hurley, L. O’Sullivan and A. Storey, 1993, "HERMES: A Macrosectoral Model for the Irish Economy", in Commission of the European Communities (ed.), HERMES.. Harmonised Econometric Research for Modelling
Economic Systems, North Holland. Also see Bradley, J. and J. Fitz Gerald, 1991, "The ESRI
have been made to the latest version of the model. These include ,the addition of a model of the housing market, based on the work of Murphy and Brereton, 2001,4 and a new model of consumer behaviour that incorporates the effects of changes in the value of personal housing wealth.
Finally we have developed and used a model of the labour market that breaks labour demand and supply down into its unskilled and its skilled components. This model is described in Chapter 2,5 and has already been used in the December 2000 Quarterly Economic Commentary.
4 Murphy, A., and F. Brereton, 2001, "Modelling Irish House Prices: A Review", paper presented at the Irish Economic Association Annual Conference, April.
2. GROWTH IN THE 1990S
The growth performance of the Irish economy in the 1990s led to rapid convergence of GDP per capita with the EU average and rapid growth in employment and living standards. In this chapter we identify and assess factors which have been important in driving this recent growth. We concentrate on medium-term supply-side factors that increased the growth potential of the economy during the 1990s. Of course accommodating
domestic policies and a stable macroeconomic environment were central to the realisation of this growth potential over the period.
In Chapter 2 of the previous Medium-Term Reviewt we explored the convergence in Irish GDP per head on the EU average in terms of two processes, convergence in productivity levels and convergence in economic dependency rates. There has been a relatively steady pace of convergence in levels of productivity since accession to the EEC in 1973, which accelerated in the late 1980s as Irish productivity growth rates increased. By contrast, Irish economic dependency rates were much higher than the EU average until the beginning of the 1990s. The rapid decline in the Irish dependency ratio in the 1990s arose through falling unemployment, rising participation rates and an increase in the working age population.
In Section 2.1 we review these processes. Convergence in productivity levels to the EU average began with accession to the EU. Since then the Irish economy has become very open with very large flows of Foreign Direct Investment (FDD from the US that accelerated sharply in the 1990s. Throughout this period rising levels of education have increased the productive potential of the labour force.
The growing importance of the foreign-owned multinational sector has led to large changes in the structure of the economy that have had profound implications for the labour market. Persistent high unemployment in the 1980s led to massive out-migration flows, particularly among more educated workers who were attracted abroad by higher wages and better employment opportunities. This stock of skilled labour abroad effectively meant that even though the demand for labour shifted in favour of more educated workers there was a ready supply of skilled labour from abroad to meet the higher demand. The acceleration in growth in the 1990s led to large in-migration flows as emigrants returned home, while labour force participation rates rose, driven by increased participation of women in the workforce.
In Section 2.2 we formalise this discussion using a small structural model of the Irish labour market, separately distinguishing between skilled and unskilled labour. This model is used to examine the role of a range of different factors in driving the growth in productivity and GDP per capita in the 1990s. Specifically we look at the role of FDI and investment in human capital in driving productivity growth. We also assess the role of favourable shifts in labour supply, through immigration, increasing female labour force participation and demographic changes, in increasing the productive capacity of the economy. Section 2.3 concludes.
1
2.1 Convergence and Productivity
2.1.1 TI-IE GROWTH RECORD
The Irish economy almost doubled in size between 1990 and 2000 in terms of GDP (increase of 98 per cen0. This remarkable performance led to full convergence with EU average GDP per capita in 1997 and close to full convergence of GNP per capita by 2000. Figure 2.1 plots the ratio of Irish GDP and GNP per capita to the EU average. Between 1960 and 1990 there was effectively no convergence with the EU, but over the past decade the sharp acceleration in growth has led to full catch-up. The graph also illustrates the widening gap between GDP and GNP in Ireland - a consequence of the growing importance of the foreign-owned multinational sector in the economy.
Figure 2.1: Irish GDP and GNP Relative to the EU-15 Group of Countries
Ireland as % of EU average, in PPS
120
,10
lOO
go
/f"
’f
6O
50 ] i i i i i i i i i i i i i i i i I i i i i i i i i t i i i [ i ~ i i i i i i i i ,960 1964 1968 1972 1976 1980 1964 1988 1992 1996 2000
¯~- GDP per head ~ GNP per head
Looking back across the growth performance over the past forty years it is clear that in the last decade the economy has grown at a rate well above its past trend. Figure 2.2 plots the average growth rate in GDP, GNP and GNDI (Gross National Disposable Income). The last is GNP adjusted for the terms of trade and transfer income and is a more accurate measure of national income. With the exception of the first half of the 1980s, when fiscal retrenchment and the external recession knocked the economy off course, between 1960 and 1990 there was relatively little deviation from an apparent trend growth in GDP of 4 per cent a year, with similar growth in GNP and GNDI. In the 1990s average growth in GDP was 7 per cent per year, while GNP averaged 6.5 per cent and GNDI 5.5 per cent. So, while the widening gap between output and incomes in the 1990s means that ever higher growth rates in output are necessary to maintain a constant growth rate in income, the recent
acceleration in output growth has been sufficient to also raise the growth in income above past trends.
8 MEDIUM-TERM REVIEW 2001-2007
Figure 2.2: Per Capita Measures of Output and Income
Annual Average Growth 1961-2000, Five Year Averages
10
62.-65 66-70 71-75 76-80 81-85 86-80
[] GDP [] GNP [] GNDI
91-95 96-00
Figure 2.3: Relative Productivity
Ireland as % of EU Average, in PPS
120
11o
lOO
9o
80
70
60
t I t I I I I I I I I I I I I I I I I I I I I I I I I I I I I I I I I I I I I I I 1960 1964 1968 1972 1976 1980 1984 1988 1992 1996 2000
GNP per person employed "-"-- GDP per person employed
The explanation for the contrast between relative output per head and per person employed lies in the movement of the economic dependency ratio -the ratio of -the population not in paid employment to those who are at work. The relationship between productivity, economic dependency and GNP per head can be understood as follows:
GNP = GNP Employment Employment Population yopu~tion ~---’-’-~---’----~
GNP per capita GNP per worker EconomiC(inverse)Dependency
In terms of economic dependency, it was not until the beginning of the 1990s that the very high levels of Irish dependency started to fall (Figure 2.4). The rapid improvement in the Irish dependency ratio in the 1990s arose through falling unemployment, rising participation rates and demographic changes in the age structure of the population. To illustrate these changes we use the following decomposition:
Employment Population
J Y DependencyRafio (inverse)
Employment LabourForce Pop15-64 LabourForoe" Pop 15-64 Population Employment Participation AgeDepend~mcy
Figure 2.4: Economic Dependency
Dependents per person employed
2.4
2.2
2
1.8
1.6
1.4
1.2
1960 1964 1968 1972 1976 1980 1964 1988 1992 1996 2000
The first term on the right hand side of the equation measures employment as a proportion of the labour force. This is equal to one minus the unemployment rate. The second term measures the labour force participation rate. The third term is the inverse of one plus the age dependency ratio, the population aged below 15 and above 65 as a proportion of the population of working age.
Figure 2.5 plots the growth in GNP per capita decomposed into growth in productivity, employment, participation and age dependency. It is clear from the chart that productivity growth has been strong throughout the past forty years. The fall in GNP per capita in the early 1980s was primarily due to a sharp decline in employment.
Figure 2.5: Decomposition of GNP Per Capita
Annual Average Growth Rate 1961-2000
8
6
4
2 0
-2 -4
62-65 66-70 71-75 76-80 81-85 86-90 91-95 96-00
~-,D ~ GNP Per Capita ~ Employment ~ Participation ~ Dependency Productivity
The graph indicates that since 1990 each of the factors - productivity, employment, participation and dependency - have made net positive contributions to growth. In this section we discuss each of these factors in turn before turning to a more formalised analysis of their interaction in Section 2.2.
2.1.2 PRODUC’TIVlTY: FDI ~ HUMAN CAl’rrAt
10 MEDIUM-TEP, M REVIEW 2001-2007
export-oriented growth in high-technology sectors increased the productivity of the manufacturing sector and an increase in general education levels increased the productive capacity of the workforce.
Beginning in the 1960s the economy began to industrialise - the share of agriculture in GDP fell from one-quarter to one-fifth in the 1960s alone. The opening up of the economy to trade and accession to the EEC in 1973, culminating in the completion of the single market in 1992, ted to increased international competition within the Irish traded sector and dramatic changes in the size and structure of the sector. In the 1970s and 1980s there was significant restructuring away from low-productivity, traditional industries
.... 2 .
towards high-productivtty high-technology industries. By the end of the 1990s, the high-tech sector accounted for more than half of all manufacturing employment (see Figure 2.6).
Figure 2.6: Structure of Manufacturing Employment
Share of Total Manufacturing Employment, %
60
0
1960 1965 1970 1975 1980 1985 1990 1995 2000 "-=-- High Tech "--- Traditional --*- Food
Within the manufacturing sector, measured productivity in the high-tech sector has, since 1980, recorded extraordinarily high growth rates. Although profit-switching transfer pricing seriously distorts these data,3 they do also
4 capture the very high productivity rates within the high-tech sector, as reflected in the much higher wages earned in foreign industry.’
There have been profound implications arising from the large inflows of Foreign Direct Investment (FDI) into the Irish manufacturing sector since accession to the EU. First, it has led to the development of a high-growth, export-oriented sector and has led to a shift towards more high-skilled production. Second, it has reduced dependence on the UK as the main market for Irish exports. Third, Ireland has become a major Conduit of US technological innovation into Europe, especially in the 1990s. As can be seen in Figure 2.7, the level of US FDI flows into Ireland increased significantly in the 1990s and there has also been a marked increase in Ireland’s share of US
2
High-tech industries include chemicals and metals and engineering. In 1998 over 90 per cent of net output and over 65 per cent of employment in these sectors were in foreign-owned companies. Source: CSO Census of Industrial Production 1998.
3 See Honohan, P., B. Maitre and C. Conroy, 1998. "Invisible EntrepSt Activity in Irish Manufacturing", Irish Banking Review, Summer.
4
Foreign-owned companies in the UK have been found to have a substantial productivity lead over domestically-owned ones. See Oulton, N., 1998. "Labour Productivity and Foreign Ownership in the UK", National Institute of Economic and Social Research, Discussion Paper No. 143.
5
FDI within the EU in the 1990s. Fourth, the policy of concentration on a small group of sectors has meant that Ireland has now become a major location for specific industries. This has had spill-over effects into the domestic economy both in terms of received expertise and technological know-how and via direct linkages with the domestic economy and the local labour market. Figure 2.7: US Manufacturing FDI Flows to Ireland
2000
1500
E 1000
g
500
20
0 0
15
1983 1985 1987 1989 1991 1993 1994 1996 1998 1984 1986 1988 1990 1992 1994 1995 1997 1999 ~US FDlFIows USSm (LHS) ~Share of EU15 FIows(RHS)
Source:. US Survey of Current Business: various issues; discontinuity in data in 1994.
Alongside these changes in trade orientation and industrial structure, there has been a steady increase in average education levels in the population in these decades (Figure 2.8), where investment in human capital occurred rather later than in other Northern European countries.6 This has increased the productive potential of the workforce. Recent estimates suggest that improvements in labour quality, due to rising education levels, particularly in the 1980s and 1990s, accounted for almost 20 per cent of total growth in
7
output.
6
Free second level education was only introduced into Ireland in 1967. 7
12 MEDIUM-TERM REVIEW 2001-2007
Figure 2.8: Index of Human Capital 1966-20018
1.4
1.35
o, 1.3 ~T
~
1.25~ 1.2
E
~ 1.1s 1.1
1,05 i i i i i i i i i i i i i i i i i i i i i i i i i i i i J i i i i F 1966 1971 1976 1981 1986 1991 1996 2001
2.1.3 EMPLOYMENT
[image:26.587.174.476.59.370.2]The growth in employment in recent years has far exceeded any growth seen in the past four decades (see Figure 2.9). Many factors have contributed to the strong pick-up in the demand for labour in these years. As discussed above, strong growth in FDI and improvements in competitiveness boosted the performance of the industrial sector. Since 1990 total employment in the industrial sector has increased by almost 150,000. This strong performance has had spillover effects on domestic demand, leading to strong growth in market services sector output and employment. Employment in the market services sector increased by 250,000 since 1990.
Figure 2.9: Total Employment, 1970-2000
1600
1500
1400
1300 2
1200
1100
1000
1970 1973 t976 t979 1982 1985 1988 1991 1994 1997 2000
In the 1980s falling employment rates led to stagnation in output per head and a large increase in long-term unemployment. Since 1993 there has been a ten percentage point reduction in the overall unemployment rate (see Figure 2.10). The boom in the 1990s has since the middle of the decade made
8
This index is constructed using data on four education levels (Primary, Junior Certificate, Leaving Certificate and those educated beyond second level) from successive Censuses of
Population from 1966 to 1996. These data are then weighted based on estimates of the returns
to education for each level to construct an index of human capital. See Barrett, A., T. Callan, A. Doris, D. O’Neill, H. Russell, O. Sweetman, and J. McBride, 2000, How Unequal? Men and
Women in the Irish Labour Market, General Research Series No. 176, Dublin: Oaktree Press in
significant inroads in reducing the numbers in long-term unemployment and moved the Irish labour market from a position of labour surplus to labour
shortage.9
Figure 2.10: Unemployment 1970-2000 (ILO Basis)
20O
150
0
lOO
25O
50 - 3
0 -0
1970 1973 1976 1979 1982 1985 1988 1991 1994 1997 2000 Numbers Unemployed (ILO) "-=-- Unemployment Rate (ILO)
-18
-15
-12
-9
-6
2.1.4 LABOUR SUPPLY: MIGRATION, PARTICIPATION AND AGE DEPENDENCY10
The Irish population structure in the 1990s has been unusually favourable in increasing labour supply. The expansion in the labour force has been much greater than in the rest of the EU, reflecting different demographic circumstances; namely rising female participation rates, inflows of migration, a high natural increase in the labour force and a corresponding reduction in age dependency.
Figure 2.11: Net Immigration Rate
Net Immigration as % of Previous Year’s Labour Force
2
0
-1
-2
-3
"41971,, ,19,75, t ,1;79,,,,,,, ~,,, ,.,, ,1;95L , , , , , 1983 1987 1991 1999
The rapid rise in unemployment in the 1980s would have been much worse but for the large flows of outward migration equivalent to over 3 per
9
See O’Connell, P.J. 2000. ’q’he Dynamics of the Irish Labour Market in Comparative Perspective", in B. Nolan, P.J. O’Connell and C.T. Whelan, Bust to Boom? The Irish Experience of
Growth and Inequality, Dublin: IPA for a discussion. He argues that the dramatic reduction in
the rate of long-term unemployment must be interpreted with some caution since large-scale participation in labour market training and temporary employment schemes may confound measures of the balance between short-term and long-term unemployment.
10
14 MEDIUM:FERM REVIEW 2001-2007
2.2 Growth Transmission Mechanisms
cent of the labour force in 1989 (Figure 2.11). This high propensity to migrate among Irish workers has made the supply of labour relatively elastic, with the Irish labour market effectively functioning as a region within the UK. In-more recent years the strong increase in labour demand has led to a resumption of immigration averaging over 1 per cent of the labour force since 1997.
As we have seen, increases in immigration in the 1990s increased the supply of labour to meet the increase in labour demand. A second source of increase in labour supply came from increases in female labour force participation rates. In 1980 Ireland had one of the lowest participation rates for women in the paid labour force in Europe. However, a combination of cultural changes, rising education and increasing labour demand has led to sharp increases in female participation rates in the 1990s (see Figure 2.12). Figure 2.12: Labour Force Participation, 1971-2000
100
9O
8O
70
60
50
40
30 19711
I i i i i i i i t t t i i t i i i I I I I I I i I
1119J99 1975 1979 1983 1987 1991 1995
-’*-- Female Labour Force Participation Rate Male Labour Force Participation Rate
Finally the age structure of the Irish population differs from that of other EU countries. The baby boom of the 1960s and 1970s, together with a sharp fall in the birth rate since 1980, means that the age dependency of the population has fallen sharply. The natural increase in the population has contributed over one percentage point per annum to the growth in the labour force in the 1990s.
In this Section we expand the analysis in Section 2.1. We consider the contributions of various factors to the rapid convergence in Irish living standards to the EU average using a small structural model of the Irish labour market, separately identifying skilled and unskilled labour,it The use of a structural model of the economy provides greater insights into the transmission mechanisms than is possible with the simple accounting identity decomposing output per head used in Section 2.1.
The model we use is a small and highly stylised representation of some of the key relationships discussed in the previous section. It focuses on the transmission mechanisms through which the increase in FDI flows in the 1990s and the increase in human capital may have impacted on productivity and convergence. It also explores the economic factors which determine labour supply, and hence the productive capacity of the economy, through the migration decision and the labour force participation decision. The details of the model are set out in full in Appendix 2.1 to this chapter.
11
We used this model to separately examine the effects of FDI, human capital investment and labour supply on the Irish labour market and on productivity. The details of this analysis are contained in Appendix 2.2 to this chapter.
"FDI Effect"
A very important factor in explaining the rapid convergence in living standards in the 1990s to the EU average has been the strength of foreign direct investment flows to Ireland. The success of the strategy of attracting foreign investment is illustrated in Figure 2.7 above. In particular in the 1990s, Ireland’s share of all US foreign direct investment into the EU averaged well over 5 per cent, with even higher levels achieved in the most recent years. With the increasing concentration of these firms in high-technology sectors, this new investment has significantly tightened the market for skilled labour.
In the model we attribute the acceleration in the demand for Irish output in the 1990s to this surge in FDI flows - termed the "FDI effect". The model results indicate that this "FDI effect" resulted in higher productivity growth together with increased employment. This improvement in employment opportunities in turn attracted immigration into Ireland of skilled labour from abroad.
Rising demand for skilled labour has occurred throughout the 12
industrialised economies over the 1980s and the 1990s, with the increase in demand in Ireland accentuated by the impact of foreign direct investment on the economy. This move away from unskilled labour led to a big increase in unemployment in Ireland in the 1980s, since unskilled labour is less likely to migrate to find employment. The boom in the 1990s was primarily driven by skilled employment sectors (high-technology industries), but the transmission mechanism suggested by the model results suggest that it also had significant indirect effects on the demand for unskilled labour, thereby making significant inroads in reducing unemployment.
Human Capital
A second important factor in understanding the acceleration in growth in the 1990s is the effect of human investment. In the model we examine the effect of the growth in average education levels since 1980 on the labour market. The model results indicate that this growth increased both output and employment and reduced unemployment. Furthermore, the increase in the supply of skilled labour due to rising human capital prevented a substantial rise in the skilled wage rate with a consequent deterioration in competitiveness and widening wage dispersion.
To understand this contribution to growth from investment in human capital~ account must be taken of the rise in demand for skilled labour world-wide. Ireland has gained its share of this demand partly through the entry of new foreign firms investing in the country as outlined above. Without this increase in the demand for skilled labour, the big increase in the supply of skilled labour would have resulted in a large fall in the skilled wage rate with deleterious effects on living standards. In other words the increase in the supply of skilled labour occurred at a time when demand was rising thus preventing large positive or negative swings in the skilled wage rate. What this means is that the interaction of FDI has been significantly enhanced by the simultaneous impact of increased investment in human capital.
12
Nickell, S. and B. Bell, 1995, "The Collapse in Demand for the Unskilled and Unemployment Across the OECD", Oxford Review of Economic Policy, Vol. 11, No 1, pp. 40-62.
13
16 MEDIUM-TEPaM REVIEW 2001-2007
Labour Supply
The third key factor in driving the growth in the 1990s was the rapid expansion of the labour force. The total labour force increased by 413,000 between 1990 and 2000 - an increase of almost one-third. In the first half of the decade labour supply increased by 1.8 per cent per annum, this rate almost doubled to 3.4 per cent in the period 1995-2000. This high growth of labour supply in the 1990s was facilitated through rapid growth in the population of working age, together with rising female participation rates and high immigration flows in the latter half of the decade.
Table 2.1: Factors Affecting Labour Supply Growth
1990-95 1995-00
Annual Average Increase %
Natural Increase 1.4 1.2
Female Labour Force Participation 0.6 1.1
Male Labour Force Participation -0.6 0.0
Education 0.4 0.4
Migration 0.0 0.8
Table 2.1 breaks down labour supply growth into the contributions due to the natural increase, changes in participation, education attainment and migration. The natural increase in the population of working age added 1.4 per cent per annum to the growth in labour supply in the period 1990-1995, slowing to 1.2 per cent in the second half of the decade. Increases in female labour force participation offset the decline in male participation in the first half of the 1990s, while the acceleration in female participation rates added 1.1 per cent per annum to the growth in labour supply in the latter part of the decade - roughly equivalent to the contribution from the natural increase. The table separates out the growth in labour supply due to increasing levels
of educational attainment. The increase is entirely attributable to rising education levels among women - female participation rates are higher among those with higher education levels so rising education levels also increase labour supply. Finally immigration in the latter half of the decade have added on average 0.8 per cent to labour supply growth.
In the model the effect of the natural increase, immigration and increases in female labour force participation in the 1990s was to significantly increase the supply of skilled labour. With education levels among the population rising, inflows into the population of working age have higher education levels than the average, while immigration flows and increases in female labour force participation are also concentrated among skilled workers. This served to reduce the pressure on skilled wage rates precisely when the demand for skilled labour was increasing. The model results indicate that increases in the skilled labour supply all served to accommodate the boom in the demand for Irish output and labour in the 1990s. Without this increase in the labour force, skilled wages would have risen and the competitiveness of the economy would have been adversely affected.
The general expansion in production in the 1990s also increased the demand for unskilled labour, which by the mid-1990s finally made inroads in reducing unemployment among the unskilled. These model results offer an interesting contrast with the findings of Borjas, Freeman and Katz, 1997,14 for the United States. Their research indicated that immigration of unskilled labour has adversely affected the position of unskilled inhabitants. The results of the model for Ireland suggest that the immigration of skilled labour improved the position of unskilled labour in Ireland.
2.3 Conclusions
Summary of Model Results
The acceleration in the demand for Irish output in the 1990s, due to the increase in FDI in high-tech sectors, increased productivity and the average growth rate. This also increased the demand for skilled labour. In the absence of a substantial increase in skilled labour supply this would have led to a widening wage dispersion between skilled and unskilled labour within the economy. The benefits of the increase in human capital investment was to increase the supply of skilled labour precisely when the demand for skilled labour was rising thereby maintaining the competitiveness of the economy.
Furthermore the general increase in labour supply in the 1990s, through rising female participation rates, a high natural increase in the working age population and immigration also reduced pressure on the skilled wage rate and served to maintain the competitiveness of the economy. While the increase in labour supply did not affect the rate of productivity growth it increased the capacity of the economy to grow.
The rapid growth in output and income per head in the 1990s is a result of the interaction and mutual dependence of several favourable underlying factors. In this chapter we focused oia exploring the key medium-term supply side factors driving productivity and labour supply growth. Using a simple decomposition of GDP per capita, we examined the contributions of the growth in productivity, human capital, employment, female labour force participation and the natural increase in the labour force. These are only determinants of the growth potential of the economy and without the supporting stable macroeconomic environment - including inter alia, healthy fiscal balances, low interest and inflation rates, a strong competitive position internationally and a favourable external environment - this growth potential would not have been realised. Furthermore, the rapid growth has in recent years led to severe and worsening congestion problems, particularly in relation to public infrastructure and most notably in the housing market. These issues are discussed in Chapter 6 of this Review.
18 MrDIt/bI-’I’ERM REVIEW 2001-2007
APPENDIX 2.1:
EQUATIONS
THE MODEL
The model includes five key behavioural relations; output determination; labour supply; migration; labour demand and the wage/unemployment equilibrium. The equation specifications and variable definitions are listed at the end of this Appendix.
Output determination: This is based on a small open economy model where multinational enterprises select a location for production on the basis of world demand and Ireland’s relative cost competitiveness.15 To estimate the effect of the recent acceleration in FDI flows in the 1990s we include an additional term in US GDP from 1990 onwards; this increases the elasticity of Irish output with respect to foreign output from 1990 onwards. Effectively this causes the demand curve for Irish output to shift outwards in the 1990s. This latter is a relatively crude proxy for the "FDI effect" discussed in Section 2.1.
Labour supply: The Irish labour market is modelled differently depending on the educational qualifications of workers. Those with high levels of education are typically more mobile and will emigrate (immigrate) in periods of low (high) labour demand, so that participation rates and unemployment rates among these workers are relatively stable. Those with lower levels of education have more volatile participation rates, so that in periods of low labour demand they either withdraw from the workforce or are unemployed. Because of these important distinctions, we model the participation decision for high-skilled and low-skilled workers separately. High-skilled is defined as workers who have completed second-level education to at least Leaving Certificate level. Estimates of the elasticity of the labour supply decision with respect to the wage are taken from Doris (2001)16 based on detailed microsimulation analysis of the participation decision (see Box 4.2 in Chapter 4).
Migration is modelled as a function of the expected real after tax earnings in Ireland relative to the UK. While in the 1960s and 1970s most emigrants were unskilled, since 1980 most migration both into and out of the country has been skilled.17 As a result, all migration is assumed to be high-skilled, and it is through this mechanism that the high-skilled labour market is cleared.
The demand for labour is modelled as a function of output, the real consumption wage and a time trend based on the assumption that all firms are profit-maximisers. To explore the effect of changing educational attainment on the demand for labour a second equation estimates substitution between high-skilled and low-skilled employment within the total labour bundle.
15
See Bradley, J. and J. Fitz Gerald, 1988. Industrial Output and Factor Input Determination in an Econometric Model of a Small Open Economy", European Economic Review, Vol. 3, pp.
1227-1241 for details. 16
Doris, A., 2001, Quarterly Economic Commentary Special Article (forthcoming). 17
20 MEDIUM-TERM REVIEW 2001-2007
1. Output Determination: this equation determines GDP
log )+ logl 1
log(GDP), =c3, +c32 ~.WGER *eGER , C33 ~.WeK *eeK ,+C34 log( GDPes:~ ) , + C3s log( GDPusA ) , * D90 +c36 log( GDP) ,_,
2. Labour Force Participation: these equations determine WH, NL, POPH, POPL
CI 1
,
Pc),
= c21 + 0.42 log + c23UR,_3 + c24Tt t \ C .’It
where
POPn,t = POPn,t_1 + APOPn,t + 0.75Mt
POPI.,t = POPL,,_I + lM°OP1.,t
3. Migration: this equation determines M
(W*(1--R/.c GTYP)I/IWvx/t/\
Mt = e6~ + c63 * .. -I- c64Mt_1 + c65D1990
4. Labour Demand: these equations determines LNA, LNAu and LNAL
(b--~), = % + c42 lo
+ %I’,
k C Jr
=CWn’LNAn) log(Wn / +c53Tt
S.
~ ~ " t =c51 ’{-c52 ~ WL )t
LNA = LNAu + LNAL
where
YWNA = Wu * LNAn + WL * LNAL
5. Labour Market Equilibrium: these equations determine We, W, Na log(5), = c7, + c72UR_UK, +c73 log(UB1 +c74 log(GDP] + CTs log(We)r,
t"c k ec )t k. L ), Pc
-W = -WnLNAn + -WL "LNAL LNA
Nn = fl Ln
Given LA as exogenous the following identities close the model:
Ln = LNAn + LAH, Lr. = LNAL + LAL, L = LH + LL, N = NH + NL,
U = N - L, UR=--U. 100, URn =-NI~ - LH * 1 O0
D_90 e_GER e_UK GDP GDP USA LNA L M N
P_C POP RGTYP RGTYP_UK T
UB UR UR_UK W
W_GER W UK YWNA
_H L
Dummy variable: =0 before 1990, =1 1990 onwards IR£/DM exchange rate
IR£/Sterling exchange rate GDP in constant prices US GDP in constant prices Non-agricultural employment Total employment
Net immigration Labour Force
Personal Consumption Deflator Population
Income Tax Wedge UK Income Tax Wedge Time Trend
Unemployment benefit payments for adult with 3 dependants Unemployment Rate
UK Unemployment Rate
Non-agricultural average annual earnings Manufacturing wage rate in Germany UK wage rate
Non-agricultural wage bill