National Skills Bulletin 2009
A Study by the Skills and Labour Market Research Unit (SLMRU)
in FÁS for the Expert Group on Future Skills Needs
June 2009
Authors:
Jasmina Behan
Nora Condon
Anne Marie Hogan
John McGrath
Joan McNaboe
Ivica Mili´cevi´c
Caroline Shally
Available from:
Skills and Labour Market Research Unit (SLMRU)
Planning & Research Department, FÁS
25 Clyde Road, Dublin 4
Tel: 01 6077436 Fax: 01 6077401
Web: www.fas.ie
Executive Summary 5
Introduction 10
Section 1 General Labour Market Trends 12
Section 2 Sectoral Employment Trends 17
Section 3 Employment by Broad Occupation 23
Section 4 Regional Skill Profiles 29
Section 5 Education and Training 39
Section 6 Employment Permits 44
Section 7 Vacancies 47
Section 8 Occupational Employment Profiles 50
8.1 Science Occupations 61
8.2 Engineering Occupations 63
8.3 IT Professional Occupations 65
8.4 Business and Financial Occupations 67
8.5 Healthcare Occupations 69
8.6 Education Occupations 71
8.7 Social and Care Occupations 73
8.8 Legal and Security Occupations 75
8.9 Construction Professional and Associate Professional Occupations 77
8.10 Construction Craft Occupations 79
8.11 Other Craft Occupations 81
8.12 Arts, Sports and Tourism Occupations 83
8.13 Transport and Logistics Occupations 85
8.14 Clerical Occupations 87
8.15 Sales Occupations 89
8.16 Operatives 91
8.17 Labourers and occupations not elsewhere classified (n.e.c.) 93
Section 9 In Focus: Unemployment 95
The National Skills Bulletin 2009 is the fifth annual report by the Expert Group on Future Skills Needs (EGFSN) on skills and occupational trends in Ireland. The Bulletin presents key labour market trends with the aim of assisting policy formulation in the areas of employment, education and training, and immigration. It also aims to provide information relating to developments in the Irish labour market for students, career guidance advisors, and other interested parties.
The Bulletin has two main purposes: to provide a statistical record of the employment data for all the main occupations in the economy and to draw on this data, and other qualitative information, to identify any shortages. While our aim is to identify occupations where shortages exist, further research is necessary to identify the cause of these shortages and the appropriate (if any) policy response. Occupations for which shortages are identified are highlighted and comments made regarding the nature of the shortage (skill shortage or labour shortage), expected duration and significance. The report highlights recent and current shortages and does not provide forecasts of skill shortages, unless it is implicit from the existing data.
The term ‘shortage’ in this report refers only to the situation where the supply of skills or labour from within the Irish workforce is insufficient to meet demand. It is possible that a sufficient supply of skills or labour for the occupation in question may be found within the European Union (EU) or the European Economic Area (EEA). Consequently there may not be a shortage from a European perspective.
This year’s bulletin is based on the quarter 4 2008 (Sept-Nov) Central Statistics Office (CSO) Quarterly National Household (QNHS) data. It differs from all previous issues in which the data was from quarter 2 each year. Traditionally, the SLMRU received micro data only for quarter 2. To facilitate a timely analysis of the labour market at occupational level, the CSO provided the latest available micro data, which at the time of writing was quarter 4 2008. Due to the speed at which the economic activity has been declining, the use of the quarter 2 2008 would have rendered the 2009 bulletin out of date before it was even published and therefore quarter 4 was used.
A significant share of the analysis focuses on the period quarter 2 2007 to quarter 4 2008. This period is used in order to examine the effect of the downturn to date. An alternative would have been to focus on quarter 2 2008 to quarter 4 2008; however, this was considered too short a period given that employment peaked in quarter 3 2007 and has, in the main, been declining since. There are the following caveats with using this time period for comparisons:
1. Comparing quarter 2 with quarter 4 raises issues about seasonality in the data; this however, should not considerably distort the results as, historically, the largest seasonality effect is observed in quarter 3 of each year
2. Employment peaked in quarter 3 2007, which means that using quarter 2 2007 as a starting point of the downturn masks the true extent of the fall in employment (or rise in unemployment) when compared to the height of the boom.
Nonetheless, the analysis gives useful insights into trends in the labour market, including compositional shifts in employment and unemployment (e.g. in terms of age, nationality, education, etc.), which have emerged since the beginning of the
downturn.
Key findings
Labour market indicators
Following more than a decade of strong employment growth and low unemployment rates, the Irish labour market has taken a sharp negative turn in 2008. Compared to 2007, all labour market indicators disimproved in 2008:
n annualised data shows that the labour force growth slowed to 1%
n annualised data shows that the participation rate decreased by 0.3 percentage points to 63.6%
n annualised data shows that net migration halved, with outward migration increasing and inward migration decreasing
n total national employment declined by almost 87,000 in the 12 months to quarter 4 2008
n unemployment increased by 70,000 in the 12 months to quarter 4 2008
n annualised data shows that the employment rate decreased by 1.5 percentage points to 67.7%
n between quarter 2 2007 and quarter 4 2008, the share of part-time workers reporting under-employment more than doubled to 3.7%
n in terms of annual averages, the unemployment rate increased by 1.8 percentage points to 6.4%; however, the unemployment rate increased to 7.7% by the fourth quarter of 2008 and further to 11.4% by April 2009.
Sectoral employment
In 2008, job losses were concentrated in four sectors – construction, manufacturing, hospitality and transport – amounting to a decline in employment of 41,000. While employment increased in other sectors, the net result for the economy was 13,000 fewer jobs in 2008 in relation to 2007.1
Construction suffered the largest decline in the downturn, with employment shrinking by 10% between 2007 and 2008 (almost 30,000 fewer employed on average annually). However, between quarter 4 2007 and quarter 4 2008, total job losses in this sector amounted to 46,000.
Regional employment
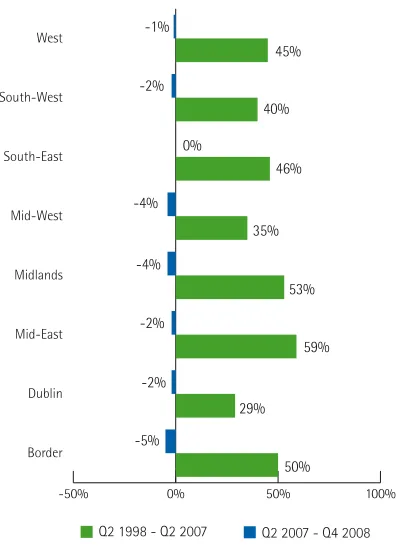
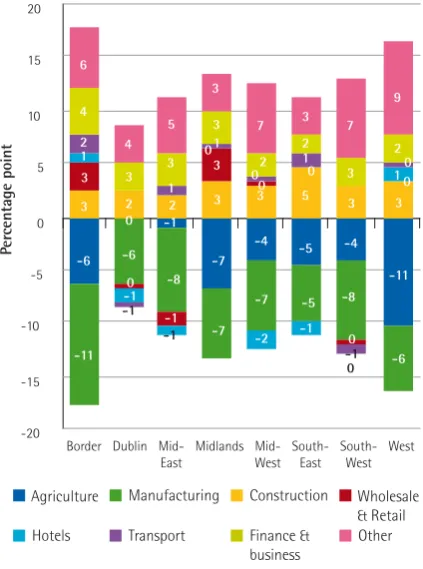
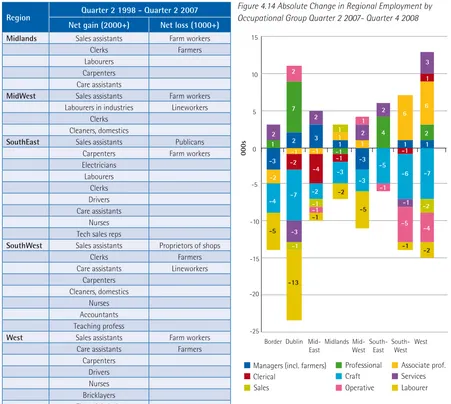
The occupational distribution of net job creation during the boom years (1998-2007) differed across regions: higher skilled (managerial, professional and associate professional) jobs accounted for a relatively greater share of job creation in the Dublin region; construction related jobs (craft and labouring) in other regions.
Between quarter 2 2007 and quarter 4 2008, employment declined in all regions except the South East. In absolute terms, the greatest net job losses were recorded in the Dublin (15,000) and Border regions (11,000). However, at greatest risk of unemployment were those living in the Midlands and West regions: the unemployment rates increased from 4.4% and 4.6% in quarter 2 2007 to 10% and 8.9% in quarter 4 2008 respectively.
Education and training
2The supply of skills emerging from the further and higher education and training system in 2008, expressed as the number of awards issued by field and NFQ level, is presented in Table 1.
The education profile of the workforce continued to improve: in quarter 4 2008, 38% of the employed held third level
qualifications, an increase on the 35% recorded for quarter 2 2007.
2 Awards data for universities and Institutes of Technology is based on 2007 data as this is the latest available.
National Skills Strategy: Progress to Date
Changes in the educational profile of the labour force have been in the direction of the target set in the National Skills Strategy:3 the share of the labour force with lower than secondary education attainment has been shrinking (from 29% in 2005 to 24% in 2008); the share with honours degree or above, increasing (from 20% in 2005 to 25% in 2008).
Immigration from non-EEA
In 2008, 8,487 new employment permits were issued to non-EEA nationals. This is a reduction of 7% since 2007. Occupations most frequently sourced through the employment permit scheme included chefs, medical practitioners, food processors (butchers/ meat cutters), care assistants and labourers in farming (primarily work riders for the equestrian sector). Most green cards were issued to nurses, software engineers, computer programmers/ analysts, accountants (qualified accountants and accounting technicians) and marketing managers. Intra-company transfer permits were most frequently issued for managers, particularly in the area of finance, marketing and production.
Vacancies
The number of vacancies advertised through the Irish Times, IrishJobs.ie and FÁS in 2008 each declined compared to 2007. The loosening of the labour market was confirmed in the results of the recruitment agency survey: many recruiters reported an absence of any difficulies to fill vacancies. Nonetheless, high level skill shortages were reported by some recruiters in the areas of IT, science, sales/marketing, health, accountancy, engineering and management.
3 EGFSN (2006) Tomorrow’s Skills: Towards a National Skills Strategy.
Table 1. Summary of Further and Higher Education and Training Awards by Field of Education, 20082
NFQ Level
1-4 5 6 7 8 9/10 Total
General Programmes 1220 140 110 80 0 30 1,580
Education 0 10 70 90 1,810 2,410 4,390
Arts & Humanities 0 1,660 380 1,240 5,400 2,000 10,680
Social Science, Business & Law 700 3,580 2,520 2,850 7,740 4,830 22,220
Science 0 60 210 410 2,280 890 3,850
Computing 0 310 320 410 980 840 2,860
Engineering & Construction 70 470 6,500 1,930 2,580 830 12,380
Agriculture & Veterinary 60 640 560 300 300 50 1,910
Healthcare 10 6,210 670 940 4,390 2,400 14,620
Services 1,200 1,130 1,900 1,080 600 380 6,290
TOTAL 3,260 14,210 13,240 9,330 26,080 14,650 80,770
Shortages
A skill shortage refers to a situation where there is an insufficient number of trained/qualified individuals in the domestic market to meet the demand for an occupation. This is different from a labour shortage which refers to a situation where there is an insufficient number of individuals willing to take up employment opportunities in a particular occupation.
Given the sharp rise in unemployment, there are no labour shortages in Ireland at present. The incidence of skill shortages is significantly lower than in previous bulletins. Nonetheless, some skill shortages persist for a number of positions requiring specialist knowledge, skills or experience and these are discussed in detail below.
Information Technology
While there has been a decline in the manufacturing side of the IT sector in Ireland recently, skills shortages persist in areas related to other aspects of the IT industry. The demand is still strong for individuals who not only have the advanced IT skills to install systems, but who can also customise and adapt those systems to a business’s individual needs. In particular, there is a shortage of:
n experienced computer systems managers
n IT professionals with business knowledge and managerial skills
n programmers in specific software applications with substantial experience (e.g. Oracle, Java, web animation)
n experienced professionals with advanced software architecture skills
n networking experts (SharePoint, VMware, etc.)
n telecommunications experts (e.g. mobile phones technology)
n IT security experts
n research and design professionals, especially in electronics/ ICT design and electronics hardware and semiconductor research.
Online sales, marketing, entertainment and social networking are also expected to continue to grow strongly in the coming years and drive the demand for creative and highly skilled web developers.
An increase in the demand for hybrid technologists is likely in the future as interdisciplinary activities expand in importance; ICT skills feature in most interdisciplinary convergence processes (e.g. business and IT; finance and IT; biotechnology, nanotechnology and IT).
Scientists
Despite the overall decline in employment, some science-related areas (e.g. pharmaceuticals, medical devices and diagnostics, and biotechnology) have been performing comparatively well and shortages still exist for highly qualified and experienced individuals with specific skills, both at professional level (fourth level research and development scientists, clinical trials managers, regulation compliance staff) and technician level (e.g. lab technicians, junior chemists, development/prototyping technicians).
A strategy launched by Science Foundation Ireland in March 2009, entitled ‘Powering the Smart Economy’, highlights the Government’s commitment to the establishment of a critical mass of internationally competitive research teams in science and engineering. Such investment, aimed at advancing enterprise in biotechnology, ICT and energy, is expected to build on Ireland’s reputation as a location of excellent research, thereby further expanding demand for people with advanced skills in these areas.
Energy, particularly renewable energy, is set to become one of the key growth sectors of the economy, and the demand for skills, at both technician and professional level, combining new technologies, interdisciplinary backgrounds (e.g. engineering/ science/business) and innovation, is likely to expand in the future.
As the importance of ecology and environmental protection increases, along with EU regulation for this sector, new career opportunities will emerge for those with expertise in the natural sciences (e.g. impact assessment on flora and fauna in the context of major infrastructural projects).
The field of bio-convergence is growing, which is likely to result in a demand for hybrid technologists with backgrounds in science, IT and nanotechnology.
Engineering
Despite the current economic pressures, design engineers, particularly in research and development in the medical devices sector, are in short supply; the demand pertains to individuals with experience and/or industry specific knowledge (e.g. process automation design).
As is the case for science graduates, engineers, especially electronic, electrical, quality control, and design and
development, will be in demand in the renewable energy sector (e.g. wind, wave and tidal), which is expected to be one of the drivers of future growth.
Ecology and environmental protection are becoming increasingly important, creating new career opportunities for environmental engineers with expertise in the management of eco-systems.
Marketing/Sales
Experienced marketing managers with product and market expertise and/or foreign language proficiency are difficult to source. Demand is likely to remain strong in the future as marketing experts are expected to be important to increasing Ireland’s market share of the global demand for products and services.
Despite a decline in employment for sales representatives overall, recruiters are continuing to report difficulties in sourcing experienced sales representatives with specific product or technical knowledge (e.g. medical sales, technical sales) and/or languages (e.g. telesales).
Online sales, marketing and advertising are expected to be strong growth areas in the coming years creating opportunities for individuals who can combine sales skills with competencies in other areas (e.g. foreign languages, online media, global markets and international business).
Healthcare
A wide range of policy initiatives have been adopted with the aim of re-shaping the healthcare sector with concomitant implications for service delivery and skill needs.4 However, in the short to medium term, employment opportunities (even those that arise from replacement demand) in the public healthcare sector, as well as the publicly co-funded non-public sector, are severely curtailed due to the public funding crisis. Nonetheless, in some areas of healthcare, skills shortages still exist.
4 These initiatives, inter alia, include the implementation of the Primary Care
Strategy, the National Cancer Control Programme, and more generally, moves towards a patient centred model, community vs. hospital based healthcare and consultant-provided vs. consultant-led services.
There is a shortage of medical practitioners:
n the current shortage of general practitioners (GPs) is likely to persist in the future, especially if the trend towards an increased share of female and part-time GPs continues
n there is a shortage of other specialist doctors required to meet the targets set out in the Report of the National Task Force on Medical Staffing.
There is a shortage of registered general nurses, as well as nurses in some specialised areas (theatre, intensive care, cardiac, neonatal/paediatric critical care, and oncology/cancer care). The shortage of general nurses is partly due to the fact that this segment of nursing is the main supply pool for most advanced nursing practitioners, as well as for most postgraduate courses (e.g. public health, children’s nursing, etc.).
The education and training output from dentistry has not kept pace with the growing demand for dental/orthodontic services, resulting in a shortage in this area. The shortage is likely to continue given that almost one in three dentists is older than 55, which is likely to create a higher than average replacement demand over the medium term.
Although the number of vets in Ireland has been supplemented by a recent inflow of foreign-trained vets, there continues to be a shortage. The expansion demand arising from increasing food safety and traceability standards and the replacement demand arising from expected retirements (one in four vets is over 55) are likely to exceed existing graduate output in the short to medium term.
Financial
Despite the global and domestic financial crisis and the associated decline in employment, the demand for highly skilled financial professionals persists (e.g. chartered and certified accountants with expertise in project and system accounting, compliance experts, risk experts).
Construction
Given the contraction in all segments of the construction industry in the short-term, shortages are not anticipated for any of the construction professional or craft occupations. In the medium term, job opportunities are most likely to arise, albeit not enough to absorb all of the excess supply, for those who have expertise in the following areas:
n residential repair and maintenance
n energy efficiency (e.g. retro-fitting, reduction of carbon dioxide emissions, renewable energy technologies)
n renewable energy infrastructure
n management of construction and demolition waste
n site assessment and water treatment
n supply chain management in off-site construction methods
n export of new building materials and processes.
In Focus: Unemployment
The In Focus section of this year’s Bulletin examines the
unemployed. The analysis, which focuses on the period quarter 2 2007 and quarter 4 2008, highlights the fact that while almost all labour market segments have been negatively affected by the downturn, they have not been affected to the same degree:
n males have been at greater risk of unemployment than females: the unemployment rate of males increased from 4.8% to 9.3%; of females from 4.3% to 5.5%
n younger persons (e.g. school leavers and new graduates and those ‘last in’) have been more adversely affected than older persons: the unemployment rate of 15-19 year olds increased from 14% to 22%; that of 20-24 year olds from 7% to 15%
n while third level graduates are not insulated from the downturn, persons with low levels of education remain at greater risk of unemployment: the unemployment rate of persons with less than secondary education increased from 7% to 12% over the period
n while both Irish and non-Irish nationals have been negatively affected by the downturn, the latter have been at greater risk of unemployment: the unemployment rate of Irish nationals increased from 4% to 7%; of non-Irish from 6% to 10%
n the downturn is disproportionately negatively affecting the BMW (Border, Midlands and Western) region: the unemployment rate increased from 4.8% to 9.1%
n those employed in the construction sector have been the most dramatically affected (the unemployment rate in this sector increased 5% to 17%); however, those employed in the personal etc. services sector continue to be at greatest risk of unemployment (up to 23% from 18%)
n craftspersons have been most dramatically affected (the unemployment rate increased from 5% to 14%), especially carpenters, bricklayers and plasterers; however, at greatest risk of unemployment continue to be labourers (the unemployment rate rose to 23% from 16%), especially labourers in construction.
Comparison with the National Skills
Bulletin 200
Almost all updated information on employment and other labour market indicators presented in the 2009 Bulletin show a break in the positive trends reported in previous bulletins. The key difference this year is that employment declined for most segments of the labour market and high unemployment emerged as an issue.
10
The National Skills Bulletin 2009 is the fifth annual report by the Expert Group on Future Skills Needs (EGFSN) on skills and occupational trends in Ireland. The Bulletin presents key labour market trends with the aim of assisting policy formulation in the areas of employment, education and training, and immigration. It also aims to provide information relating to developments in the Irish labour market for students, career guidance advisors, and other interested parties.
The main focus of the Bulletin is the analysis of employment at occupational level. Each occupation is examined in terms of its employment profile (based on the data from the Quarterly National Household Survey (QNHS) by the Central Statistics Office (CSO)), recent employment trends and other available indicators on the demand and supply of skills. Such indicators include:
n the number of employment permits issued to non-EEA nationals by the Department of Enterprise, Trade and Employment
n an extent of the difficulty in filling positions from the six-monthly survey of recruitment agencies (FÁS, Skills and Labour Market Research Unit (SLMRU))
n the number of vacancies advertised through FÁS, the Irish Times and IrishJobs.ie
n an estimate of the supply of skills emerging from the Irish education and training system derived from data supplied by the Higher Education Authority (HEA), Further Education and Training Awarding Council (FETAC), Higher Education and Training Awards Council (HETAC), Department of Education and Science, and the State Examinations Commission
n any other relevant findings from the EGFSN’s sectoral studies.
The Bulletin synthesizes all available data on the above indicators in order to assess and comment on the balance between the demand and supply for 130 occupations across the Irish workforce. It has two main purposes: to provide a statistical record of the employment data for all the main occupations in the economy and to draw on this data, and other qualitative information, to identify any shortages. While our aim is to identify occupations where shortages exist, further research is necessary to identify the cause of these shortages and the appropriate (if any) policy response.
Occupations for which shortages are identified are highlighted and comments made regarding the nature of the shortage (skill shortage or labour shortage), expected duration and significance. The report highlights recent and current shortages and does not provide forecasts of skill shortages, unless it is implicit from the existing data.
The term ‘shortage’ in this report refers only to the situation where the supply of skills or labour from within the Irish workforce is insufficient to meet demand. It is possible that a sufficient supply of skills or labour for the occupation in question may be found within the European Union (EU) or the European Economic Area (EEA). Consequently there may not be a shortage from a European perspective.
This year’s bulletin is based on the quarter 4 (Sept-Nov) 2008 Central Statistics Office (CSO) Quarterly National Household (QNHS) data. It differs from all previous issues in which the data was from quarter 2 each year. Traditionally, the SLMRU received micro data only for quarter 2. To facilitate a timely analysis of the labour market at occupational level, the CSO provided the latest available micro data, which at the time of writing was quarter 4 2008. Due to the speed at which the economic activity has been declining, the use of the quarter 2 2008 would have rendered the 2009 bulletin out of date before it was even published and therefore quarter 4 was used.
A significant share of the analysis focuses on the period quarter 2 2007 to quarter 4 2008. This period is used in order to examine the effect of the downturn to date. An alternative would have been to focus on quarter 2 2008 to quarter 4 2008; however, this was considered too short a period given that employment peaked in quarter 3 2007 and has, in the main, been declining since. There are the following caveats with using this time period for comparisons:
1. Comparing quarter 2 with quarter 4 raises issues about seasonality in the data; this however, should not considerably distort the results as, historically, the largest seasonality effect is observed in quarter 3 each year
2. Employment peaked in quarter 3 2007, which means that using quarter 2 2007 as a starting point of the downturn masks the true extent of the fall in employment (or rise in unemployment) when compared to the height of the boom.
Nonetheless, the analysis gives useful insights into trends in the labour market, including compositional shifts in employment and unemployment (e.g. in terms of age, nationality, education, etc.), which have emerged since the beginning of the
downturn.
National Skills Bulletin 2009 is set out as follows:
n Section 1 is an overview of general labour market trends; this includes economic and employment growth, participation rates, employment by age and education, and migration.
n Section 2 discusses sectoral employment trends, including recent and expected future employment trends. Given its importance to the economy overall, a more detailed examination of the manufacturing sector is provided.
n Section 3 examines employment by broad occupation.
n Section 4 presents an overview of the regional employment trends.
n Section 5 focuses on the supply of skills from education and training providers.
n Section 6 provides an overview of the inflow of labour from non-EEA countries through the employment permit schemes.
n Section 7 examines vacancies by broad occupational group from a number of sources.
n Section 8 provides an analysis of 130 occupations categorised into 17 occupational groups and highlights areas of shortage.
12
1.1 Population – Labour Status
There were about 4.5 million persons residing in the Republic of Ireland in the last quarter of 2008 (Figure 1.1). There were approximately 930,000 persons who were younger than 15, while those aged 65 and above amounted to just under half a million.
The working age population (15-64) was estimated at 3 million, two thirds of which were in employment. In addition, there were 45,000 older persons (aged 65+) in employment, bringing total national employment in quarter 4 2008 to 2.05 million. This is 50,000 fewer than in quarter 2 2007.
There were approximately 170,000 unemployed persons in quarter 4 2008, an increase of 70,000 when compared to quarter 2 2007.
Of the 870,000 economically inactive persons in quarter 4 2008, 40% were engaged in home duties, over a third were students, 7% were retired, with the remainder being inactive for other reasons. This distribution is in line with that of quarter 2 2007, although there were 44,000 additional persons in the economically inactive category overall in quarter 4 2008. The increase is partly due to the reduced employment opportunities and the fall in real wages which has discouraged some workers from participating in the labour market.
[image:12.595.87.542.333.703.2]Section 1
General Labour Market Trends
Figure 1.1 Population by Labour Status in Quarter 4, 2008
Source: FÁS (SLMRU) based on CSO data (QNHS, Quarter 4, September-October-November 2008)
Note: Any discrepancies in summations are due to the rounding of numbers
POPULATION 4,467,800
Children (<15) 928,600
Working age population (15-64)
3,050,400
65 and older 488,800
In employment Full Time (ILO)
1,633,800
In employment Part Time (ILO)
374,100
Not in employment (ILO) 926,500
In employment (ILO) 44,300
Not in employment (ILO) 426,900
Unemployed 170,500
In search of Full Time work
151,900
In search of Part Time work
18,600
Inactive 872,000
Student 305,100
Home duties 340,700
Other 167,200
1.2 Labour Force
Ireland’s labour force,5 comprising the employed and unemployed, grew strongly over the period 2002-2007, averaging 3.6% per annum.6 The natural increase, migration and increased participation all contributed to this growth. Immigration became particularly important in the latter part of the period, adding almost 100,000 to the labour force in 2006 and 2007 combined.
Figure 1.2 Labour force and employment (ILO) in 000s, annualised data for 2002-2008
1,500 1,700 1,900 2,100 2,300 2,500
2008 2007 2006 2005 2004 2003 2002
Total Labour Force Total in Employment
Year
Source: SLMRU (FÁS) analysis of CSO data
However, the growth in the labour force slowed to 1% in 2008 (Figure 1.2). The natural increase and immigration continued to contribute positively to labour force growth in 2008, although on a more moderate scale (adding just above 3,500 and 20,000 persons in 2008 respectively). In contrast, although the total number of those aged 15 and above in the population increased by almost 55,000 between 2007 and 2008, the size of the labour force expanded by just 24,000, on average, due to a decline in the participation rate (Table 1.1).
Between 2002 and 2007, the female participation rate increased more rapidly than that of males, albeit from a lower base. However, in the downturn, the female participation rate has been declining at a slower pace than that of males: down by half a percentage point compared to one percentage point for males between quarter 2 2007 and quarter 4 2008.
5 These figures are averaged over the four quarters of each year, while the data in Figure 1.1 refers to quarter 4 2008.
6 From 2006, the CSO has revised QNHS figures to take into account and reflect Census 2006 findings.
Table 1.1 Labour Force Participation Rates, 2002-2008
Year Total
2002 60
2003 60
2004 60.7
2005 62
2006 63
2007 63.9
2008 63.6
Source: SLMRU (FÁS) analysis of CSO data
With the economic downturn, net migration in 2008 declined for the first time since 2003. Due to an increase in outflow and a decrease in inflow, net migration was 40% lower in 2008 than it was in 2007 (Table 1.2).
Table 1.2 Migration Estimates (000s) 2003-2008
Year migrationOutward migrationInward Net migration
2002 25.6 66.9 41.3
2003 29.3 60 30.7
2004 26.5 58.5 32
2005 29.4 84.6 55.1
2006 36 107.8 71.8
2007 42.2 109.5 67.3
2008 45.3 83.8 38.5
Source: CSO 2008, Database Direct
Average annual employment decreased by approximately 13,000 in 2008, which was a decline of 0.6% in relation to 2007 (Figure 1.2). At the same time, unemployment increased by almost 37,000 or by 36%. Between 2002 and 2007, the employment rate had been increasing but a decline in 2008 brought it back to its 2005 level of 67.7% (Table 1.3).
1
Table 1.3 Employment and Unemployment Rates, 2002-2008
Year Employment rate (%)
Unemployment rate (%) (seasonally
adjusted)
Participation rate (%)
2002 65.1 4.4 60
2003 65.4 4.6 60
2004 66.2 4.4 60.7
2005 67.7 4.4 62
2006 68.7 4.4 63
2007 69.2 4.6 63.9
2008 67.7 6.4 63.6
Source: CSO; SLMRU (FÁS) analysis of CSO data
* relates to 15-64 age group (No. in employment as a share of 15-64)
The labour market situation continued to deteriorate rapidly during 2008 so that in the fourth quarter of 2008:
n the employment rate fell to 65.8%
n the unemployment rate reached 7.7%
n the participation rate declined to 62.8% .
1. Employment Composition
Figure 1.3 presents the gender distribution of employment. Males accounted for 56% of the Irish workforce in quarter 4 2008.
Figure 1.3 Employment by Gender, Quarter 4 2008
Female 44% Male 56%
Source: SLMRU (FÁS) analysis of CSO data
Figure 1.4 shows the distribution of overall employment by age group for quarter 4 2008. Two thirds of employment is younger than 45. However, the share of those under 25 has declined when compared to quarter 2 2007. While this is consistent with the higher participation rate in third level education, it is also
an indication of a decline in employment opportunities for new entrants. At the other end of the age spectrum, the relative size of more senior segments of the national workforce remained largely unchanged.
Figure 1.4 Employment by Age (%), Quarter 4 2008
0 5 10 15 20 25 30 35
65+ 60-64 55-59 45-54 35-44 25-34 20-24 15-19
Age
2.5 10.0
30.1 24.3
19.7
6.9 4.3
2.2
Source: SLMRU (FÁS) analysis of CSO data
Figure 1.5 shows the education profile of the national workforce. The education profile of the workforce continues to improve: in quarter 4 2008, 38% held third level qualifications, an increase on the 35% recorded for quarter 2 2007.
Figure 1.5 Employment by Education Level, Quarter 4 2008
Lower Secondary and Below 22.7% Upper Secondary/FET 39%
Third Level Certificate/Below Honours Degree 12.6% Third Level Honours Degree or Above 25.7%
Source: SLMRU (FÁS) based on analysis of CSO data
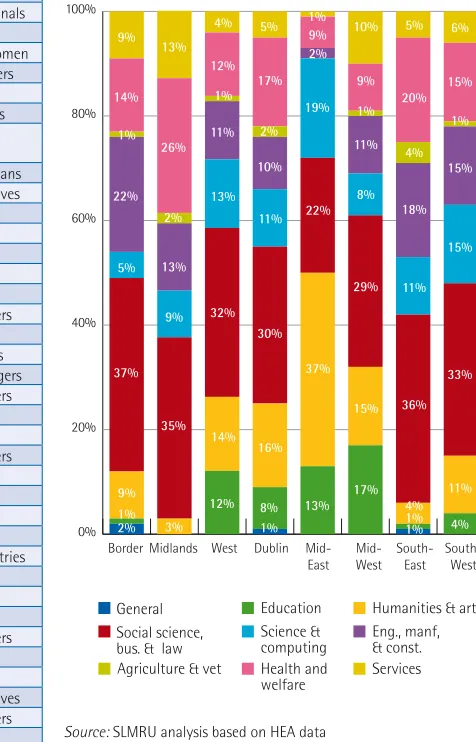
Figure 1.6 Employment by Education Field, Quarter 4 2008
General programmes 1% Education 7% Humanities/Arts 8% Social Sci/Bus/Law 32% Science/Math/ Computing 8% Eng/Man/Constr 21% Ag/Vet 4% Health/Welfare 12% Services 7%
Source: SLMRU (FÁS) based on analysis of CSO data
Note: only those with higher than Leaving Cert education attainment who stated an education field are included
Figure 1.7 shows the nationality profile of the workforce for quarter 4 2008. Non-Irish nationals accounted for 15.4% of national employment, almost half of whom originated from the 10 new member states which joined the EU in 2004.
Figure 1.7 Employment by Nationality, Quarter 4 2008
EU accession 6.9% Irish 84.6% Other 4.3% Rest of EU 1.6% UK 2.5%
Source: SLMRU (FÁS) based on analysis of CSO data
In quarter 4 2008, of those in employment, 1.66 million were in full-time employment. This was 63,000 fewer than in quarter 2 2007. In contrast, between quarter 2 2007 and quarter 4 2008, the number of part-time workers increased by approximately 13,000 (3.5%). Importantly, the share of part-timers stating a preference for longer working hours (i.e. who were underemployed) increased from 1.5% to 3.7%. This rise in involuntary part-time employment has affected both males and females.
Of the total employment in quarter 4 2008, 352,000 were self-employed, with employees accounting for the remainder. When compared to quarter 2 2007, there were an additional 13,000 self-employed persons. Interestingly, the share of self-employed with no paid employees increased, while the share of those with paid employees decreased.
1. Economic Outlook and
Implications for Employment
Ireland’s economic performance in 2008 was weak, with real GDP declining by 2.3% on an annual basis and employment falling almost in tandem (Figure 1.8). The data revealed a further deterioration towards the end of the year, with GDP at constant prices being 7.5% lower in quarter 4 2008 compared to quarter 4 2007.7 This negative trend continued into 2009, further depressing the national labour market.
The Department of Finance expects GDP to contract by 7.7% in 2009.8 The CBFSAI (Central Bank and Financial Services Authority of Ireland) also forecasts a decline in GDP – 7% for 2009 and a further 3% for 2010.9
This decline in economic output will result in a further decline in the demand for labour. The ESRI predicts that 187,000 jobs will be lost in 2009, translating into an average annual unemployment rate of 13.2%. A further 102,800 jobs are expected to be lost in 2010, pushing the average annual unemployment rate to 16.8%.10
Figure 1.8 Economic and Employment Growth, 2000-2010
-8 -6 -4 -2 0 2 4 6 8 10
2010 (f) 2009
(f) 2008 2007 2006 2005 2004 2003 2002 2001 2000
GDP
Year
GNP Employment
%
Source: CSO (2000-2008), Central Bank & Financial Services Authority
of Ireland (2009 and 2010 estimates)11
7 CSO (2009), Quarterly National Accounts, Table 1 Gross Domestic Product by Sector of Origin and Gross National Product at Constant Market Prices (Chain linked annually and referenced to year 2006):3.
8 Department of Finance, Monthly Economic Bulletin, June 2009. 9 Central Bank and Financial Services Authority of Ireland, Quarterly Bulletin
2, 2009; the forecasts did not anticipate the potential impact of the fiscal measures announced on 7 April, Emergency Budget). Forecasts made subsequently by the EU Commission were even more pessimistic for 2009. (EU Commission website, last accessed May 2009.
1
1. National Skills Strategy:
Progress to Date
Figure 1.9 shows the progress made in the improvement of the education attainment of the labour force against the target set in the National Skills Strategy for 2020.12 The shift in the education attainment is in the direction of the target: the share of labour force with the lowest education attainment is shrinking; the share with the highest level increasing.
Figure 1.9 Education Attainment of the Labour Force and the NSS Vision for 2020
Third level degree or above
0% 20% 40% 60% 80% 100%
2020 q4 2008
q2 2007 q2 2006 q2 2005
20.1%
Third level certificate/ less than honours degree
Upper secondary/FET Lower secondary or less
21.5% 23.0% 24.8% 32%
11.4% 11.5% 11.4% 12.3%
16% 39.8% 39.7% 39.4%
39.2%
45%
28.7% 27.3% 26.2% 23.7%
7%
Source: SLMRU (FÁS) based on analysis of CSO data
2.1 Employment
The wholesale and retail sector continued to be the largest in 2008, employing 306,000 persons. The financial and business services sector employed 293,000 in 2008 and became the second largest sector in the economy, overtaking the manufacturing sector (inclusive of other productive industries). Despite a marked decline, the construction sector remained the fourth largest, ahead of the health and social work sector.
Figure 2.1 Employment by Sector in 000s, 2008 (annual average)
0 50 100 150 200 250 300 350
Public administration and defence, social security Agriculture, forestry and fishing Transport and communications Other services Hotels and restaurants Education Health and social work Construction Manufacturing and other productive industries Financial and other business services Wholesale and retail trade
104.9 119.4 121.5 124.4 128.6 140.5
224.9 255.0
285.8 293.1 306.0
Source: Analysis by FÁS (SLMRU) based on CSO data
2.2 Employment Growth (200-200)
Over the last five years (2003-2008), employment grew by just above 3% per annum on average, and it is estimated that in 2008 there were approximately 300,000 more persons in employment than in 2003. However, this medium term pace of employment growth was not sustained in 2008, with total employment declining by 0.6%.
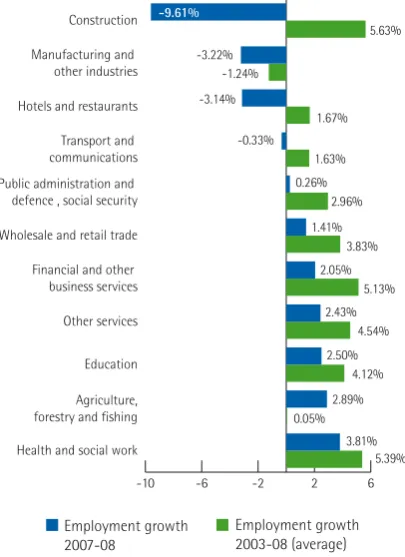
[image:17.595.294.497.177.456.2]Figure 2.2 depicts changes in average annual employment across all broad sectors, ordered by the magnitude of change observed in 2008. The total number of jobs lost across four sectors in 2008 – construction, manufacturing, hospitality and transport – amounted to 41,000. While jobs were created in other sectors, amounting to 28,000 in total, the net result for the economy was 13,000 fewer jobs in 2008 in relation to 2007.
Figure 2.2 Employment Change by Sector, 2007-2008 and Annual Average Growth 2003-2008 (%)
Employment growth 2007-08
Employment growth 2003-08 (average)
-10 -6 -2 2 6
Health and social work Agriculture, forestry and fishing Education Other services Financial and other business services Wholesale and retail trade Public administration and defence , social security Transport and communications Hotels and restaurants Manufacturing and other industries
Construction -9.61%
5.63% -3.22%
-1.24% -3.14%
1.67% -0.33%
1.63%
2.96% 0.26%
3.83% 1.41%
5.13% 2.05%
4.54% 2.43%
4.12% 2.50%
0.05% 2.89%
5.39% 3.81%
Source: Analysis by FÁS (SLMRU) based on CSO data
Construction:
While this sector recorded strong growth between 2003 and 2007, it contracted sharply in 2008. In fact, construction suffered the largest decline in the downturn, with employment shrinking by 10% between 2007 and 2008 (almost 30,000 fewer employed on average annually). The annual average figures, however, mask the true decline that occurred towards the end of 2008 (there were 46,000 fewer jobs than at the end of 2007).
The CSO estimated that in December 2008 employment in private construction firms employing five or more persons decreased by 22% compared with December 2007.13
Hotels and Restaurants:
The hospitality sector contracted in 2008 by just above 4,000 persons, or 3.1% in relation to 2007. While the sector still employed 10,000 more persons than in 2003, last year’s contraction brought the medium term growth rate down to 1.7 % per annum.
13 CSO, 2009. Index of Employment in Construction, February 2009. http://www. cso.ie
1
The sector has been particularly adversely affected by the current economic environment at home and overseas – the number of overseas visits to Ireland declined in 2008, which was a reversal of the trend observed during the 2002-2007 period.14
Transport and Communication:
The transport and communication sector declined marginally, by 0.3%; the total employment in 2008 stood at 122,000. Within the sector, consistent with the developments noted last year, the air and water transport segments both contracted, with a particularly sharp decline in the latter of these two. Land transport, the biggest sub- sector, with employment estimated at 54,000, expanded by 4.1%. Given that employment in the post and communications sub-sector has not changed, the expansion of land transport activities has maintained employment in the sector overall.
Public Administration and Defence:
The total employment in this sector was estimated at 105,000 in 2008. The sector remained static in 2008 – the growth rate of 0.3% was just a fraction of its medium term rate of 3% per annum recorded for the 2003-2008 period.
Wholesale and Retail Trade:
The wholesale and retail sector grew by 1.4 % last year, which was considerably below the rate observed for the 2003-2008 period, when the annual average growth rate for the sector was 3.8 %.
With regard to the three main components of the sector, the retail sub-sector, amounting to almost two thirds of the total employment, contracted marginally by 0.5%. The remaining two sectors, wholesale trade and the motor trade sub-sector, both expanded in 2008 - the former by 5.5% and the latter by 4.4%.
Financial and Other Business Services:
The total employment in this sector was 293,000. This was almost 6,000 or 2% more than in 2007. However, this amounted to a considerable slowdown in the pace of growth – the rate of increase during the 2003-2008 period averaged 5% per annum.
Within the sector, financial intermediation (banking) remained the largest segment employing 64,000, followed by IT related business services, estimated at 38,000. Both of these sub-sectors expanded in 2008, the latter notably so, by 10%.
14 CSO (2009) Tourism and Travel Quarter 4 2008.
Other Services:
There were 124,000 persons engaged in economic activities classified as other services in 2008. Recreational, cultural and sporting activities remained the largest segment of activity within this sector, expanding by 6%. Sanitation and refuse disposal activities, one of the sub-sectors characterised by strong growth of late, declined in 2008 when 8,000 people were engaged in these activities, compared to almost 10,000 in the previous year.
Education:
A total of 140,000 persons were employed in the education sector in 2008. The sector expanded by 2.5%, adding 3,500 more persons since 2007 and almost 26,000 cumulatively over the 2003-2008 period, when employment grew by 4.1% annually, on average.
While the pace of employment growth slowed in 2008, especially in relation to the medium term growth rate observed over the 2003-2008 period, this sector nevertheless accounted for one in eight of total job gains in the economy.
Agriculture, Forestry and Fishing:
In 2008, total employment in agriculture, forestry and fishing was 120,000. There were approximately 3,500 more persons engaged in this sector in relation to 2007. The agricultural sub-sector alone accounted for this expansion, since the other two sub-sectors declined marginally.
Health:
The health sector recorded the largest expansion in 2008 – it expanded by in excess of 8,000 persons. Nevertheless, the pace of expansion observed last year for the sector, at 3.8%, was below its medium term growth rate of 5.4%. Additional posts in the sector amounted to 30% of total job creation overall. This meant that more than one in ten workers are now engaged in health and social care related activities.
2.2.2 Manufacturing and Other Productive
Industries
This section examines the industrial sector, comprising manufacturing together with other productive industries, in more detail given its potential role in restoring Ireland’s capacity for export-led growth.
Employment
The sector can be disaggregated into eight sub-sectors, of which seven are manufacturing industries (Figure 2.3). In 2008, there were 261,000 persons engaged in manufacturing; 25,000 persons in the utilities & extraction sector.
The sub-sector producing office, electrical machinery and precision instruments (electronics, medical and optical) employed approximately 57,000. This segment of activity was the largest, followed by the food, beverage and tobacco sub-sector employing 52,000, and chemical and plastics sub-sub-sector where 52,000 were employed.
Manufacturing can be grouped into two segments: modern or ‘high-tech’ (comprising electronic and chemical and pharmaceutical industries) and traditional.15 There were 171,000 persons working in traditional manufacturing activities, and the remaining 90,000 were engaged in modern manufacturing. The modern segment is particularly relevant given its knowledge and skill intensity and relative contribution to exports and GDP.16
Figure 2.3 Industrial Employment (000s) by Sub-sectors, 2008
0 50 100 150 200 250 300
Electronics, medical & optical Food, beverage & tobacco Chemical; mineral, rubber & plastic Metal, machinery & equipment Wood & furniture, transport equipment, other (incl. recycling) Utilities and extraction Paper, Publishing & Printing Textile, leather & apparel Modern manufacturing Traditional manufacturing Total manufacturing (NACE 15-37) Total industrial employment in productive sector
31.4 25.0 18.9 8.8
90.2 170.7
40.9
260.8 285.8
52.3 51.5
57.1
Source: Analysis by FÁS (SLMRU) based on CSO data
15 This grouping is consistent with the CSO methodology as adopted in the Statistical Yearbook of Ireland 2007. Note that the reproduction of recorded media (NACE 223), which is a modern segment, is classified within traditional industry, under NACE 22 (paper, publishing and printing).
16 DETE & FORFAS. 2008. The Report of the High Level Group on Manufacturing.
Employment Changes in the Industrial Sector
Figure 2.4 shows the growth in employment in the different industrial sub-sectors for periods 2003-2008 and 2007-2008.
Over the period 2003-2008, the industrial sector contracted by 1.2% on average, annually. The decline accelerated between 2007 and 2008 (a 3.2% fall), with a net job loss of 9,500, accounting for almost a quarter of all job losses economy-wide for this period.
Within the industrial sector, manufacturing activities contracted over the period 2003-2008 (23,500 net jobs lost), while utilities and mining & extraction activities expanded (5,000 net jobs created). Importantly, almost half of these net job losses in manufacturing occurred in 2008.
The decline in manufacturing has been particularly pronounced in the traditional segment. It declined by 2.5% between 2003 and 2008 compared to 0.2% for the modern segment; it contracted by 5.1% between 2007 and 2008 compared to 2.1%, for the modern segment.
Figure 2.4 Annual Average Employment Growth in Industrial Sectors (%), 2007-2008 and 2003-2008
Employment change 2007-08
Employment change 2003-08 (per annum, average)
-10% -6% -2% 2% 6%
Traditional manufacturing Modern manufacturing Manufacturing (NACE 15-37) All industries -total productive sector Utilities and extraction Textile, leather & apparel Metal, machinery & equipment Electronics, medical & optical Food, beverage & tobacco Paper, Publishing & Printing Wood & furniture, transport equipment, other ( incl. recycling) Chemical; mineral, rubber & plastic
7.2%
0.6% -7.9%
-1.8% -7.9%
-3.4% -4.7% -4.9%
-3.3% -0.7% -1.6%
-0.7% -1.2%
-0.4%
-5.3%
4.8%
-3.2% -1.2% -4.1%
-1.7% -2.1%
-0.2% -5.1%
-2.5%
20
Chemicals, Plastics and Non-metallic Materials
Employment in this sector contracted sharply in 2008 (by 8%), reducing the medium term rate to -1.8% on average annually. Of the total net job loss in manufacturing in 2008, one quarter was in the manufacture of non-metallic mineral products.
Following several years of positive growth, the manufacture of chemicals and related products (including pharmaceuticals) also contracted in 2008, but at a slower rate of 3%. The manufacturing of rubber and plastic products sub-sector declined by 3.8% over the period 2003-2008, although this decline was halted in 2008 with employment remaining at the 2007 level of 7,500.
Other Manufacturing (Wood and Furniture,
Transport Equipment, Recycling)
This sector includes the manufacture of wood and furniture, transport equipment and other manufacturing not elsewhere classified (including recycling). While declining steadily over the period 2003-2008, it contracted sharply in 2008 – the speed of decline was more than twice that observed over the five year period.
Within the sector, activities related to the manufacturing of motor vehicles, trailers and semi-trailers (which is primarily the manufacture of parts and accessories for motor vehicles and engines) declined by 17% in 2008.
Paper, Print and Publishing
The paper, printing and publishing sector contracted by almost 5% on average annually over the period 2003-2008, with a net loss of 5,500 jobs. The rate of decline observed in 2008 was in line with the medium term rate.
Within the sector, the manufacture of pulp, paper and paper products has been declining more rapidly than the sector overall throughout the last five years.
Food, Drink and Tobacco
The food, drink and tobacco sector is the largest indigenous industry. Employment in this sector peaked in 2006 at 57,000. It began to contract in 2007 and continued to decline in 2008, shrinking by 3.3%. This translated into approximately 2,000 fewer persons engaged in this sector in 2008 when compared to 2007.
Office and Electrical Machinery and Precision
Instruments (electronic, medical & optical)
This sector includes the manufacturing of office machinery and computers, and medical, precision and optical instruments. Employment in the manufacture of office machinery and computers remained, on average, static over the last five years: the total number of persons engaged in 2008 was
approximately 17,000, which was almost identical to that recorded in 2003.
The manufacturing of medical, precision and optical instruments remained the largest within the sector, providing employment for almost 23,000 in 2008. This number was, however, 4.4 % lower in relation to 2007.
The manufacturing of radio, television and communication equipment was the only sub-sector that expanded in relation to 2007, with year-on-year growth rate of almost 7%. The result of this expansion was that the sub-sector employed an additional 1,000 persons in relation to the beginning of the five year period.
The manufacturing of electrical machinery declined by 15% per annum during the 2003-2008 period, and by 22% in 2008, the result being that the number in employment in 2008 was about one half of that observed in 2003.
Metals and Machinery
In 2008, the metals and machinery sector, widely referred to as the traditional engineering sector, provided employment for approximately 41,000 persons which was almost identical to the level observed a decade previously. Within the sector, the manufacturing of fabricated metal products remained the largest, accounting for more than 60% of sectoral employment in 2008.
Textiles and Clothing
The sector declined over the period 2003-2008 with a net job loss of almost 3,000, or 5.3% per annum. However, it remained relatively unchanged between 2007 and 2008.
Utilities, Extraction and Mining Activities
The utilities, extraction and mining sector continued to expand – the number in employment grew by 7.2% between 2007 and 2008, while the medium term growth rate averaged 4.8% over the period 2003-2008.
2. Expected Employment Trends
by Sector
In this section we outline employment expectations by sector, taking into consideration both current and expected trends. Last year’s Bulletin focused on the medium term outlook for each sector.17 However, given the speed at which economic activity has declined since 2007, this year’s edition also includes a short term perspective based on the policy context and the economic commentary current at the time of writing.
Global Context
The global outlook will impact on sectors where output (and therefore employment) is heavily dependent on foreign demand. Globally, a sharp deterioration in trade was already evident in the latter part of 2008. Growth in world trade slowed to 2% in 2008, down from 6% in 2007. There was a sharp decline in exports in most major world economies and trade prospects for 2009 remain heavily influenced by the financial crisis. It is expected that, due to the collapse in global demand and the ongoing adverse developments in the financial markets, world merchandise exports will decline by 9% in volume terms in 2009, while the contraction in developed countries is expected to be even more severe with a 10% decline anticipated.18
This global contraction in trade has already affected Ireland’s trade volumes. Total exports (goods and services) in 2008 fell, due mostly to a particularly poor performance in the fourth quarter of the year – merchandise exports registered an annual decline of 0.6% in volume terms (or 3.5% in value terms) while there was no growth in the volume of services exports in 2008 (a decline of 0.1% was recorded, while in value terms they grew by 2.9%).19
The most recent data available confirms that the Irish exports continued to decline, contracting by 9.6% in value terms in the first quarter of 2009 - merchandise exports declined by 3.4% and services exports by 18% in relation to the first quarter of 2008; it is expected that the decline will amount to 13% for the whole year, with services exports particularly affected, set to decline by 20% in relation to 2008.20
17 Based on ESRI Mid Term Review 2008 and FÁS/ESRI Occupational Employment Forecasts.
18 WTO Secretariat estimates; URL: http://www.wto.org, last accessed in April 2009. Production and trade may be measured in volume (‘real’) or value (‘nominal’) terms. Measures of volume production and trade flows are adjusted for price changes and do not take account of exchange rate changes. Value or nominal measures include actual changes as well as changes in underlying prices and exchange rates.
19 In quarter 4 2008, the volume of exports fell 5% year-on-year. This was mainly due to weak merchandise exports, which declined by 8.4% year-on-year, although services exports were maintained at the same level. Sources: CSO (External Trade publications), Central Bank and Financial Services Authority of Ireland, Quarterly Bulletin 2, April, 2009.
20 Irish Exporters Association 2009. First Quarter Review 2009. Total exports for
the first quarter of 2009 stood at €33.78 billion down from €37.38 billion in
the same period last year.
Construction
The construction industry has been contracting faster in the downturn and is expected to experience a slower recovery in the upturn than most other sectors. There were two main drivers of construction employment growth in the latter part of the boom:
n demand arising from the buoyancy in the global economy, export sector growth, demographic growth, growth in real incomes, etc. (cyclical factors)
n investment motivated by low interest rates, availability of credit and high capital gains in the housing market etc.
While it is expected that the former will be revived once the global recession is over, the latter is unlikely to be re-established as a driver of employment growth in the foreseeable future. In addition, the initial growth in demand is not expected to translate into the same rate of employment growth: at least part of the demand is expected to be met by the output overhang (unsold houses and commercial property units) 21 inherited from the boom.
As a result:
n while some job losses in construction are transitory, some are permanent
n the recovery in construction employment is likely to lag behind other sectors
n on recovery, construction employment is unlikely to reach its pre-boom levels (13% of national employment in 2007).
Within the construction sector, the residential sub-sector has been most affected by the downturn. In the medium term, the number of new houses built is expected to be only a fraction of the output of 88,000 houses recorded at the peak of activity in 2006. The commercial building sub-sector is also expected to contract significantly over the medium term. Although the productive and social infrastructure projects held last year, funding future capital expenditures under the NDP will be challenging given the pressure on public finances in the downturn.22 By contrast, residential repair and maintenance has been holding up and is expected to continue to provide some job opportunities. This is partly due to the initiatives for energy efficiency improvements (e.g. Greener Homes Scheme, The Home Energy Saving, Sustainable Energy Ireland).
21 Goodbody Stockbrokers estimate that at the beginning of 2009 there were 350,000 vacant housing units up from 266,000 recorded in the 2006 CSO Census.
22 Gross Voted Capital expenditure in 2009 has been reduced by €624
(or €576 million if additional allocations are factored in).
22
Agriculture
The prospect for the sector will depend largely on global future agricultural commodity markets, which, while exhibiting volatility at present, are likely to recover as global demand is set to outstrip global supply in the medium term and beyond. In the short term, while agriculture is not insulated from the recession, it benefits from EU transfers and subsidies: just over
€2 billion was paid to Irish farmers and companies operating
in the agri-sector in the twelve month period from October 2007 to October 2008.23 However, the sector offers limited employment prospects and will remain relatively small in terms of its share of total employment.
Healthcare
At present, there is a wide range of policy initiatives aimed at restructuring the healthcare system (e.g. a move towards a patient centred model; consultant-provided services; community-based services). These are likely to increase demand for some healthcare skills (and possibly reduce demand for others). However, severe budgetary constraints will negatively impact on employment opportunities in the healthcare sector and are likely to impede the realisation of these initiatives in the short to medium term.
Manufacturing and Other Industry
Although manufacturing employment has been declining for some time, the value of manufacturing output contracted for the first time in 2008 (by 1.5%) following several years of continuous growth. The traditional segment bore the brunt of the decline, contracting by 4.5% in volume terms, whereas the modern segment contracted only marginally, by 0.1%.24 The main challenge for the sector is the combination of falling domestic demand (from both consumers and businesses) and lower export orders. Given the export orientation of the sector, manufacturing is particularly exposed to the global downturn.
Employment prospects in the sector will ultimately depend on the speed and extent of the global economic recovery and improvements in the level of Ireland’s competitiveness. In the short term, in order to prevent further deterioration, the new Government Enterprise Stabilisation Fund aims at assisting indigenous, small-medium sized export-oriented enterprises that are experiencing difficulty as a result of the global downturn.25
23 Department of Agriculture, Fisheries and Food. URL:www.agriculture.gov.ie,
24 CSO, 2009. Industrial Production & Turnover: February 2009 (Provisional) and
January 2009 (Final)
25 Department of Finance, URL: http://www.budget.gov.ie
Distribution - Wholesale & Retail
The slowdown that had been predicted for this sector in the medium term arrived sooner than anticipated. The retail segment of the sector contracted sharply in the first quarter of 2009, reflecting a decline in real incomes and negative consumer sentiment.26
The employment prospects in the sector are dependent on domestic demand, which is set to remain subdued in the short to medium term mirroring the overall economic performance. Cross-border shopping is expected to further undermine job opportunities in the retail sector in the Republic.
Financial and Business Services
The financial sector is currently faced with two main challenges: exposure to the property market collapse and the global financial crisis. Although it is uncertain how the events will unfold, it is clear that this sector will undergo serious restructuring. This will include an increase in government involvement (e.g. nationalisation or recapitalisation of banks) and an introduction of new national and international regulatory frameworks, e.g. limiting over-reliance on wholesale funding by banks, increasing regulation of banks’ usage of special investment vehicles, etc.27 As a result, employment prospects depend on the recovery in the global financial markets and the effectiveness of domestic policy decisions.
Within the business services sub-sector, Computer Services have shown a degree of resilience to the current downturn with employment holding up throughout 2008, suggesting that the global demand for ICT services is relatively inelastic.
Hospitality sector
The decline in real incomes and rise in unemployment is reducing domestic demand in this sector. The global recession and adverse exchange rates are negatively affecting the number of tourists coming to Ireland. While this sector is highly exposed to the domestic and global recession, there is a potential for partially off-setting the impact on employment providing that a considerable number of Irish holidaymakers substitute holidays abroad with holidays at home.
26 CSO 2009, Retail Sales Index January 2009 (First Estimates), December 2008 (Final Figures).
.1 Employment
This section presents employment in 2008 by broad
occupational groups. The sharp contraction in the construction industry has resulted in a slight redistribution of employment across occupational groups: the share of craft workers and labourers (predominant in the ‘other’ occupational group) declined by two and one percentage points respectively compared to 2007, with concomitant increases in the employment shares for professional and service occupations. Professional and associate professional occupations continued to account for one fifth of total employment.
Figure 3.1 Employment by Broad Occupational Group (%), 2008
Farmers 4% Plant and machine operatives 8% Sales 9% Other 9%
Associate professional 9% Managers and
administrators 11% Personal and protective service 12%
Professional 12%
Clerical and secretarial 12% Craft and related 14%
Source: Analysis by FÁS (SLMRU) based on CSO data
Figure 3.2 presents employment levels by broad occupational group for 2008. Although employment in craft occupations declined relative to 2007, the numbers employed as
craftspersons exceeded any other occupational group. However, by quarter 4 of 2008, the gap between the levels employed in craft relative to professional occupations was closing with 264,000 craftspersons and 254,000 professionals employed. Professional, associate professional and managerial jobs amounted to 680,000, while lower skilled ones (operatives and labourers which are captured in the other category) accounted for 360,000 jobs. There were just fewer than 260,000 various clerks employed in Ireland, over 240,000 service workers, 185,000 sales personnel and 90,000 farmers.
Figure 3.2 Numbers Employed by Broad Occupational Group, 2008 (000s)
0 100 200 300
Farmers Plant and machine operatives Sales Other Associate professional Managers and administrators Personal and protective service Professional Clerical and secretarial Craft and related
196.0 238.6
246.4 247.4 255.2
281.5
189.0
173.9 185.0
91.2
Source: Analysis by FÁS (SLMRU) based on CSO data
.2 Employment Growth
Figure 3.4 presents the average annual employment growth rates for broad occupational groups over the period 2003-2008. With the exception of farmers, employment growth was positive in all occupational groups over the period.
While the five-year average annual employment growth (2003-2008) outpaced the national average for professionals, associate professionals, labourers, service workers, sales personnel and clerks, the rate of growth for each group decelerated compared to the period 2002-2007.
Over the period 2003-2008, the strongest employment growth was in services occupations. Given that the total net job creation over the period is estimated at just fewer than 300,000, one in five net created jobs were in personal services. One third of all net job creation was at the high skill end (managerial, professional and associate professional).
2
Figure 3.3 Annual Average Employment Growth by Broad Occupational Group (%), 2003-2008
-4% -2% 0% 2% 4% 6% 8%
Farmers Plant and machine operatives Managers and administrators Craft and related Clerical and secretarial Other Associate professional Professional Sales Personal and protective service
3.2% 3.4% 3.4% 4.3%
4.5% 5.5%
3.0%
0.2% 1.7%
-0.1%
Source: Analysis by FÁS (SLMRU) based on CSO data
Following a decade of growth, employment contracted in 2008. Figure 3.4 presents annualised data for the change in employment, in absolute and relative terms, for broad occupational groups between 2007 and 2008. The economic downturn which led to the sharp contraction in construction activity resulted in a decline in the number of craftspersons and labourers employed. A net loss of over 40,000 jobs was recorded among craftspersons and labourers combined, which represents a contraction of 7% and 10% respectively.
A net job creation of almost 30,000 was recorded in high skilled occupations (managerial, professional and associate professional) between 2007 and 2008. However, by the last quarter of 2008 employment contracted in all occupational groups except for professional occupations.
Figure 3.4 Employment Growth by Broad Occupational Group, Annualised Data 2007-2008
000s %
-25 -20 -15 -10 -5 0 5 10 15
Manager
s
Assoc pr
ofes
Pr
ofessional
Services
Farmer
s
Sales
Clerical
Oper
atives
Cr
aft
Other -12%
-10% -8% -6% -4% -2% 0% 2% 4% 6% 8%
Source: Analysis by FÁS (SLMRU) based on CSO data