Original Article
CYP2E1 rsaI polymorphism and susceptibility of
gastrointestinal cancers: a meta-analysis
of 35 case-control studies
Yuan-Yuan Fu
1*, Qiu Shen
2*, Chun-Mei Ji
1*, Wen Huang
1, De-Wang Wang
1, Yu-Jiao Guo
1, Yong-Qing Wang
1,
Ling Meng
1, Ji-Fu Wei
11Research Division of Clinical Pharmacology, The First Affiliated Hospital of Nanjing Medical University, Nanjing 210029, Jiangsu Province, China; 2Department of Geriatrics, The Third People’s Hospital of Yunnan Province, Kun -ming, China. *Equal contributors.
Received September 10, 2015; Accepted December 5, 2015;Epub February 15, 2016; Published February 29, 2016
Abstract: Cytochrome 2E1, has been reported to participate in the pathogenic process of gastrointestinal (GI)
can-cers. Previous studies showed that the results are conflicting. To clarify the association between cytochrome CY -P2E1 RsaI polymorphism and risk of gastrointestinal cancers, we conducted this meta-analysis of 35 studies with
8267 cases and 11001 controls. Odds ratios (ORs) with 95% confidence intervals (CIs) were used to assess the strength of the association. We found that CYP2E1 RsaI polymorphism significantly decreased the risk of GI cancers
in heterozygous model (OR = 0.80, 95% CI: 0.66-0.97, Pheterogenecity = 0.027) and dominant model (OR = 0.77, 95% CI: 0.64-0.94, Pheterogenecity = 0.01). In subgroup analysis, CYP2E1 Rsa I polymorphism reduced the risk of esophageal cancer (EC) (allele model: OR = 0.64, 95% CI: 0.49-0.83, Pheterogenecity = 0.001; homozygous model: OR = 0.55, 95% CI: 0.42-0.72, Pheterogenecity < 0.01; heterozygous model: OR = 0.54, 95% CI: 0.36-0.81, Pheterogenecity = 0.003; dominant model: OR = 0.49, 95% CI: 0.33-0.72, Pheterogenecity < 0.01) and cases with GI cancers among the Asians (allele model: OR = 0.79, 95% CI: 0.68-0.91, Pheterogenecity = 0.001; heterozygous model: OR = 0.71, 95% CI: 0.60-0.86, Pheterogenecity < 0.01; dominant model: OR = 0.68, 95% CI: 0.56-0.83, Pheterogenecity < 0.01), but increased the risk of GI cancers in Caucasians (recessive model: OR = 1.53, 95% CI: 1.00-2.34, Pheterogenecity = 0.05). We also confirmed the result in the
high-quality studies (heterozygous model: OR = 0.80, 95% CI: 0.65-0.98, Pheterogenecity < 0.01; dominant model: OR = 0.78, 95% CI: 0.64-0.95, Pheterogenecity < 0.01) and in the literatures written in Chinese (allele model: OR = 0.73, 95% CI: 0.54-0.98, Pheterogenecity < 0.01; heterozygous model: OR = 0.66, 95% CI: 0.48-0.92, Pheterogenecity < 0.01; dominant model: OR = 0.66, 95% CI: 0.47-0.94, Pheterogenecity < 0.01). No significant association was observed in the gastric
cancer (GC) and colorectal cancer (CRC). Similar results were observed in the subgroup analysis by source of control
and pHWE. In conclusion, we suggest that CYP2E1 RsaI polymorphism significantly decreased the risk of GI cancers
especially in EC cancer type and in Asians population, but increased risk of GI cancers in the Caucasians.
Keywords: CYP2E1, RsaI polymorphism, gastrointestinal cancers, meta analysis
Introduction
Gastrointestinal (GI) cancers, especially colo-
rectal, gastric, and esophageal cancers, which
accounted for 21.0% (2.7 millions) of the total
new cancer cases and 23.1% (1.8 millions) of
the total cancer deaths, remain a major global
health problem [1]. Although the mechanism of
GI carcinogenesis is not fully understood, poor
nutritional status, smoking, excessive drinking,
and other environmental factors have been
reported to be associated with the etiology of
conducted to identify that some genes in
cytochrome P450 superfamily like CYP1A1,
CYP2E1, CYP2C19 may modulate the
suscepti-bility of cancers, which affected the activity of
the enzyme catalyzing the majority of phase I
metabolizing reaction.
enzyme has been found to participate in the
pathogenic process of tumors including
stom-ach, esophagus, colorectal, lung, and liver
can-cers [2].
The CYP2E1 gene is located on chromosome
10q26.3 with 18,754 base pairs (bp) long,
con-sists of nine exons and eight introns, and
encodes a 493-amino acid protein. Based on
the biological significance of CYP2E1, some
genetic mutations have been found to affect
the transcriptional level of the gene. The most
known point mutation is RsaI (rs2031920) in
the 5’-flanking promoter region of CYP2E1,
which is considered to alter the transcriptional
activity of the gene. The RsaI polymorphism
was identified in 5’-regulatory region with C→T
replacement in position 1019 [3, 4]. There are
three different genotypes as the homozygous
wild-type genotype (c1c1), heterozygous
geno-type (c1c2), and homozygous rare genogeno-type
(c2c2). Although many studies have
investigat-ed the association between CYP2E1 RsaI
poly-morphisms and gastrointestinal cancers risk in
the past few years, the results were still not
conclusive and consistent [7-14]. We performed
this meta-analysis of 35 published eligible
studies [15-47] to derive a more powerful
esti-mation of the association between the CYP2E1
RsaI polymorphism and the risk of GI cancers.
Materials and methods
Publication search and inclusion criteria
We conducted our search on Pubmed, Embase,
Web of Science, Chinese National Knowledge
Infrastructure (CNKI) and Wanfang Data
with-out a language limitation, covering all eligible
studies from their creation until March 10
th,
2014. Following the medical subheading
(MESH) terms: “CYP2E1” and “polymorphism or
SNP or single nucleotide polymorphism or
vari-ant or genotype” combined with “esophagus or
esophageal” or “gastric or stomach” or
“colorec-tal or colon or rectum”. The references of arti
-cles and reviews were also screened to explore
additional studies. Studies were eligible if they
met the following criteria: (a) case-control
stud-ies; (b) investigating the association between
the CYP2E1 RsaI polymorphism and the
gastro-intestinal cancers risk; (c) detailed genotype
data for estimating odds ratio (OR) and 95%
confidence interval (CI); if more than one article
was published by the same author using the
same case series, only those with complete
data or recent studies were included.
Data extraction
Data were evaluated and extracted from the
eli-gible studies by two investigators (YYF and
CMJ) independently. If discrepancies existed
between two investigators, another
investiga-tor (QS) was invited to discuss and check the
data until a consensus was reached. The fol
-lowing items from each study were recorded:
first author’s name, publication year, country,
ethnicity, cancer type, source of controls, mu-
tant points, and genotyping method, total
num-ber of cases and controls and Hardy-Winnum-berg
equilibrium (HWE), respectively. The racial
de-scents of the population were categorized as
Asians, Caucasians, and Africans. The source
of control was defined as PB (population-based)
and HB (hospital-based). All the extracted
infor-mation was input into a database.
Quality score assessment
The quality of the included studies was inde
-pendently assessed by two investigators (YYF
and DQW)
,
using the quality assessment
crite-ria which were compared to those used in the
previous published meta-analysis [54, 58]. The
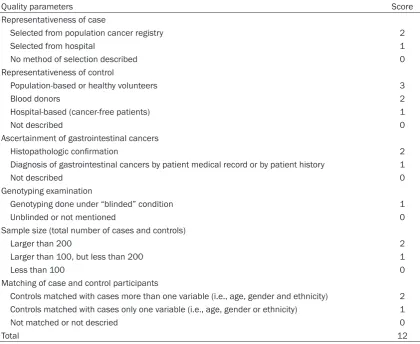
following factors were included in the criteria
(
Table S1
): representativeness of the case,
rep-resentativeness of the control, determination
of gastrointestinal cancers, genotyping
exami-nation, matching of case and control
partici-pants, and total sample size. Each component
was evaluated on a scale from 0 to 12. If the
score was ≥7, the study was categorized as
“high quality”; otherwise, the study was
catego-rized as “low quality”. All disagreements were
resolved by consensus after discussion.
Statistical analysis
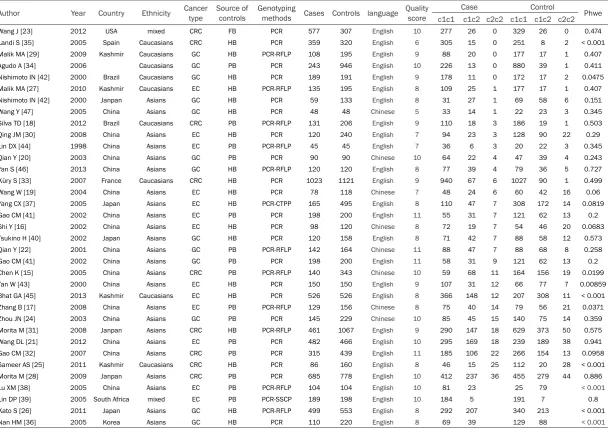
Table 1.
Characteristics of studies included in the meta-analysis
Author Year Country Ethnicity Cancer type Source of controls Genotyping methods Cases Controls language Quality score Case Control Phwe c1c1 c1c2 c2c2 c1c1 c1c2 c2c2
Wang J [23] 2012 USA mixed CRC FB PCR 577 307 English 10 277 26 0 329 26 0 0.474
Landi S [35] 2005 Spain Caucasians CRC HB PCR 359 320 English 6 305 15 0 251 8 2 < 0.001
Malik MA [29] 2009 Kashmir Caucasians GC HB PCR-RFLP 108 195 English 9 88 20 0 177 17 1 0.407
Agudo A [34] 2006 Caucasians GC PB PCR 243 946 English 10 226 13 0 880 39 1 0.411
Nishimoto IN [42] 2000 Brazil Caucasians GC HB PCR 189 191 English 9 178 11 0 172 17 2 0.0475
Malik MA [27] 2010 Kashmir Caucasians EC HB PCR-RFLP 135 195 English 8 109 25 1 177 17 1 0.407
Nishimoto IN [42] 2000 Janpan Asians GC HB PCR 59 133 English 8 31 27 1 69 58 6 0.151
Wang Y [47] 2005 China Asians GC HB PCR 48 48 Chinese 5 33 14 1 22 23 3 0.345
Silva TD [18] 2012 Brazil Caucasians CRC PB PCR-RFLP 131 206 English 9 110 18 3 186 19 1 0.503
Qing JM [30] 2008 China Asians EC HB PCR 120 240 English 7 94 23 3 128 90 22 0.29
Lin DX [44] 1998 China Asians EC PB PCR-RFLP 45 45 English 7 36 6 3 20 22 3 0.345
Qian Y [20] 2003 China Asians GC PB PCR 90 90 Chinese 10 64 22 4 47 39 4 0.243
Yan S [46] 2013 China Asians GC HB PCR-RFLP 120 120 English 8 77 39 4 79 36 5 0.727
Küry S [33] 2007 France Caucasians CRC HB PCR 1023 1121 English 9 940 67 6 1027 90 1 0.499
Wang W [19] 2004 China Asians EC HB PCR 78 118 Chinese 7 48 24 6 60 42 16 0.06
Yang CX [37] 2005 Japan Asians EC HB PCR-CTPP 165 495 English 8 110 47 7 308 172 14 0.0819
Gao CM [41] 2002 China Asians EC PB PCR 198 200 English 11 55 31 7 121 62 13 0.2
Shi Y [16] 2002 China Asians EC HB PCR 98 120 Chinese 8 72 19 7 54 46 20 0.0683
Tsukino H [40] 2002 Japan Asians GC HB PCR 120 158 English 8 71 42 7 88 58 12 0.573
Qian Y [22] 2001 China Asians GC PB PCR-RFLP 142 164 Chinese 11 88 47 7 88 68 8 0.258
Gao CM [41] 2002 China Asians GC PB PCR 198 200 English 11 58 31 9 121 62 13 0.2
Chen K [15] 2005 China Asians CRC PB PCR-RFLP 140 343 Chinese 10 59 68 11 164 156 19 0.0199
Tan W [43] 2000 China Asians EC HB PCR 150 150 English 9 107 31 12 66 77 7 0.00859
Bhat GA [45] 2013 Kashmir Caucasians EC HB PCR 526 526 English 8 366 148 12 207 308 11 < 0.001
Zhang B [17] 2008 China Asians EC PB PCR-RFLP 129 156 Chinese 8 75 40 14 79 56 21 0.0371
Zhou JN [24] 2003 China Asians GC PB PCR 145 229 Chinese 10 85 45 15 140 75 14 0.359
Morita M [31] 2008 Janpan Asians CRC HB PCR-RFLP 461 1067 English 9 290 147 18 629 373 50 0.575
Wang DL [21] 2012 China Asians EC PB PCR 482 466 English 10 295 169 18 239 189 38 0.941
Gao CM [32] 2007 China Asians CRC PB PCR 315 439 English 11 185 106 22 266 154 13 0.0958
Sameer AS [25] 2011 Kashmir Caucasians CRC HB PCR 86 160 English 8 46 15 25 112 20 28 < 0.001
Morita M [28] 2009 Janpan Asians CRC PB PCR 685 778 English 10 412 237 36 455 279 44 0.886
Lu XM [38] 2005 China Asians EC PB PCR-RFLP 104 104 English 10 81 23 25 79 < 0.001
Lin DP [39] 2005 South Africa mixed EC PB PCR-SSCP 189 198 English 10 184 5 191 7 0.8
Kato S [26] 2011 Japan Asians GC HB PCR-RFLP 499 553 English 8 292 207 340 213 < 0.001
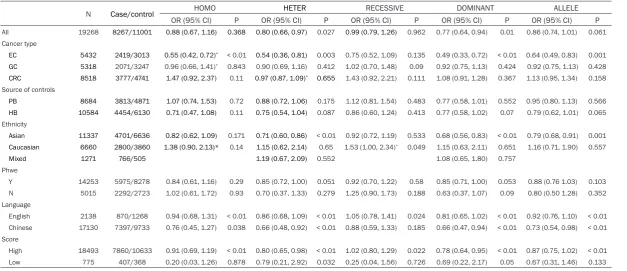
Table 2.
Main results of the pooled data in the meta-analysis
N Case/control HOMO HETER RECESSIVE DOMINANT ALLELE
OR (95% CI) P OR (95% CI) P OR (95% CI) P OR (95% CI) P OR (95% CI) P
All 19268 8267/11001 0.88 (0.67, 1.16) 0.368 0.80 (0.66, 0.97) 0.027 0.99 (0.79, 1.26) 0.962 0.77 (0.64, 0.94) 0.01 0.86 (0.74, 1.01) 0.061 Cancer type
EC 5432 2419/3013 0.55 (0.42, 0.72)* < 0.01 0.54 (0.36, 0.81) 0.003 0.75 (0.52, 1.09) 0.135 0.49 (0.33, 0.72) < 0.01 0.64 (0.49, 0.83) 0.001
GC 5318 2071/3247 0.96 (0.66, 1.41)* 0.843 0.90 (0.69, 1.16) 0.412 1.02 (0.70, 1.48) 0.09 0.92 (0.75, 1.13) 0.424 0.92 (0.75, 1.13) 0.428
CRC 8518 3777/4741 1.47 (0.92, 2.37) 0.11 0.97 (0.87, 1.09)* 0.655 1.43 (0.92, 2.21) 0.111 1.08 (0.91, 1.28) 0.367 1.13 (0.95, 1.34) 0.158
Source of controls
PB 8684 3813/4871 1.07 (0.74, 1.53) 0.72 0.88 (0.72, 1.06) 0.175 1.12 (0.81, 1.54) 0.483 0.77 (0.58, 1.01) 0.552 0.95 (0.80, 1.13) 0.566
HB 10584 4454/6130 0.71 (0.47, 1.08) 0.11 0.75 (0.54, 1.04) 0.087 0.86 (0.60, 1.24) 0.413 0.77 (0.58, 1.02) 0.07 0.79 (0.62, 1.01) 0.065
Ethnicity
Asian 11337 4701/6636 0.82 (0.62, 1.09) 0.171 0.71 (0.60, 0.86) < 0.01 0.92 (0.72, 1.19) 0.533 0.68 (0.56, 0.83) < 0.01 0.79 (0.68, 0.91) 0.001
Caucasian 6660 2800/3860 1.38 (0.90, 2.13)* 0.14 1.15 (0.62, 2.14) 0.65 1.53 (1.00, 2.34)* 0.049 1.15 (0.63, 2.11) 0.651 1.16 (0.71, 1.90) 0.557
Mixed 1271 766/505 1.19 (0.67, 2.09) 0.552 1.08 (0.65, 1.80) 0.757
Phwe
Y 14253 5975/8278 0.84 (0.61, 1.16) 0.29 0.85 (0.72, 1.00) 0.051 0.92 (0.70, 1.22) 0.58 0.85 (0.71, 1.00) 0.053 0.88 (0.76 1.03) 0.103 N 5015 2292/2723 1.02 (0.61, 1.72) 0.93 0.70 (0.37, 1.33) 0.279 1.25 (0.90, 1.73) 0.188 0.63 (0.37, 1.07) 0.09 0.80 (0.50 1.28) 0.352 Language
English 2138 870/1268 0.94 (0.68, 1.31) < 0.01 0.86 (0.68, 1.09) < 0.01 1.05 (0.78, 1.41) 0.024 0.81 (0.65, 1.02) < 0.01 0.92 (0.76, 1.10) < 0.01 Chinese 17130 7397/9733 0.76 (0.45, 1.27) 0.038 0.66 (0.48, 0.92) < 0.01 0.88 (0.59, 1.33) 0.185 0.66 (0.47, 0.94) < 0.01 0.73 (0.54, 0.98) < 0.01 Score
High 18493 7860/10633 0.91 (0.69, 1.19) < 0.01 0.80 (0.65, 0.98) < 0.01 1.02 (0.80, 1.29) 0.022 0.78 (0.64, 0.95) < 0.01 0.87 (0.75, 1.02) < 0.01 Low 775 407/368 0.20 (0.03, 1.26) 0.878 0.79 (0.21, 2.92) 0.032 0.25 (0.04, 1.56) 0.726 0.69 (0.22, 2.17) 0.05 0.67 (0.31, 1.46) 0.133
(C2 vs C1). The statistical significance of pooled
ORs was determined by Z-test and a P < 0.05
was considered as statistically significant. A
chi-square based Q-test was used to check the
heterogeneity among the studies. A P < 0.10 for
Q-test suggested significant heterogeneity
among the studies, and the random-effects
model (DerSimonian-Laird method) was
con-ducted to calculate the pooled ORs [49];
other-wise the fixed-effects model (Mantel-Haenszel
method) was used [50]. Subgroup analyses
were also performed to test the effects of
[image:5.629.100.526.84.534.2]eth-nicity, cancer type, pHWE, and source of
con-trols. As genotyping methods in most of the
studies are PCR method, we didn’t perform it
into subgroup type. Sensitivity analysis was
car-ried out to identify the effect of data from each
study on pooled ORs. Begg’s funnel plot and
Egger’s linear regression test were performed
to evaluate publication bias of literatures and a
P < 0.05 was considered significant [51, 52]. All
of the statistical tests were performed by STATA
software version 12.0 (STATA Corporation,
College Station, TX, USA).
Results
Study characteristics
In total, 33 eligible publications with 8267 ca-
ses and 11001 controls were included in this
meta-analysis. Of which eight were written in
Chinese language [15-17, 19, 20, 22, 24, 47].
These studies were carried out in China, Spain,
USA, Japan, Brazil, Kashmir, Korea, France and
South Africa. Notably, one study was conducted
in Brazil involved two separate subgroups:
Brazilian and Japanese [42]. And in the other
study, GC and EC research are conducted
together [41]. Consequently, the data were ex-
tracted and considered as two solitary studies
for analysis. All the relevant information is
pre-sented in
Table 1
. The distribution of genotypes
in the controls in 10 studies [15, 17, 25, 26, 35,
36, 38, 42, 43, 45] deviated from HWE. As
Minelli et al. pointed out that studies appeared
to deviate from HWE should be investigated
fur-ther rafur-ther than just excluded unless fur-there are
other grounds for doubting the quality of the
study. We keep these ten studies and carried
out a subgroup analysis on HWE [59].
Meta-analysis outcomes
The results of the meta-analysis for CYP2E1
RsaI polymorphism and GI cancers is shown in
[image:6.629.101.524.80.378.2]Table 2
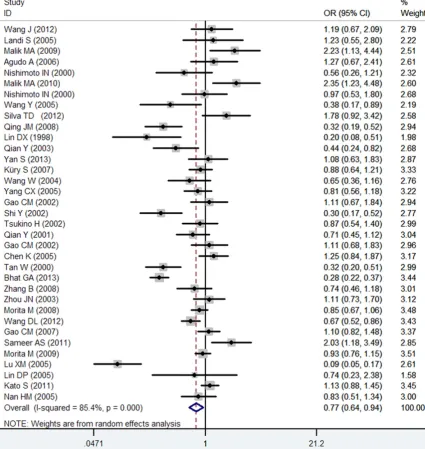
. Overall, the CYP2E1 RsaI
polymor-phism decreased the risk of GI cancers in
het-erozygous model (OR = 0.80, 95% CI:
0.66-0.97, P
heterogenecity= 0.027) and dominant model
(OR = 0.77, 95% CI: 0.64-0.94, P
heterogenecity=
0.01) (
Figure 1
), but not in homozygous model
and recessive model. In subgroup analysis by
cancer type, we found that the CYP2E1 RsaI
polymorphism were associated with significant
-ly reduced risk of EC in allele model (OR = 0.64,
95% CI: 0.49-0.83, P
heterogenecity= 0.001),
homo-zygous model (OR = 0.55, 95% CI: 0.42-0.72,
P
heterogenecity< 0.01), heterozygous model (OR =
0.54, 95% CI: 0.36-0.81, P
heterogenecity= 0.003)
and dominant model (OR = 0.49, 95% CI:
0.33-0.72, P
heterogenecity< 0.01) but not in recessive
model. In the stratified analysis by ethnicity,
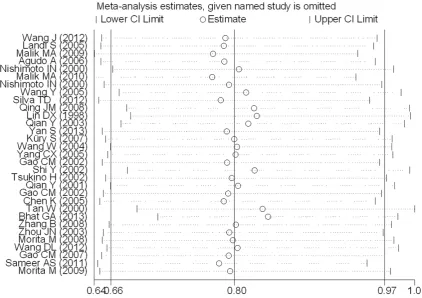
Figure 2. Influence analysis under the heterozygous model. It shows the influence of each individual study on the summary OR. The middle vertical axis indicates the overall OR and the two vertical axes indicate its 95% CI. Each hollow round indicates the pooled OR when the left study is omitted in this meta-analysis. The two ends of eachobvious decreased susceptibility of GI cancers
was also detected in Asians (allele model: OR =
0.79, 95% CI: 0.68-0.91, P
heterogenecity= 0.001;
heterozygous model: OR = 0.71, 95% CI:
0.60-0.86, P
heterogenecity< 0.01; dominant model: OR =
0.68, 95% CI: 0.56-0.83, P
heterogenecity< 0.01;
homozygous model: OR = 0.82, 95% CI:
0.62-1.09, P
heterogenecity= 0.171; recessive model: OR
= 0.92, 95% CI: 0.72-1.19, P
heterogenecity= 0.533).
However, increased risk was observed in
patients of GI cancers among Caucasians
(het-erozygous model: OR = 1.15, 95% CI:
0.62-2.14, P
heterogenecity= 0.65; dominant model: OR =
1.15, 95% CI: 0.63-2.11, P
heterogenecity= 0.651;
homozygous model: OR = 1.38, 95% CI:
0.90-2.13, P
heterogenecity= 0.14; recessive model: OR
=1.53, 95% CI: 1.00-2.34, P
heterogenecity= 0.05).
We also confirmed this result in the high-quality
studies (heterozygous model: OR = 0.80, 95%
CI: 0.65-0.98, P
heterogenecity< 0.01; dominant
model: OR = 0.78, 95% CI: 0.64-0.95, P
heterogenecity< 0.01) and in the literatures written in Chinese
(allele model: OR = 0.73, 95% CI: 0.54-0.98,
P
heterogenecity< 0.01; heterozygous model: OR =
0.66, 95% CI: 0.48-0.92, P
heterogenecity< 0.01;
dominant model: OR = 0.66, 95% CI: 0.47-0.94,
P
heterogenecity< 0.01). No association was found
between CYP2E1 RsaI polymorphisms and risk
of GC or CRC. The further analyses by source of
control or Phwe did not yield a significant result.
Sensitivity analysis
Influence analysis was performed to evaluate
the effect of each individual study on the
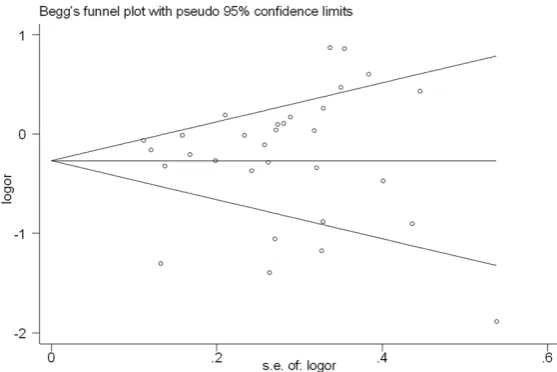
ed to statistical test and publication bias was
not detected either (P = 0.527).
Discussion
CYP2E1 is present in some tissues as kidney,
lung, brain, gastrointestinal tract at relatively
low levels. Although the actions of CYP2E1
under various pathophysiological conditions
are still not much known, increased activity of
CYP2E1 has been reported to be an underlying
cause for increased cancer risk through the
increased production of ROS and enhanced the
activation of a variety of procarcinogens [53].
In this meta-analysis, 35 studies were
includ-ed, involving 8267 cases and 11001 controls.
The results strongly suggested that CYP2E1
RsaI polymorphisms decreased the risk of GI
cancers. And the subgroup analysis by cancer
type showed that CYP2E1 RsaI polymorphisms
significantly reduced the risk of EC, but not
associated with GC or CRC, which could be
explained by the reason that the same
polymor-phism may play different roles in different
tumor sites as GI cancers are fairly complex
dis-eases [60, 61]. Niu et al. demonstrates that
CYP2E1 Rsa I/Pst I c2 allele may be a decreased
risk factor for developing esophageal cancer
among Asians [12]. And the same result was
found in Lu’s study, they found that c1/c1
geno-type increased the risk of the development of
esophageal cancer in Chinese population [38].
The reason could be further explained by the
genotype distribution frequency in healthy
sub-Figure 3. Funnel plot of CYP2E1 RsaI polymorphism and GI cancers risk forpublication bias.
pooled OR in each analysis, by
removing an individual study
sequentially. However, the re-
sults were slightly altered by
four studies [16, 30, 43, 44]
under the heterozygous model
which showed a borderline
trend of decreased risk (
Figure
2
).
Publication bias
[image:7.629.100.379.80.266.2]conduct-jects of different ethnic groups, and the various
exposure levels to xenobiotics across the study
population.
Zhou et al. conducted a meta-analysis to
assess the association between CYP2E1 Rsa I/
PstI polymorphism and CRC risk and found that
the Rsa I/PstI polymorphism may be
associat-ed with increasassociat-ed risk of CRC in Caucasians
[13]. Our analysis based on the ethnic subgroup
also showed that Caucasians under recessive
model had an increased risk of GI cancers, but
a decreased risk in Asians under the
heterozy-gous model and dominant model. Possible
explanation for this may include various
fre-quency distributions of Rsa I c2 allele, different
living habits and environment [55]. C2 allele
has been reported with 10-fold higher
tran-scriptional activity than c1 allele in the HepG2
cell line [4], and its overexpression could be
partially explain the individual with c2 are more
susceptible to CRC. And it also should be
noticed that those ethnic groups consuming
red meat and salted meal are more susceptible
to colorectal cancer, which increase the
endog-enous production of N-nitroso compounds in
the intestine [56]. At the same time, high risk of
gastric cancer was also found in alcohol
abus-ers [57]. Therefore, the existing evidence on
the association between CYP2E1 RsaI polym-
orphism and gastric cancer susceptibility is
controversial, and the molecular mechanisms
which determine individual susceptibility re-
main unclear.
No significant association was observed in the
EC and CRC cancers subgroup. Similar results
were observed in the subgroup analysis on
source of control and Phwe. This discrepancie
might be due to different disease mechanisms,
carcinogen exposure in different populations
and sample size.
In addition, quality assessment of the included
studies and multiple subgroup analysis which
could sufficiently explore the heterogeneity
were also performed in our meta-analysis.
Most of the included studies [15-34, 36-46]
were high quality, except for two studies [35,
47]; this result indicates that the quality of all
the included studies was high, which confirmed
our conclusion. The association between cyto
-chrome CYP2E1 RsaI polymorphism and risk of
gastrointestinal cancers may vary in different
regions. In this meta-analysis, we conducted
studies written in both Chinese and English, so
our careful investigation represents a
compara-tively rigorous and large-scale study.
Although the results of this study are
sugges-tive, some limitations still exist. The controls
included in our study were selected randomly
either from population or hospital based
popu-lation. Therefore, misclassification bias was
possible because these studies may have
con-tained control groups who have different risks
of developing GI cancers. And no study
regard-ing African populations was done. Besides,
dis-ease classification and interactive effects with
environmental exposures were not fully
consid-ered without information.
In conclusion, our meta-analysis suggests that
CYP2E1 RsaI polymorphism significantly
de-creased the risk of GI cancers especially in EC
cancer type and in Asians population, but also
showed an increased risk of GI cancers in the
Caucasians. This study suggests that more
well-designed studies with large samples of
dif-ferent ethnic populations should be conducted
for further investigation.
Acknowledgements
This project was sponsored by National
Natur-al Science Foundation of China (81302331,
31340073, and 81001329); National Major
Scientific and Technological Special Project for
“Significant New Drugs Development”
(2011-ZX09302-003-02), Jiangsu Province Major Sc-
ientific and Technological Special Project
(BM-2011017), and A Project Funded by the Priority
Academic Program Development of Jiangsu
Higher Education Institutions.
Disclosure of conflict of interest
None.
Address correspondence to: Ji-Fu Wei and Ling Meng, Research Division of Clinical Pharmacolo-
gy, The First Affiliated Hospital of Nanjing
Medi-cal University, Nanjing 210029, Jiangsu Province, China. E-mail: [email protected] (JFW); [email protected] (LM)
References
[2] Danko IM and Chaschin NA. Association of CYP2E1 gene polymorphism with predisposi-tion to cancer development. Exp Oncol 2005; 27: 248-256.
[3] Watanabe J, Hayashi S, Nakachi K, Imai K,
Suda Y, Sekine T and Kawajiri K. PstI and RsaI
RFLPs in complete linkage disequilibrium at the CYP2E gene. Nucleic Acids Res 1990; 18: 7194.
[4] Hayashi S, Watanabe J and Kawajiri K. Genetic
polymorphisms in the 5’-flanking region
change transcriptional regulation of the hu-man cytochrome P450IIE1 gene. J Biochem 1991; 110: 559-565.
[5] Miksys S and Tyndale RF. The unique regula -tion of brain cytochrome P450 2 (CYP2) family enzymes by drugs and genetics. Drug Metab Rev 2004; 36: 313-333.
[6] Huang X, Chen L, Song W, Niu J, Han X, Feng G, He L and Qin S. Systematic functional charac-terization of cytochrome P450 2E1 promoter variants in the Chinese Han population. PLoS One 2012; 7: e40883.
[7] Qian J, Song Z, Lv Y and Huang X. CYP2E1
T7632A and 9-bp insertion polymorphisms
and colorectal cancer risk: a meta-analysis
based on 4,592 cases and 5,918 controls. Tu -mour Biol 2013; 34: 2225-2231.
[8] Peng H, Xie SK, Huang MJ and Ren DL. Asso-ciations of CYP2E1 rs2031920 and rs38- 13867 polymorphisms with colorectal cancer
risk: a systemic review and meta-analysis. Tu -mour Biol 2013; 34: 2389-2395.
[9] Jiang O, Zhou R, Wu D, Liu Y, Wu W and Cheng N. CYP2E1 polymorphisms and colorectal can-cer risk: a HuGE systematic review and
meta-analysis. Tumour Biol 2013; 34: 1215-1224.
[10] Leng WD, Zeng XT, Chen YJ, Duan XL, Niu YM,
Long RP and Luo ZX. Cytochrome P450 2E1 RsaI/PstI polymorphism and risk of esopha-geal cancer: A meta-analysis of 17
case-con-trol studies. Exp Ther Med 2012; 4: 938-948.
[11] Zhuo W, Zhang L, Wang Y, Ling J, Zhu B and Chen Z. CYP2E1 RsaI/PstI polymorphism and gastric cancer susceptibility: meta-analyses based on 24 case-control studies. PLoS One 2012; 7: e48265.
[12] Niu Y, Yuan H, Leng W, Pang Y, Gu N and Chen N. CYP2E1 Rsa I/Pst I polymorphism and esophageal cancer risk: a meta-analysis based on 1,088 cases and 2,238 controls. Med On-col 2011; 28: 182-187.
[13] Zhou GW, Hu J and Li Q. CYP2E1 PstI/RsaI polymorphism and colorectal cancer risk: a meta-analysis. World J Gastroenterol 2010; 16: 2949-2953.
[14] Boccia S, De Lauretis A, Gianfagna F, van Duijn CM and Ricciardi G. CYP2E1PstI/RsaI polymor-phism and interaction with tobacco, alcohol
and GSTs in gastric cancer susceptibility: A
meta-analysis of the literature. Carcinogenesis 2007; 28: 101-106.
[15] Chen K, Jin MJ, Fan CH, Song L, Jiang QT, Yu
WP, Ma XY and Yao KY. [A case-control study on the association between genetic polymor-phisms of metabolic enzymes and the risk of colorectal cancer]. Zhonghua Liu Xing Bing Xue Za Zhi 2005; 26: 659-664.
[16] Shi Y, Zhou XW, Zhou YK. Analysis of CYP2E1,
GSTM1 genetic polymorphisms in relation to
human lung cancer and esophageal
carcino-ma. J Huazhong Univ Sci Tech [Health Sci]
2002; 31: 14-17.
[17] Zhang B, Wu J. Correlation between genetic polymorphism of CYP2E1 and susceptibility of esophageal cancer in Gansu province. J Chengde Med Col 2008; 25: 245-248.
[18] Silva TD, Felipe AV, Pimenta CA, Barao K and
Forones NM. CYP2E1 RsaI and 96-bp insertion genetic polymorphisms associated with risk for colorectal cancer. Genet Mol Res 2012; 11: 3138-3145.
[19] Wang W, Shi RH, Zhao ZQ. Impact of CYP2E1 polymorphisms on the risk of esophageal
can-cer. ACTA Nanjing Med Univ 2004; 24:
344-347.
[20] Qian Y, Xu YC, Shen HB, Zhou L, Yu RB, Niu TY, Tan Y. Relationship between CYP2E1, GSTT1
genetic polymorphisms and susceptibility to gastric cancer. Chin J Pre Contr Chron Non-commun Dis 2003; 11: 17-109.
[21] Wang D, Su M, Tian D, Liang S and Zhang J.
Associations between CYP1A1 and CYP2E1 polymorphisms and susceptibility to
esopha-geal cancer in Chaoshan and Taihang areas of
China. Cancer Epidemiol 2012; 36: 276-282. [22] Qian Y, Xu YC, Shen HB. Cytochrome P4502E1
and the genetic susceptibility to gastric cancer. Chinese Primary Health Care 2001; 15: 16-18. [23] Wang J, Joshi AD, Corral R, Siegmund KD,
Marchand LL, Martinez ME, Haile RW, Ahnen DJ, Sandler RS, Lance P and Stern MC. Car-cinogen metabolism genes, red meat and poultry intake, and colorectal cancer risk. Int J Cancer 2012; 130: 1898-1907.
[24] Zhou JN, Gao CM, Toshiro T. Interaction be -tween polymorphisms in CYP2E1 RsaI geno-types and lifestyle with risk of stomach cancer. J Oncol 2003; 9: 285-288.
[25] Sameer AS, Nissar S, Qadri Q, Alam S, Baba SM and Siddiqi MA. Role of CYP2E1 genotypes in susceptibility to colorectal cancer in the Kashmiri population. Hum Genomics 2011; 5: 530-537.
cancerous gastric mucosa and association with its genetic polymorphism in unoperated and remnant stomach. J Nippon Med Sch 2011; 78: 224-234.
[27] Malik MA, Upadhyay R, Mittal RD, Zargar SA and Mittal B. Association of xenobiotic metab-olizing enzymes genetic polymorphisms with
esophageal cancer in Kashmir Valley and influ -ence of environmental factors. Nutr Cancer 2010; 62: 734-742.
[28] Morita M, Le Marchand L, Kono S, Yin G, Toyo
-mura K, Nagano J, Mizoue T, Mibu R, Tanaka M, Kakeji Y, Maehara Y, Okamura T, Ikejiri K, Futami K, Maekawa T, Yasunami Y, Takenaka
K, Ichimiya H and Imaizumi N. Genetic poly-morphisms of CYP2E1 and risk of colorectal cancer: the Fukuoka Colorectal Cancer Study. Cancer Epidemiol Biomarkers Prev 2009; 18: 235-241.
[29] Malik MA, Upadhyay R, Mittal RD, Zargar SA, Modi DR and Mittal B. Role of xenobiotic-me-tabolizing enzyme gene polymorphisms and interactions with environmental factors in sus-ceptibility to gastric cancer in Kashmir Valley. J Gastrointest Cancer 2009; 40: 26-32.
[30] Qin JM, Yang L, Chen B, Wang XM, Li F, Liao PH and He L. Interaction of
methylenetetrahydro-folate reductase C677T, cytochrome P4502E1
polymorphism and environment factors in esophageal cancer in Kazakh population. Wo- rld J Gastroenterol 2008; 14: 6986-6992. [31] Morita M, Tabata S, Tajima O, Yin G, Abe H and
Kono S. Genetic polymorphisms of CYP2E1 and risk of colorectal adenomas in the Self De-fense Forces Health Study. Cancer Epidemiol Biomarkers Prev 2008; 17: 1800-1807. [32] Gao CM, Takezaki T, Wu JZ, Chen MB, Liu YT,
Ding JH, Sugimura H, Cao J, Hamajima N and
Tajima K. CYP2E1 Rsa I polymorphism impacts
on risk of colorectal cancer association with smoking and alcohol drinking. World J Gastro-enterol 2007; 13: 5725-5730.
[33] Kury S, Buecher B, Robiou-du-Pont S, Scoul C,
Sebille V, Colman H, Le Houerou C, Le Neel T,
Bourdon J, Faroux R, Ollivry J, Lafraise B, Chu-pin LD and Bezieau S. Combinations of cyto-chrome P450 gene polymorphisms enhancing the risk for sporadic colorectal cancer related to red meat consumption. Cancer Epidemiol Biomarkers Prev 2007; 16: 1460-1467. [34] Agudo A, Sala N, Pera G, Capella G, Berenguer
A, Garcia N, Palli D, Boeing H, Del Giudice G, Saieva C, Carneiro F, Berrino F, Sacerdote C,
Tumino R, Panico S, Berglund G, Siman H,
Stenling R, Hallmans G, Martinez C, Amiano P, Barricarte A, Navarro C, Quiros JR, Allen N, Key
T, Bingham S, Khaw KT, Linseisen J, Nagel G, Overvad K, Tjonneland A, Olsen A,
Bueno-de-Mesquita HB, Boshuizen HC, Peeters PH, Nu-mans ME, Clavel-Chapelon F, Boutron-Ruault
MC, Trichopoulou A, Lund E, Blaker H, Jenab M, Ferrari P, Norat T, Riboli E and Gonzalez CA.
No association between polymorphisms in
CY-P2E1, GSTM1, NAT1, NAT2 and the risk of gas -tric adenocarcinoma in the European prospec-tive investigation into cancer and nutrition. Cancer Epidemiol Biomarkers Prev 2006; 15: 1043-1045.
[35] Landi S, Gemignani F, Moreno V, Gioia-Patrico-la L, Chabrier A, Guino E, Navarro M, de Oca J, Capella G and Canzian F. A comprehensive analysis of phase I and phase II metabolism gene polymorphisms and risk of colorectal cancer. Pharmacogenet Genomics 2005; 15: 535-546.
[36] Nan HM, Song YJ, Yun HY, Park JS and Kim H. Effects of dietary intake and genetic factors on hypermethylation of the hMLH1 gene promoter in gastric cancer. World J Gastroenterol 2005; 11: 3834-3841.
[37] Yang CX, Matsuo K, Ito H, Hirose K, Wakai K,
Saito T, Shinoda M, Hatooka S, Mizutani K and Tajima K. Esophageal cancer risk by
ALDH2 and ADH2 polymorphisms and alcohol consumption: exploration of gene-environment and gene-gene interactions. Asian Pac J Can-cer Prev 2005; 6: 256-262.
[38] Lu XM, Zhang YM, Lin RY, Arzi G, Wang X, Zhang YL, Zhang Y, Wang Y and Wen H. Relationship between genetic polymorphisms of
metaboliz-ing enzymes CYP2E1, GSTM1 and Kazakh’s
esophageal squamous cell cancer in Xinjiang, China. World J Gastroenterol 2005; 11: 3651-3654.
[39] Li D, Dandara C and Parker MI. Association of cytochrome P450 2E1 genetic polymorphisms with squamous cell carcinoma of the oesopha-gus. Clin Chem Lab Med 2005; 43: 370-375. [40] Tsukino H, Kuroda Y, Qiu D, Nakao H, Imai H
and Katoh T. Effects of cytochrome P450 (CYP)
2A6 gene deletion and CYP2E1 genotypes on gastric adenocarcinoma. Int J Cancer 2002; 100: 425-428.
[41] Gao C, Takezaki T, Wu J, Li Z, Wang J, Ding J, Liu Y, Hu X, Xu T, Tajima K and Sugimura H. Inter -action between cytochrome P-450 2E1 poly-morphisms and environmental factors with risk of esophageal and stomach cancers in Chinese. Cancer Epidemiol Biomarkers Prev 2002; 11: 29-34.
[42] Nishimoto IN, Hanaoka T, Sugimura H, Nagura K, Ihara M, Li XJ, Arai T, Hamada GS, Kowalski LP and Tsugane S. Cytochrome P450 2E1 poly -morphism in gastric cancer in Brazil: case-con-trol studies of Japanese Brazilians and non-Japanese Brazilians. Cancer Epidemiol Bio- markers Prev 2000; 9: 675-680.
glu-tathione S-transferases M1, T1, and P1 on
susceptibility to esophageal cancer among high-risk individuals in China. Cancer Epidemi-ol Biomarkers Prev 2000; 9: 551-556. [44] Lin DX, Tang YM, Peng Q, Lu SX, Ambrosone CB
and Kadlubar FF. Susceptibility to esophageal cancer and genetic polymorphisms in
glutathi-one S-transferases T1, P1, and M1 and cyto -chrome P450 2E1. Cancer Epidemiol Biomark-ers Prev 1998; 7: 1013-1018.
[45] Bhat GA, Shah IA, Makhdoomi MA, Iqbal B,
Rafiq R, Nabi S, Masood A, Lone MM and Dar
NA. CYP1A1 and CYP2E1 genotypes and risk of esophageal squamous cell carcinoma in a
high-incidence region, Kashmir. Tumour Biol
2014; 35: 5323-5330.
[46] Yan S, Bai ZZ, Zhao JX, Xie DW, Wu JL. Correla-tion between genetic polymorphisms of CY-P2E1 RsaI and susceptibility of gastric cancer in Qinghai Province. J Qinghai Med Col 2013; 34: 7-14.
[47] Wang Y, Jiang YH, Sun WJ. Effects of genetic polymorphism of Cytochrome P450 2E1 on susceptibility to gastric cancer. Chin J Public Health 2005; 21: 664-665.
[48] Higgins JP, Thompson SG, Deeks JJ and Altman
DG. Measuring inconsistency in meta-analy-ses. BMJ 2003; 327: 557-560.
[49] DerSimonian R and Laird N. Meta-analysis in
clinical trials. Control Clin Trials 1986; 7:
177-188.
[50] Mantel N and Haenszel W. Statistical aspects of the analysis of data from retrospective stud-ies of disease. J Natl Cancer Inst 1959; 22: 719-748.
[51] Begg CB and Mazumdar M. Operating charac-teristics of a rank correlation test for publica-tion bias. Biometrics 1994; 50: 1088-1101. [52] Egger M, Davey Smith G, Schneider M and
Minder C. Bias in meta-analysis detected by a simple, graphical test. BMJ 1997; 315: 629-634.
[53] Caro AA and Cederbaum AI. Oxidative stress, toxicology, and pharmacology of CYP2E1. Annu
Rev Pharmacol Toxicol 2004; 44: 27-42.
[54] Palli D, Saieva C, Luzzi I, Masala G, Topa S,
Sera F, Gemma S, Zanna I, D’Errico M, Zini E,
Guidotti S, Valeri A, Fabbrucci P, Moretti R, Tes -tai E, del Giudice G, Ottini L, Matullo G, Dogliot-ti E and Gomez-Miguel MJ. Interleukin-1 gene polymorphisms and gastric cancer risk in a high-risk Italian population. Am J Gastroenterol 2005; 100: 1941-1948.
[55] Ulusoy G, Arinc E and Adali O. Genotype and allele frequencies of polymorphic CYP2E1 in
the Turkish population. Arch Toxicol 2007; 81:
711-718.
[56] Le Marchand L, Donlon T, Seifried A and
Wilkens LR. Red meat intake, CYP2E1 genetic polymorphisms, and colorectal cancer risk. Cancer Epidemiol Biomarkers Prev 2002; 11: 1019-1024.
[57] Suzuki S, Muroishi Y, Nakanishi I and Oda Y. Relationship between genetic polymorphisms of drug-metabolizing enzymes (CYP1A1,
CY-P2E1, GSTM1, and NAT2), drinking habits, his -tological subtypes, and p53 gene point muta-tions in Japanese patients with gastric cancer. J Gastroenterol 2004; 39: 220-230.
[58] Gao LB, Pan XM, Li LJ, Liang WB, Bai P, Rao L,
Su XW, Wang T, Zhou B, Wei YG and Zhang L. Null genotypes of GSTM1 and GSTT1 contrib -ute to risk of cervical neoplasia: an evidence-based meta-analysis. PLoS One 2011; 6: e20157.
[59] Minelli C, Thompson JR, Abrams KR, Thakkin -stian A and Attia J. How should we use informa-tion about HWE in the meta-analyses of genet-ic association studies? Int J Epidemiol 2008; 37: 136-146.
[60] Yao L, Wang HC, Liu JZ and Xiong ZM.
Quantita-tive assessment of the influence of cytochrome
P450 2C19 gene polymorphisms and
diges-tive tract cancer risk. Tumour Biol 2013; 34:
3083-3091.
Table S1.
Scale for quality assessment
Quality parameters Score
Representativeness of case
Selected from population cancer registry 2
Selected from hospital 1
No method of selection described 0
Representativeness of control
Population-based or healthy volunteers 3
Blood donors 2
Hospital-based (cancer-free patients) 1
Not described 0
Ascertainment of gastrointestinal cancers
Histopathologic confirmation 2
Diagnosis of gastrointestinal cancers by patient medical record or by patient history 1
Not described 0
Genotyping examination
Genotyping done under “blinded” condition 1
Unblinded or not mentioned 0
Sample size (total number of cases and controls)
Larger than 200 2
Larger than 100, but less than 200 1
Less than 100 0
Matching of case and control participants
Controls matched with cases more than one variable (i.e., age, gender and ethnicity) 2 Controls matched with cases only one variable (i.e., age, gender or ethnicity) 1
Not matched or not descried 0
Total 12