Original Article
Susceptibility-diffusion mismatch: an effective method
by which to detect perfusion-diffusion mismatch in
acute ischemic stroke
Huiqin Liu1*, Wenli Mei1*, Yongli Li2, Yue Huang1, Shiwang Ruan3, Qingxia Zhang1, Jiewen Zhang1
Departments of 1Neurology, 2Radiology, People’s Hospital of Zhengzhou University, Zhengzhou, Henan, P. R.
China; 3Department of Neurology, Center Hospital of Zhumadian, Zhumadian, Henan, P. R. China. *Equal
contribu-tors.
Received April 19, 2016; Accepted September 2, 2016; Epub October 15, 2016; Published October 30, 2016
Abstract: Asymmetrically hypointense veins (AHVs) on susceptibility-weighted imaging (SWI) have been proposed to be a surrogate marker by which to predict penumbra. This study aimed to assess the value of AHVs in detecting penumbra in acute ischemic stroke. We conducted a retrospective study of patients with acute anterior circula-tion ischemic stroke who underwent diffusion-weighted imaging (DWI), SWI, perfusion-weighted imaging (PWI), and magnetic resonance angiography (MRA). Stroke severities were measured using the National Institutes of Health
Stroke Scale (NIHSS). A favorable outcome was defined as a modified Rankin Scale of 0-2 at 3.0 months. We evalu -ated AHVs, the infarction, and the perfusion lesions, and assessed the correlations of SWI/DWI with PWI/DWI and
PWI-DWI mismatch volumes. The receiver operating characteristic (ROC) curve was used to find the cutoff SWI-DWI
mismatch to detect optimal PWI-DWI mismatch. The associations of SWI-DWI mismatch with clinical data and MR parameters were analyzed. Fifty-three patients were enrolled in this study. SWI/DWI was positively correlated with PWI/DWI and PWI-DWI mismatch volumes. Patients with SWI-DWI mismatch were more likely to have stenosis of the internal cerebral artery or proximal middle cerebral artery, smaller infarction, and larger PWI-DWI mismatch vol-umes. The stroke severities of these patients on admission and at discharge were more likely to be mild or
moder-ate. Favorable outcomes between the two groups were not significantly different. In conclusion, SWI-DWI mismatch
is an effective method by which to evaluate the detection value of AHVs for penumbra, and is related to mild or moderate severity of acute stroke, but not to a favorable outcome.
Keywords: Asymmetrically hypointense veins (AHVs), penumbra, ischemic stroke, PWI-DWI mismatch, SWI-DWI mismatch
Introduction
Ischemic stroke is one of the most common of the worldwide diseases with high mortality and disability rates [1]. The key to treating ischemic stroke is saving the ischemic penumbra. For patients with large vascular occlusion after acute cerebral infarction, the shorter the onset time, the less necrotic tissue and the more healthy tissue that can be saved [2]; however, recent data suggest that the rate of irreversible death of ischemic neurons after stroke is highly variable. A number of factors, such as the loca-tion of blood vessels and collateral circulaloca-tion, can influence the death of ischemic neurons [3]; therefore, timely assessment of the penum-bra tissue is the key to choosing which patients
T2* magnetic resonance imaging (MRI) tech-nique [7, 8] that is based on the blood oxygen level-dependent (BOLD) image principle [9, 10]. In acute ischemic stroke, severe reduction in cerebral perfusion pressure causes an increase in the ratio of deoxyhemoglobin to oxyhemoglo-bin by increasing the oxygen extraction fraction (OEF) [11-14]. As a result, SWI shows increased and stronger drainage veins in the hypoperfu-sion region than in normal brain areas, which are called “asymmetrically hypointense veins (AHVs)” or “prominent veins” [13-15].
This potential metabolic information on SWI might help to delineate penumbra without hav-ing to administer contrast agent. More evidence shows that AHVs might reflect the ischemic penumbra [16-19]. Mismatch between the abnormalities in diffusion-weighted imaging (DWI) and SWI represents an acute ischemic penumbra with misery perfusion, and might be a predictor of an impending stroke [20-22]. SWI-DWI mismatch might predict favorable out-comes for patients with ischemia who received intravenous (IV) thrombolysis [23]; however, the value of SWI-DWI mismatch in detecting pen-umbra, as well as the association between it and the outcome for stroke patients who did not receive reperfusion therapy, have not been explored. Thus, in our research, we first intend -ed to assess the ability of SWI-DWI mismatch to evaluate PWI-DWI mismatch in patients who withheld thrombolytic treatment, and to estab-lish a new image analysis method by which to assess the detection value of AHVs for penumbra.
Materials and methods
Subjects
We conducted a retrospective study of 53 patients with acute ischemic stroke who were admitted to People’s Hospital of Zhengzhou University from January 2013 to May 2015. Patients were enrolled if they met the following inclusion criteria: (1) acute cerebral infarction confirmed by DWI; (2) cerebral infarction dis -tributed in the anterior circulation territory and non-lacular infarcts; and (3) stroke MRI proto-col, including DWI, PWI, SWI, and MR angiogra-phy (MRA) performed within 3.0 d of the onset of symptoms. All patients were treated with antiplatelet or anticoagulant therapy. Patients who had undergone thrombolytic therapy or
endovascular treatment were excluded. Stroke severities were evaluated by the National Institutes of Health Stroke Scale (NIHSS) at admission and discharge. A favorable outcome was defined as having a modified Rankin Scale (mRS) of 0-2 at 3.0 months after stroke [23]. We also obtained baseline demographic and clinical information on all patients. Our institu-tional review board approved this study. Because this study was retrospective, informed consent was not required.
MRI protocol
Multimodal MRI was performed using a Sie- mens Magnetom Trio, Tim 3.0 T system (http:// www.siemensmriequipment.com) with comm- ercially available hardware and software. The following sequences were obtained: DWI (TR = 3100 ms, TE = 82 ms, b-value = 1000 s/mm2, acquisition matrix = 128 × 128, FOV = 240 mm, section thickness = 6.0 mm, section gap = 1.2 mm, duration = 48 sec). SWI (TR/TE/flip angle = 27 ms/20 ms/15°, FOV = 240 mm, acquisition matrix = 384 × 32, section thick-ness = 3.0 mm, duration = 3.0 min 27 sec). 3D time-of-flight (TOF) MRA (TR/TE/flip angle = 20 ms/3.2 ms/18°, FOV = 230 mm, acquisition matrix = 256 × 256, section thickness = 0.9 mm, duration = 3.0 min 6.0 sec). PWI (TR = 1400 ms, TE = 32 ms, acquisition matrix = 128 × 128, dynamic scans = 50, FOV = 230 mm, section thickness = 5.0 mm, section gap = 1.0 mm, gadolinium dose = .2 mL/kg, duration = l.0 min 15 sec). PWI data were obtained using an echo-planar imaging sequence after an IV bolus injection of gadodiamide (Omniscan, GE Healthcare, Shanghai, China), which was typi-cally delivered by a power injector through a 22-ga IV line at a rate of 5.0 mL/s with a dose of 0.2 mL/kg. The dynamic image acquisition started 35-40 sec before the contrast agent entered the brain and ended after a few recir-culation passes of contrast agent, with the first pass approximately in the middle of the acquisi-tion. Time-to-peak (TTP) maps were created by post-processing the concentration-time curves for each pixel on the syngo MR workstation. Image analysis
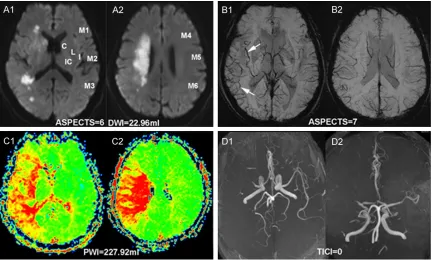
(http://www.siemensmedical.com) for analysis. AHVs were defined as more or larger veins with greater signal loss than those of the contrale-sional hemisphere on SWI. The modified Alberta Stroke Program Early CT Score (ASPECTS) sys-tem, which divided the middle cerebral artery (MCA) territory into 10 regions (Figure 1) [24], was used to grade the degree of AHVs on SWI and the infarction area on DWI. One region equaled one point; all points were summed to calculate SWI and DWI ASPECTS. SWI ASPECTS were divided by DWI ASPECTS to obtain SWI/ DWI. All areas of diffusion and perfusion lesions were measured by drawing regions of interest (ROIs) around the lesions by manual editing on a slice-by-slice basis. DWI lesion volumes were identified as the regions with an intensity high -er than that in the contralat-eral lobe by 3.0 standard deviations (SDs). The perfusion lesion volume was defined as the region with a Tmax delay of 6.0 sec on TTP maps [4]. Volumes were calculated by multiplying overall outlined lesion areas by the slice thickness.MRA was rated
using the modified thrombolysis in cerebral infarction (TICI) score [25]. The vascular steno-sis site was rated using the following assess-ment: 1, internal carotid artery (ICA); 2, proxi-mal middle cerebral artery (MCA), including the M1 segment of MCA; 3, distal MCA, M2 seg-ment of MCA or further branches.
The MRA rating, SWI and DWI ASPECTS were independently assessed by two neurologist (WL Mei and SW Ruan), who were blinded to patient information, except for the clinical his-tory of ischemic stroke. Any disagreement was decided by consultation with a neuroradiologist (YL Li). Two additional neurologists (Y Huang and QX Zhang), who were blinded to the clinical data and other MR findings, measured the dif -fusion and per-fusion lesion volumes.
Statistical analyses
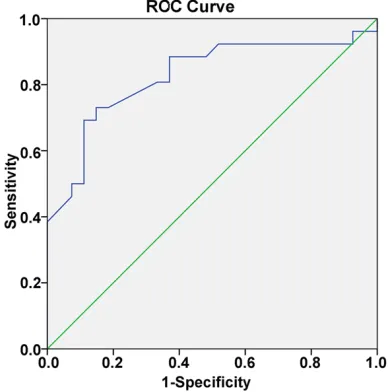
[image:3.612.91.523.71.331.2]measured using Spearman’s rank correlation test. Because the optimal PWI-DWI mismatch, which is defined as both meeting a mismatch ratio of ≥ 2.6 and absolute mismatch of ≥ 10 mL, was better able to detect the beneficial effects of reperfusion, we chose it as the stan-dard model to identify penumbra [5]. We then classified the patients into two groups by opti -mal PWI-DWI mismatch, and used the receiver operating characteristic (ROC) curve to assess the detection ability of SWI/DWI to optimal PWI-DWI mismatch. When the Youden index reached the maximum, the corresponding SWI/DWI was the cutoff value by which to detect the PWI-DWI mismatch. The area under the ROC curve, spec-ificity, sensitivity, and accuracy were also ana
-lyzed. Patients with an SWI/DWI larger than the cutoff value were defined as the SWI-DWI mis -match group, while others were defined as the non-SWI-DWI mismatch group. The clinical and image variables were given as the mean ± SD, median (25th, 75th percentile), or number (per-centage). We used χ2 or the Fisher’s exact test to compare dichotomous variables, two-tailed t-test for normally distributed continuous vari-ables, and the Wilcoxon rank sum test for ordi-nal variables and non-normally distributed con-tinuous variables. A P value less than 0.05 was considered statistically significant. All statisti -cal analyses were performed using SPSS v. 21 (IBM Corp., Armonk, NY, USA).
Results
General
Of the 59 consecutive patients who met the inclusion criteria and were enrolled in our study, 6 were excluded as follows: 1 was lost to follow-up, 4 had received thrombolitic therapy, and 1 had received endovascular treatment. Of the 53 remaining patients who were included in the study, 73.6% were men, the mean age of all patients was 56.21 ± 13.84 years, 8 were con-firmed to have ICA stenosis, 28 had MCA M1 stenosis, 13 had M2 or further branches steno-sis, and 4 had normal arteries. Twenty-five patients had infarction in the right cerebral hemisphere; 28 had infarction in the left he- misphere.
Detection value of SWI/DWI to optimal PWI-DWI mismatch
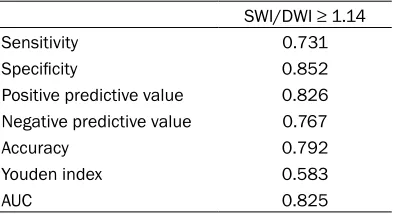
As shown in Table 1, SWI/DWI was positively correlated with PWI/DWI and PWI-DWI mis-match volumes (r = 0.614, P < 0.001; r = 0.401, P = 0.003, respectively). Figure 2 shows the ROC curve of SWI/DWI to detect optimal PWI-DWI mismatch; the area under the ROC curve is 0.825 (P < 0.001). When SWI/DWI was set to 1.14, the Youden index reached the maximum (0.583); therefore, 1.14 was defined as the cut -off SWI-DWI mismatch value for detecting opti-mal PWI-DWI mismatch (sensitivity, 73.1%; specificity, 85.2%; accuracy, 79.2%). The data on the accuracy of SWI-DWI mismatch in detect-ing optimal PWI-DWI mismatch are provided in
[image:4.612.90.287.99.149.2]Table 2.
Table 1. Relationship of SWI/DWI to PWI/DWI and PWI-DWI mismatch volumesa
SWI/DWI (n = 53)
r P value
PWI/DWI 0.614 < 0.001*
PWI-DWI mismatch volumes 0.401 0.003*
Notes: DWI-diffusion-weighted imaging; PWI-perfu-sion-weighted imaging; SWI-susceptibility-weighted imaging. aSpearman’s rank correlation test. *P <
[image:4.612.92.287.221.417.2]0.05.
SWI-DWI mismatch with clinical and radiologic assessment
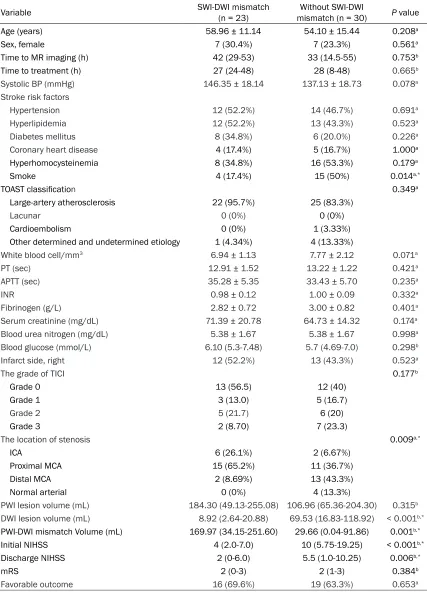
All patients were divided into two groups. Patients with SWI/DWI ≥ 1.14 were defined as the SWI-DWI mismatch group; the remaining patients were defined as the non-SWI-DWI mis -match group. There were no significant differ -ences in mean MR time from stroke onset between the SWI-DWI mismatch and non-mis-match groups (42 [29-53] versus 33 [14.5-55] h, respectively; P = 0.753). There were fewer smokers among the patients in the SWI-DWI mismatch group (17.4 versus 50%, respective-ly; P = 0.014), smaller DWI infarction volumes (8.92 [2.64-20.88] mL versus 69.53 [16.83-118.92] mL, respectively; P < 0.001), and larg-er PWI-DWI mismatch volumes (169.97 [34.15-251.60] mL versus 29.66 [0.04-91.86] mL, respectively; P = 0.001) than in the non-mis-match group. The vascular stenosis sites in the mismatch group were more likely to be at ICA or proximal MCA (P = 0.009); however, there were no significant differences in TICI score (P = 0.177) and Trial of Org 10 172 in Acute Stroke Treatment (TOAST) classification (P = 0.349) between the two groups. Figure 1 shows a rep-resentative MRI of a 68-year-old man with SWI-DWI mismatch.
SWI-DWI mismatch with neurological scores The results of the univariate analysis (Table 3) showed that patients with SWI-DWI mismatch had lower initial and discharge NIHSS (4 [2.0-7.0] versus 10 [5.75-19.25], respectively; P < 0.001; 2 [0-6.0] versus 5.5 [1.0-10.25], respec-tively; P = 0.006) than those without mismatch. For long-term prognosis, patients with SWI-DWI
mismatch appeared to have more favorable outcomes than patients without mismatch at 3.0 months after stroke (69.6 versus 63.3%, respectively); however, the difference was not significant (P = 0.653).
Discussion
Our study proposes a new SWI-DWI mismatch model by which to evaluate the detection value of AHVs for penumbra. Patients with SWI-DWI mismatch were more likely to have ICA or proxi-mal MCA stenosis, sproxi-maller diffusion lesion vol-umes, larger PWI-DWI mismatch volvol-umes, and lower initial and discharge NIHSS scores than those without mismatch. SWI-DWI mismatch was associated with mild or moderate severity of acute ischemic stroke, but its correlation with favorable outcomes was not significant.
[image:5.612.92.290.96.203.2]Multiple AHVs can provide perfusion informa-tion for patients with acute ischemic stroke and the results of many studies have found promi-nently hypointense cortical veins that exceed the area of the DWI lesion and similar to the PWI hypoperfusion region [12, 16, 18, 26]. Based on this, SWI-DWI mismatch was pro-posed and defined as the area differences between the prominent veins on SWI and the infarction lesions on DWI. It not only can indi-cate ischemic penumbra, but also might be a predictor of the onset of stroke [17, 20-22]. Lou et al. [23] found that the presence of SWI-DWI mismatch might identify patients who would benefit from early reperfusion therapy after acute ischemic stroke, and that the accuracy of SWI-DWI mismatch (63.0%) was higher than that of PWI-DWI mismatch; however, none of the studies provided a quantitative method by which to assess the detection ability of SWI-DWI mismatch for penumbra. Meanwhile, the association between SWI-DWI mismatch and the outcomes of stroke patients who withheld thrombolysis has not been determined. We conducted this research on acute stroke patients who had not received reperfusion treatment to evaluate the detection value of SWI-DWI mismatch on PWI-DWI mismatch. Previous literature indicated that the SWI ASPECTS values were best correlated with those of mean transit time (MTT) (r = 0.8, P < 0.001) [20], and that more extensive multiple AHVs on SWI had a smaller diffusion volume (P
Table 2. Accuracy of SWI-DWI mismatch de-tecting optimal PWI-DWI mismatch
SWI/DWI ≥ 1.14
Sensitivity 0.731
Specificity 0.852
Positive predictive value 0.826
Negative predictive value 0.767
Accuracy 0.792
Youden index 0.583
AUC 0.825
Table 3. Univariate analysis of the variables between patients with and without SWI-DWI mismatch
Variable SWI-DWI mismatch (n = 23) mismatch (n = 30)Without SWI-DWI P value
Age (years) 58.96 ± 11.14 54.10 ± 15.44 0.208a
Sex, female 7 (30.4%) 7 (23.3%) 0.561a
Time to MR imaging (h) 42 (29-53) 33 (14.5-55) 0.753b
Time to treatment (h) 27 (24-48) 28 (8-48) 0.665b
Systolic BP (mmHg) 146.35 ± 18.14 137.13 ± 18.73 0.078a
Stroke risk factors
Hypertension 12 (52.2%) 14 (46.7%) 0.691a
Hyperlipidemia 12 (52.2%) 13 (43.3%) 0.523a
Diabetes mellitus 8 (34.8%) 6 (20.0%) 0.226a
Coronary heart disease 4 (17.4%) 5 (16.7%) 1.000a
Hyperhomocysteinemia 8 (34.8%) 16 (53.3%) 0.179a
Smoke 4 (17.4%) 15 (50%) 0.014a,*
TOAST classification 0.349a
Large-artery atherosclerosis 22 (95.7%) 25 (83.3%)
Lacunar 0 (0%) 0 (0%)
Cardioembolism 0 (0%) 1 (3.33%)
Other determined and undetermined etiology 1 (4.34%) 4 (13.33%)
White blood cell/mm3 6.94 ± 1.13 7.77 ± 2.12 0.071a
PT (sec) 12.91 ± 1.52 13.22 ± 1.22 0.421a
APTT (sec) 35.28 ± 5.35 33.43 ± 5.70 0.235a
INR 0.98 ± 0.12 1.00 ± 0.09 0.332a
Fibrinogen (g/L) 2.82 ± 0.72 3.00 ± 0.82 0.401a
Serum creatinine (mg/dL) 71.39 ± 20.78 64.73 ± 14.32 0.174a
Blood urea nitrogen (mg/dL) 5.38 ± 1.67 5.38 ± 1.67 0.998a
Blood glucose (mmol/L) 6.10 (5.3-7.48) 5.7 (4.69-7.0) 0.298b
Infarct side, right 12 (52.2%) 13 (43.3%) 0.523a
The grade of TICI 0.177b
Grade 0 13 (56.5) 12 (40)
Grade 1 3 (13.0) 5 (16.7)
Grade 2 5 (21.7) 6 (20)
Grade 3 2 (8.70) 7 (23.3)
The location of stenosis 0.009a,*
ICA 6 (26.1%) 2 (6.67%)
Proximal MCA 15 (65.2%) 11 (36.7%)
Distal MCA 2 (8.69%) 13 (43.3%)
Normal arterial 0 (0%) 4 (13.3%)
PWI lesion volume (mL) 184.30 (49.13-255.08) 106.96 (65.36-204.30) 0.315b
DWI lesion volume (mL) 8.92 (2.64-20.88) 69.53 (16.83-118.92) < 0.001b,*
PWI-DWI mismatch Volume (mL) 169.97 (34.15-251.60) 29.66 (0.04-91.86) 0.001b,*
Initial NIHSS 4 (2.0-7.0) 10 (5.75-19.25) < 0.001b,*
Discharge NIHSS 2 (0-6.0) 5.5 (1.0-10.25) 0.006b,*
mRS 2 (0-3) 2 (1-3) 0.384b
Favorable outcome 16 (69.6%) 19 (63.3%) 0.653a
Notes: APTT-activated partial thromboplastin time; BP-blood pressure; DWI-diffusion-weighted imaging;ICA-internal carotid
artery; INR-international normalized ratio; MCA-middle cerebral artery; MR-magnetic resonance; mRS-modified Rankin Scale;
NIHSS-National Institutes of Health Stroke Scale; PT-prothrombin time; PWI-perfusion-weighted imaging; SD-standarddeviation; SWI-susceptibility-weighted imaging; TICI-thrombolysis in cerebral infarction; TOAST-Trial of Org 10 172 in Acute Stroke Treat-ment. Date are presented as the mean ± SD, median (25th, 75th percentile) or n (%). aTwo-tailed t test or χ2. bFisher’s exact
< 0.001) and larger PWI-DWI mismatch (P < 0.001) [16]. This inspired us to speculate that SWI/DWI might be an excellent candidate for indicating PWI-DWI mismatch. Our current research showed that SWI/DWI is positively correlated with PWI/DWI and PWI-DWI mis-match volumes. This outcome provided us with the basis for the subsequent research. Next, we found that the area under the ROC curve of SWI/DWI to optimal PWI-DWI mismatch was relatively large (0.825), and that the cutoff SWI/ DWI of 1.14 was also highly accurate (79.2%) to the optimal PWI-DWI mismatch. All of these results indicated that SWI-DWI mismatch has the ability to detect penumbra.
Our current study showed that patients with SWI-DWI mismatch were more likely to have ICA or proximal MCA stenosis, smaller diffusion vol-umes, and larger PWI-DWI mismatch volvol-umes, which were consistent with the results of previ-ous studies [16, 20]. The explanation of these findings is that when a large brain-supplying artery is occluded, CBF decreases and oxygen in the supplying area is disrupted. To keep the cerebral metabolic rate of oxygen stable, more deoxyhemoglobin is generated from oxyhemo-globin to release more oxygen into the tissue; the ratio of deoxyhemoglobin to oxyhemoglobin is increased in ischemic cerebral tissue with PWI-DWI mismatch and AHVs appear [16]. If the hypoxic tissue has been reperfused on a timely basis, it might revive and AHVs might return to normal. If not, the infarction lesion is more likely to enlarge [13, 27]; therefore, SWI-DWI mismatch, which is based on the presence of AHVs, is a useful indicator of PWI-DWI mismatch.
As is related to the association between SWI-DWI mismatch and neurological scores, we found that patients with SWI-DWI mismatch were more likely to have lower initial and dis-charge NIHSS scores. Their stroke severities on admission and at discharge were more mild or moderate than that of patients without DWI mismatch. For long-term prognosis, SWI-DWI mismatch did not show a significant rela -tionship with favorable outcomes. Some might argue that DWI volume has a positive correla-tion with NIHSS scores [28] and that a lower initial NIHSS score was a strong predictor of a favorable outcome [29]; however, this phenom-enon was not seen in patients with SWI-DWI
mismatch. As mentioned, extensive AHVs seen on SWI are associated with ipsilateral large-artery stenosis and severe hypoperfusion. PWI-DWI mismatch, which directly assesses penum-bra, has been shown in a number of studies to be associated with a higher risk of infarction growth [30, 31].Compared with PWI-DWI mis-match, Kao et al.’s [20] results revealed that SWI-DWI mismatch had a similar capability of predicting the onset of stroke, which implies a close association between cerebral OEF and MTT. A retrospective study of 24 children also showed that a mismatch between vascular ter-ritories with SWI hypointense venous signal and restricted diffusion is significantly associ -ated with infarct progression in pediatric arte-rial ischemic stroke [17]; therefore, SWI-DWI mismatch is an effective predictor for stroke evolution. In addition, the quality of collaterals is a key factor that influences the prognosis of stroke [32]. Verma et al. [19] showed that extensive prominent cortical veins correlated with poor leptomeningeal collateralization, while less pronounced prominent cortical veins correlated with good leptomeningeal collateral-ization (P = 0.039); therefore, for patients with SWI-DWI mismatch who did not receive reper-fusion therapy, the incidences of stroke evolu-tion and recurrence were higher than that in patients without mismatch, and this risk might influence the prognosis of such patients. Timely reperfusion therapy, such as thrombolysis or endovascular treatment to reconstruct blood flow, is crucial for patients with SWI-DWI mismatch.
in these patients. The reason was that most patients were transferred from another hospi-tal and had missed the window of thrombolysis time when they reached our clinical center. Such status limited us to collecting enough patients who received reperfusion therapy to further our research.
In conclusion, SWI-DWI mismatch is an effec-tive method by which to evaluate the detection value of AHVs to penumbra. It is related to ICA or proximal MCA stenosis, misery perfusion, smaller diffusion lesion volume, and mild or moderate NIHSS but not favorable outcomes for patients with acute ischemic stroke who did not receive thrombolysis. It might be useful for selecting suitable patients who need reperfu-sion therapy.
Acknowledgements
This research was supported by State Key Clinical Specialty Construction Project (2012) and the Science & Technology Project of Henan Province (grant 162102310295). We are grate-ful for the support from our patients. The au- thors thank Zhiwei Xu, MD, from the Department of Prevention and Health Care, People’s Hos- pital of Zhengzhou University, for the verifica -tion of statistics.
Disclosure of conflict of interest
None.
Address correspondence to: Dr. Jiewen Zhang, De- partment of Neurology, People’s Hospital of Zh- engzhou University, 7 Weiwu Road, Zhengzhou 45- 0003, Henan, P. R. China. Tel: +86-0371-65897586; Fax: +86-021-64085875; E-mail: hnsrmyyzhangjw- @126.com
References
[1] Feigin VL, Forouzanfar MH, Krishnamurthi R, Mensah GA, Connor M, Bennett DA, Moran AE, Sacco RL, Anderson L, Truelsen T, O’Donnell M, Venketasubramanian N, Barker-Collo S, Lawes CM, Wang W, Shinohara Y, Witt E, Ezzati M, Naghavi M and Murray C. Global and
region-al burden of stroke during 1990-2010: findings
from the Global Burden of Disease Study 2010. Lancet 2014; 383: 245-254.
[2] Fisher M and Bastan B. Identifying and utilizing the ischemic penumbra. Neurology 2012; 79: S79-85.
[3] Jung S, Gilgen M, Slotboom J, El-Koussy M, Zubler C, Kiefer C, Luedi R, Mono ML, Heldner MR, Weck A, Mordasini P, Schroth G, Mattle HP, Arnold M, Gralla J and Fischer U. Factors that determine penumbral tissue loss in acute isch-aemic stroke. Brain 2013; 136: 3554-3560. [4] Olivot JM, Mlynash M, Thijs VN, Kemp S,
Lans-berg MG, Wechsler L, Bammer R, Marks MP and Albers GW. Optimal Tmax threshold for predicting penumbral tissue in acute stroke. Stroke 2009; 40: 469-475.
[5] Kakuda W, Lansberg MG, Thijs VN, Kemp SM, Bammer R, Wechsler LR, Moseley ME, Marks
MP and Albers GW. Optimal definition for PWI/
DWI mismatch in acute ischemic stroke pa-tients. J Cereb Blood Flow Metab 2008; 28: 887-891.
[6] Nagakane Y, Christensen S, Ogata T, Churilov L, Ma H, Parsons MW, Desmond PM, Levi CR, Butcher KS, Davis SM and Donnan GA. Moving
beyond a single perfusion threshold to define penumbra: a novel probabilistic mismatch defi -nition. Stroke 2012; 43: 1548-1555.
[7] Haacke EM, Mittal S, Wu Z, Neelavalli J and Cheng YC. Susceptibility-weighted imaging: technical aspects and clinical applications, part 1. AJNR Am J Neuroradiol 2009; 30: 19-30.
[8] Haacke EM, Xu Y, Cheng YC and Reichenbach JR. Susceptibility weighted imaging (SWI). Magn Reson Med 2004; 52: 612-618.
[9] Santosh C, Brennan D, McCabe C, Macrae IM, Holmes WM, Graham DI, Gallagher L, Condon B, Hadley DM, Muir KW and Gsell W. Potential use of oxygen as a metabolic biosensor in
combination with T2*-weighted MRI to define
the ischemic penumbra. J Cereb Blood Flow Metab 2008; 28: 1742-1753.
[10] Jensen-Kondering U and Baron JC. Oxygen im-aging by MRI: can blood oxygen level-depen-dent imaging depict the ischemic penumbra? Stroke 2012; 43: 2264-2269.
[11] Tsui YK, Tsai FY, Hasso AN, Greensite F and Nguyen BV. Susceptibility-weighted imaging for differential diagnosis of cerebral vascular pa-thology: a pictorial review. J Neurol Sci 2009; 287: 7-16.
[12] Mittal S, Wu Z, Neelavalli J and Haacke EM. Susceptibility-weighted imaging: technical as-pects and clinical applications, part 2. AJNR Am J Neuroradiol 2009; 30: 232-252.
[13] Kesavadas C, Santhosh K and Thomas B. Sus-ceptibility weighted imaging in cerebral hypo-perfusion-can we predict increased oxygen ex-traction fraction? Neuroradiology 2010; 52: 1047-1054.
susceptibility-weighted imaging in ischemic stroke. World J Radiol 2013; 5: 156-165. [15] Huang P, Chen CH, Lin WC, Lin RT, Khor GT and
Liu CK. Clinical applications of susceptibility weighted imaging in patients with major stroke. J Neurol 2012; 259: 1426-1432.
[16] Park MG, Yang TI, Oh SJ, Baik SK, Kang YH and Park KP. Multiple hypointense vessels on sus-ceptibility-weighted imaging in acute ischemic stroke: surrogate marker of oxygen extraction fraction in penumbra? Cerebrovasc Dis 2014; 38: 254-261.
[17] Polan RM and Poretti A. Susceptibility-weight-ed imaging in pSusceptibility-weight-ediatric arterial ischemic stroke: a valuable alternative for the noninva-sive evaluation of altered cerebral hemody-namics. AJNR Am J Neuroradiol 2015; 36: 783-788.
[18] Kim YW, Kim HJ, Choi SH and Kim DC. Promi-nent hypointense veins on susceptibility weighted image in the cat brain with acute in-farction: DWI, SWI, and PWI. Acta Radiol 2014; 55: 1008-1014.
[19] Verma RK, Hsieh K, Gratz PP, Schankath AC, Mordasini P, Zubler C, Kellner-Weldon F, Jung S, Schroth G, Gralla J and El-Koussy M. Lepto-meningeal collateralization in acute ischemic stroke: impact on prominent cortical veins in susceptibility-weighted imaging. Eur J Radiol 2014; 83: 1448-1454.
[20] Kao HW, Tsai FY and Hasso AN. Predicting stroke evolution: comparison of susceptibility-weighted MR imaging with MR perfusion. Eur Radiol 2012; 22: 1397-1403.
[21] Fujioka M, Okuchi K, Iwamura A, Taoka T and Siesjo BK. A mismatch between the abnormal-ities in diffusion- and susceptibility-weighted magnetic resonance imaging may represent an acute ischemic penumbra with misery per-fusion. J Stroke Cerebrovasc Dis 2013; 22: 1428-1431.
[22] Luo S, Yang L and Wang L. Comparison of sus-ceptibility-weighted and perfusion-weighted magnetic resonance imaging in the detection of penumbra in acute ischemic stroke. J Neuro-radiol 2015; 42: 255-260.
[23] Lou M, Chen Z, Wan J, Hu H, Cai X, Shi Z and Sun J. Susceptibility-diffusion mismatch pre-dicts thrombolytic outcomes: a retrospective cohort study. AJNR Am J Neuroradiol 2014; 35: 2061-2067.
[24] Barber PA, Demchuk AM, Zhang J and Buchan AM. Validity and reliability of a quantitative computed tomography score in predicting out-come of hyperacute stroke before thrombolytic therapy. ASPECTS Study Group. Alberta Stroke Programme Early CT Score. Lancet 2000; 355: 1670-1674.
[25] Higashida RT, Furlan AJ, Roberts H, Tomsick T, Connors B, Barr J, Dillon W, Warach S, Broder-ick J, Tilley B and Sacks D. Trial design and re-porting standards for intra-arterial cerebral thrombolysis for acute ischemic stroke. Stroke 2003; 34: e109-137.
[26] Meoded A, Poretti A, Benson JE, Tekes A and Huisman TA. Evaluation of the ischemic pen-umbra focusing on the venous drainage: the role of susceptibility weighted imaging (SWI) in pediatric ischemic cerebral stroke. J Neurora-diol 2014; 41: 108-116.
[27] Baik SK, Choi W, Oh SJ, Park KP, Park MG, Yang TI and Jeong HW. Change in cortical ves-sel signs on susceptibility-weighted images af-ter full recanalization in hyperacute ischemic stroke. Cerebrovasc Dis 2012; 34: 206-212. [28] Fink JN, Selim MH, Kumar S, Silver B, Linfante
I, Caplan LR and Schlaug G. Is the association of National Institutes of Health Stroke Scale scores and acute magnetic resonance imaging stroke volume equal for patients with right- and left-hemisphere ischemic stroke? Stroke 2002; 33: 954-958.
[29] Yamamoto N, Satomi J, Izumi Y, Yamamoto Y, Yamaguchi I, Furukawa T, Nagahiro S and Kaji R. Predictors of a Favorable Outcome after Re-canalization in Patients with Cerebral Major Vessel Occlusion. J Stroke Cerebrovasc Dis 2015; 24: 2793-2799.
[30] Schaefer PW, Hunter GJ, He J, Hamberg LM, Sorensen AG, Schwamm LH, Koroshetz WJ and Gonzalez RG. Predicting cerebral ischemic in-farct volume with diffusion and perfusion MR imaging. AJNR Am J Neuroradiol 2002; 23: 1785-1794.
[31] Kane I, Sandercock P and Wardlaw J. Magnetic resonance perfusion diffusion mismatch and thrombolysis in acute ischaemic stroke: a sys-tematic review of the evidence to date. J Neu-rol Neurosurg Psychiatry 2007; 78: 485-491. [32] Shuaib A, Butcher K, Mohammad AA, Saqqur