Int.roduetion:
(N, 0ohnson)
f YHE [{CONOb,}~C
i AND SOCb~,!~ I
a ~’q~,W<’i,g,~.>d~]L, OW~ SERIES t
f,,,<,. 3 <--,
" " I’I
The Grow[.]~ el ]~,!oder,. Dublin
4
Urban eco!ogisLs(1) describe the usual process of a city’s growth in terms of a eentri_[ugat process. The conI:inuous pressure of migrant popul.a~ion on central city accommodati.on causes the ~"esidents to move to the periphery of the ei.ty in order to cseape the eneroaehing slums. Thin process of invasion and sueeession continues with the areas of
over-crowding besom.lag more widespread and tl~e built up area more extensive as more residents h.ave to move further out to a salubrious envi:eonment.
The spatial expm.~sio.~, of 13ubU.:~, began i~ the middle of tke nineteenth century. "Nearly aH the expansion wan upper to mJdd!e--elass
res]den.tial: as the slum families, house? h~ georgian times in muo-huts and ’weavers’ houses’, slowly moved into the grand streets of ~t~e ~mrth side,
,o
the professional elasse,’~ moved out to Ballsbrid,3e, ]:]aneiagh and 19athmines. ’’(~)
However, the deereasein tram and rail fares at the turn of the eentury openeci
up the townl.ands and suburbs to the lower middle eh?,sses and sinee 1900, ti~_e e!~y boundaries have been ex~ended four t[rnes to take aeeount of the large increases
in t:his urban population. In the last.fifteen years, sines the introduetion of the
first Eeonomie P.-rogramme with its increased investment and employment for the city, and eoneomitant surge in public and private house building, the surrouno,qg
. __:___~ ,.___.~_t~tt_!,_,s )~: middle etass vil]as.’’(3) e._ot~}l[~ZEs id e ]m s bee~)__~2"_a nsformed ’"by ’~,," "- ~ ’’ ~ ~
* I wish to tha~J< Professor ]3. ~ .,.,a,.- ... ,1,m~,~m,,:,oa ... D~.~. II. C ~,~,vy for their ,,,,I,~,~.~. ,,~ ... erit:ieisms and ]?e, ter Neary for eor~duc.l:ing’ the st:atistieal, anal.ysis in this paper. I am a!so indebted to a number c,,[ officers in ~he Dubl.in Corporation for their
generous ass{_stanee.
(_ -:_, )
(]) ’~. \V. ]3urgess, ’Phe Growth el the~ Ci{:3~, 195>9L lIoyt, The Structure and G_~’ov,;th of ]{(-mJ.d("~l.ial N~~i,~,JfJ’o,r]~oods in :’kmemc0..n Ci!:ies (WsshinpjtorJ. 1939), in. D. W. O. Thnms. The Urban h’Josaio Carabvidge University Pt’ess, 1971.. (2) ]X{, .,r,’-ng ]:)ub!in 1.6G0 .-. ]860. The Cressei: Press London t95Z p. 302. (3) J. Meenan. The Ci{>, of ]3uMin "A View o.[ ]cc4,.<~nd"’ ed. ,7. Meem-~’, and
the south, in the County, where the population has increased at substantial rates. However in the last couple of decades the population of the Co. Borough has fall&~, exc’ept iii 1961-66. (Table 1), due to the continuous decrease in
inhabitants of the central city wards. With negiigible exceptions the population
Table 1
Percentage Change in Population
1951-1956 1956-1961 1966-1971
Dublin County Dublin Co. Borough
26 Counties
+26.5 -2.2 -2.1
+12.8
- 0.4
-.2.8
I
1961-1966+31.1
+ 5.8
+ 2.3
+24.8 -0.3 ÷3.0
Source: Census of Population.
of this area has declined throughout the century, as the process of slum clearance continues and the ore<crowded tenements are replaced by office blocks, so reducing available dwellings.
z
For this reason in spite of laz~ge inflows of population into the city the net in-migration figures for the intercensal period 1961-1966 were small at 4.6 per 100 for males and 3.0 per100 for females. Apart from
age groups 5-9 and 25-34, which possibly reflects the movement of families. expecting their second or third child to the suburbs, all age groups experienced some net in-migration though the rate was only significant among females aged 15-19 and these aged 65 years and over.
The Co. Borough is composed of an assortment o[ districts dilfering in date of development, t’ype of dwelling, population struc[.ure,
and conjugal. . status to name a few facel:s. These mver.~e’" ¢~ c]mracteristics give rise
0
movements more fully and ascertain any patterns of migration within tileCo. Borough, net migration rates were estimated for the forty-two wards of the Co. Borough(4) (the smallest territorial division for which statistics are published) for the period 1961-1966, which were the latest figures available.
An attempt was made to devise a grouping of the wards based "on objective statistical eriterff~, but the results were not satisfactory. See Appendix A.
Instead for the purpose of analysis the wards were divided into the following zones, on the basis primarils/of the age distribution of their housing and type of tenancy.
i. Zone 1 includes the eight wards of Ballyfermot, Finglas, West and East,
o
So
.
Artane, 1Ratlffarnham South, Santry, Coolock, post-war housing estates.
Zone II includes 14 central city wards, Arran Quay, City, 1Rotunda, Mountjoy, Ballybough, North Dock,
and I~aheny, all areas of
Inns Quay, North
Usher’s Quay, Merchant’s Quay, Wood Quay, St. Kevin’s Royal Exchange, Mansion House, South Dock,
(Phoenix Park is not included).
Zone III, loosely asso.ciates eight wards, Crumlin, Kimmage, Kilmair2aam, Cabras East and West, Drumcondra Nortll, Crumlin West, Baldoyle.
t
Zone vI, includes eleven wards, Pembroke East and West, I~athmines East and West, Glasnevin, Drumcondra South, Clontarf East and West, I~athfarnham, Terenure.
The divisions are fairly arbitrary but do help to g~ve a more concise picture of the population with its ebbs and flow.~ within tim Co. Borough- 1. The large movement into the central city of young single people in 15-24 age group; 2. The considerable movement of young marrieds to the new housing estates on the city periphery; 3. The high incidence of old and widowed people in the central city wards and their absence in areas of new (4) i~igration figures were arrived at by estimating the num:ber of survivors in 1966 from the 196] population - "~he survival ratio meLhod". Survival rates by age group for the five year interval 1961-1966, based on 3.961 urban life table
@
housing; 4. The vast numbers of children in these later areas; 5. Thehigh percentages of unmarried males and females in certain areas and the predominantly married population of others.
The future development of Dublin according to the official plan lies westwards around the towns of Clondalkin, T~llaght and Blanchardstown, while recently a plan for a new self-contained town north
of Dublin Airport was submitted by a group of private developers to the Corporation. However, the decay of central city areas with its piecemeal office development is now causing concern to a growing vocal body Who fear that Dublin, like so many metropolis may become like a ’ghost’ city with little or no resident population. However in November 1972 the Corporation
announced plans for the redevelopment of a 5-acre central city site with shopping, office and other amenitie~ to be undertaken by a private concern.
Though this particular scheme, located in Moore S~reet, does not include any residential aceon~modation, yet 200 flats were recently completed by the Corporation in nearby Dominick Street and its spokesman announced that there were plans for about 800 newflats in the vicinity of the city centre area. In ~arch, details of the country’s biggest commercial and residential develop-ment located beside the Grand Cnnai were released. These schemes and others are indicators possibly that urban renewal on a large scale has commenced .. in Dublin.
Zone 1
introduction
This zone includes eight wards of Dublin Co. Borough
(5)
in which at least 75 per cent of the dwellings were constructed after 1945, namely: Ballyfermot, Finglas West, Cooloek and Ratlffarnham South, (in 1961.
®
(5)
predominantly Corporation housing areas) , and Santry, Artane, Raheny and Finglas East, (largely privately developed housing areas, the majority of which in 1961. were in owner occupation ,). (6) House sizes were about
average for the County Borough with at ].east 97 per cent of the dwellings
(7)
consisting of 4 or 5 "habitable" rooms, apart from I~,aheny, Sanity and Artane
r
(7)
where over two thirds of the dwellings had 6 or 7 "habitable" rooms.
Households were large. The average number of persons per household was above the Co. Borough average of 4.01 persons while population densities were low (Table 2). Ballyfermot experiencing the highest number of persons per acre at 28.8. This development was commenced in 1948 and completed eleven years later with a total of 3, 192 cottages. Further house building may still be undertaken in the other seven wards, and as the majority of their populations is still at the first stage of the family cycle, additional children may be expected to increase their densities. The average size of the Corporation cottage has also been increasing, as the immediate problem of rehousing slun] dwellers has eased and the knowledge and experience gained from the first housing developp~ents has been implemented in l’ater schemes. In the Crumlin development, completed
(8)
in 1945, 35 per cent of the cottages had three rooms and 65 per cel{t four rooms.
" (8)
In Ball~ermot about 80 per cent had four rooms while i,a the Kilbarrack scheme, completed in 1971, 52 per cent of houses have five rooms. (8) Apart from
I3ally-fermot and Rattffarnham South which lie to the South \Vest of the City, all wards are on the northern periphery of the Co. Borough, Since 1961 there have been
extensive housing developments in those wards bordering the northern Co. Borough boundary, in particular Artane, Coolock and Itaheny, where large corporation and private estates have been comPleted.
(6) Census 1961 - Vol. VI and Table 18. (7) . Census 1966 - Vol, VI Table ]1.
®
Population CharacteristicsThis Zone covers an area of increasing population, well above the Co. Borough average rate of increase as is shown in Table 2. However, there are very large differences ill the rates of increase between the various wards, giving an indication of the areas in the process of
development during the intercensal period under study. Coolock and I{aheny
Table 2
Population Changes 1961-1966 and Population Densities 1951-1966 Percentage Numbers of
Wards increase in 1951 l 1956
population
Artane +77.5 1.7+ 4,5
Coolock +91.8 2.5
Finglas East +22.5 6.0+ 13,4
Finglas West +59.4 0.6+ 4,7
I~aheny +90.3 3.0 5.6
Santry +70.2 0..i+ 5:9
Ballyfermot +6.3 II. 2+ 24.9
lffatbfarnham South +5.7 4,4+ 18.6
Dublin Co. Borough +5.8 23,8 18,9
Persons per acre 1961
6.9 9,7 17.8 11.4 9,5 I0,2 27,0 23.2 18.8
1966
12.3 18.7 21.8 18.2 18.0 17.4 28,8 24.5 19.9
* In 1956 nine new wards were created and 3 altered, hence the large decrease in number of persons per acre in the Co. Borough.
+ 1951 figures are for comparable areas that were created wards in 1956. Source: C.P. 1956 Table 6, 1966 Vol. I. Table 11.
nearly doubled their 1961 populations; in Artane and San try the populations
were up by about three quarters: In the remaining wards 0[:<Bat[~4ermot, llathfarnham South, FJnglas East and West, the major developments occurred at earlier periods as the figures for population densities indicate though even here the rates of population increase were at least up to the average for the
of the sources of these population changes. It is evident from Table 3 that the highest rates of overall in-migration, male and female, occurred in
Cooloek and llaheny. In Artane and Santry, a third and a quarter, respectively, of the total population were in-rnigrants in 1966. The two ren~aining wards,
Ballyfermot and Ratlffarnham South were by contrast areas in which net-out-migration occurred.
Table 3
Net In-Migration Rate per 100 ~ean Population 1961-1966
ward A~’tane Coolock Finglas East Finglas West Raheny Santry Ballyfermot Ratlffarnham South Age Group* 15-19 Male Female
(a)
-35.4 28.0 31.4 30.8 -0.6 -0.9 10.8 119.0 27.4 : 52.9¯ 36.3 t 29 6i ’
i
-10.2 -11.3 -9.4 -4.0
Dublin Co. Borough 3.5 13.7
Age Group* 20 -24 Male Female
(b)
21.9 60.2 42.0 61.1 5.8 -3.0 I0.9 -2.234.4
6013
65.7 90.7 -14.0 -26.1 -18.4 -28.4 8.8 7.2 Age Group* 25-29 Male Female(c)
114.6 109.2 135.5 124.0 46.7 41.5 83.3 85.7 115.4 101.7161.8 111.5
24.7 14.0 5.1 -29.8- 2.0 ,-15.1
Total Population
Male Female
(d)
32.8 33.0 42.1 41.4 8.3 ~,9 28.1 25.8 39.4 38.5 28.4 28.2 -2.3 -4.6 0.44.6 3.1
~)asic Source: CP 1961 Vol. II Table 141966 Vol.ll Table 4. * Ages in 1966.
= net out-migration.
A study of the in-migration rates of the individual age groups shows that the highest rates occurred among those aged 20-24 and 25-29 years. Itigher rates occurred in the latter group 25-29, but is is interesting to note that in the age group 20-24, in most wards the female net in-migration rate was notably higher than i:he male (though not in the County Borough as a whole).
25-29 tile tendency disappears, to give way to a slight dominance of male in-migration, though the similarity between the male and female rates in this group is remarkable. The inflow cf population aged 15-19, in 1966 which reflects the movement of adolescents with their families to those new housing estates would indicate that Dublin girls remain longer with their families than those from the remaining 26 counties. (9)
In fact the high rates of female in-migration of those
aged 15-1.9 probably is explained by the feasibility and conveniences of working in the central city areas as shop assistants, clerks etc. where jobs are
numerous, and continuing to live at: home, which a country girl is unable to do. The inflow in the older ages more ].i]~ely represents themovementb{, young married coupled into their new homes. The dominance of females in the younger 20-24 groups and males in the older 25-29 groups results from their different ages at marriage. In 1969 tim media>, age at first marriage of
(10) brides was 23.8 years and of grooms 2G. 0 years.
Rates of in-migration are exceptionally high in the 20-24 and 25-29 age groups, in parts of the wards of Coolock, Artane, Rahen~ and Santry, largely accounted for by building development. In the first, 896 dwellings were completed by the CorporaLion in the Coolock-I~aheny estate during the ’fifties; the Edenmore estate of 654 dwellings was constructed
during the ’sixties. Large scale private developments have also occurred since 1963, including the extensive Kilbarrack scheme now being completed by private contractors for Corporation tenants. In Artane, the enormous
Coolock-Kilmore development, under construction during the ’sixties, when completed in 1968 comprise(i 2, ’707 dwellings. In. the remainig wards of
i~.
Santry and I~aheny, large amounts of private housing development have occum’ed
J
since 1959, the latter ward also including part of the Kilbarrack scheme.
(9) I~. C. Ocary and J. ,., ’-~. Irughcs found that fernai.es born outside Dub!i",, County and :Borough enter the city at an earlier age, than males, bu~ as regards Dublin born, women seem to emigrate at later ages than men. ESRI, Paper No. 54, Internal h¢igration in h’cl.q~,~d, Dublin 1.970, p. 1.4.
(10) Dr. Brcndan Wal:-~h, "Trends in Age at Marriage in post--war h:eland" D en~ography, Vol. 9, No.2, ~]iay 1972.
,4
O.
Thus, these building activities explain the large inflow of population, into these wards and in particular of those aged 20.-29, the ages in which the majority of persons marry and start families. (10) In contrast, netout-migration o-ccurring in ]3allyfermot and Ratlffarnham South (in the age group 20-24) resulted in more than a quarter of the female population of that group
r
leaving, together with a substantial proportion of males. Slight out-migration of females aged 20-24 also occurred in Finglas East and West. In the older group 25-29, well over a quarter of the female population left Rathfarnham South.. These movements of young people out of these four wards reflect
the stage in the family cycle arrived at in the various housing estates.. Corporation housing allocations commenced in the Ballyfermot area in 1.948, in Finglas West in 1951, Finglas East in 1952 and in Rathfarnham South in 1954. Thus, these areas have been well settled for over a decade; and, apart from vacancies on the estates, an inflow or large changes of population size
would not be expected. Also in 1966 the children of the original estate dwellers would be in their teens or older and hence would have left home, in search of jobs, on marriage or to emigrate, as the migration estimates ~-efleet. In age group 15-19 there are small rates of out-migration in Ballyfermot,
RatlffarnhamSouth, and Finglas East. (Table 3(a)). However, in Finglas West where house allocations were still being made in 1965, 19 per cent of females and II per cent of males, accompanied their families into their new Corporation homes. It is interesting to note that the in-migration rates for this age group are highest in the areas of private housing, namely Raheny, Santry and also Coolock, which is a fairly ’mixed’ area - perhaps a reflection of the behaviour patterns of different social classes, where the children living in ’private’
neighbourhoods, tend to stay at home longer than those from Corporation areas (1.1)
(11) From a sample of 2, 540 Dublin adult males in 1968 it was shown that: the higher his father’s social status, the older a boy when he tool{ his first
@
Conjugal Status [image:10.577.43.520.38.584.2]The percentage single of the population, for the individual wards of Zone 1 was expressed as a proportion of the mean Dublin Co. Borough percentage single (Table 4).
TABLE 4
PERCENTAGE OF POPULATION 15 YEARS AN]_] OVER, SINGLE IN 1966 AS A PROPORTION OF MEAN I)UBLIC PERCENTAGE SINGLE,
BY WARD
Ward
Ballyfermot Finglas West Finglas East Artane
Ratldarnham South Santry
Coolocl.< tlaheny
Source: C.P.
Male
0.93 0.71 0.76 0.53 0.88 0.46 0.64 0.49 1966 Vol. II Table 14.
Female
0.82 0.66 0.66 0.45 0.82 0.46
0.60
0.56
The three wards with particularly small single populations, Artane, Raheny and Santry, are areas of more recent housing developments
titan those in the remaining wards. Figures for ward densities show that, bei:ween 1961-1966, the number of persons per acre doubled in Artane and well below the average for Dublin Co. Borough; and in particular the wards
of Artane, Santry and Raheny have single populations rnarkedly below average. This is not unexpected since as already discribed, Zone 1 is an area of recent large-scale house building. In general single people do not purchase houses for their own occupation - particularly on the periphery of the city and the
Corporation does not usually allocate houses to umnarried tenants, hence a sizeable single population would not be anticipated.
®
I~aheny, and increased by 70 per cent in Santry. The major density increasesin the remaining wards as mentioned previously occurred earlier. (Table 2)
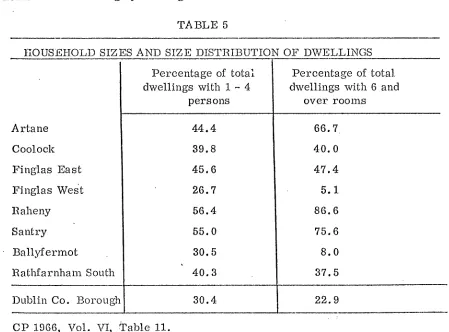
These three Wards also contain fairly large private residential areas and have larger houses a,~d smaller households than the
others (Table 5). In this first stage of the family cycle, as the majority of families must be, the number of children in the households is as yet relatively
small in Raheny and Santry and very young. In the three wards few families would include 15 year olds and over. For in spite of large i[fflows of these
young people aged 15-19 no doubt accompanying their parents to these new housing areas, (Table 3(a)) the percentage of population in that age group in these three wards is the smallest for the Zone (Table 7 (b)). This explains their small single populations in comparison to the remaining more settled wards, whose single populations are inflated by the much larger percentage aged 15-19 (Table 7 (b)). Finglas East, due to its large number of 1 or 2 person
[image:11.577.89.538.459.791.2]house-holds also has a large percentage of small househouse-holds.
TABLE 5
IIOUSEHOLD SIZES AND SIZE DISTI~IBUTIOI’; OF DWELLINGS
Artane Coolock Finglas East Finglas West 1~ a h e ny Santry Ballyfermot
Percentage of total dwellings with 1 - 4
persons 44.4 39.8 45.6 26.7 56 4 55 0 30 5
Percentage of total dwellings with 6 and
over rooms
66.7 40.0 47.4 5.1 86.6 75.6 8.0
l~athfarnham South 40.3 37.5
Dublin Co. Borough 30.4 22.9
CP 1966, Vol. VI, Table II.
However, as the migration figures would suggest, this Zone has a very large married population, particularly in age groups 25-34:.
@
TA BLE 6Percentage of Population Aged 15 Years and Over Married in 1966
Age 20-24* Age 25-29 Age 30- 34 as % of mean Dublin Ward
Male Female Male Female Male Female Age 25-34 Male Female
(a)
(b)
(c)
" (d)
Artane 22.3 56.5 84.5 92.3 93.2 94.4 ].46.5 144.1
Cooloek 26.3 51.8 86.7 89.0 95.1 94.1 148.8 141.2
Finglas East 15.9 33.8 68.6 81.6 89.2 91.7 132.0 134.2
Finglas West 23.9 38.3 78.9 90.3 95.2 95.7 145.3 144.1
Raheny 16.2 36.3 77.7 85.3 93.7 93.5 143.8 138.6
Santry 29.8 57.7 84.8 92.2 94.3 94.1 147.8 143.7
Ballyfermot 21.2 33.0 68.6 81.2 89.5 90.4 130.5 12.3.0
ltathfarlflmm
South 12.1 18.9 41.0 61.5 88.9 89.7 106.6 108.9
Dublin Co.
22.6 58.4 71.4 72.0
:Borough 13.8 51.7
Column (d) of Table 6 shows that, as a whole~ the Zone has a percentage of population married in age group 25-34 well above the Co. Borough average. In particular Coolock, Artane, Santry, Finglas West and Raheny (for men) have a proportion married markedly above the average. The explan-ation is of course inherent in the nature of the areas contained within the wards. All were developed for the express purpose of relieving the acute post-war
housing shortage. The Corporation developments were principally aimed at rehousing the tenement dwellers of the central city wards, while the privately-developed housing estates catered for the large increase of population in Dublin and its environs since 1958. This growth in population is due partly to a fall in emigration from the city, partly to the huge inflow of migrants into the city,
O
,least four years’ residence in Dublin. Hence, migrants from the ren-aining4 26 counties who require municipal housing must first take rooms or flats for this period, if they can afford it, probably in tl~e more dclapidated and
crowded innner.-city wards. Also the worse the eonditic’n of the buildings the sooner are these migrants likely to be rehoused, as priority in house allocations is given to those residents of dangerous or eor, de]nned buildings.
Similarly in the private sector, not many people in tim younger married age-groups can immediately afford to put down a dcposil:, hence they too must rent flats, possibly in converted houses in the older m~burban areas until tl}ey have saved enough to |put down’, and so move out to the new suburbia. The five wards, Cooloek, Artane, Santry, Finglas West and Raheny, have the more exceptionally large married population as these included, in 1966,
the more recent areas of development, and their populations would be generally in the first stage of the family cycle, with a small proportion in the very yo.ung
and very old age groups.
Age Dis ! ribution
still furl:her, of Zone 1.
Figures for age-structure of the population, clarifying the picture
show the large imbalance of the population structure of the wards
TABLE 7
PERCENTAGE OF POPULATION IN AGE GROUPS IN 1966 AS A PROPORTION OF TIIE MEAN DUBLIN PERCENTAGE OF TItESE GROUPS
Ward Arta ne Cooloek Finglas East Finglas West Rahcny Santry Ballyfermot Rathfarnham South
Age O - 14 Male Female
aA
1.51 1~64 1.49 1.69 1.30 1..47 1.63 1.81 1.33 1.49 1.33 1.53 1.41 1.57i. 32 1.50
Age 15 - 24 Male Female
0.46 0.68 0.81 0.74 0.46 0.47 1.03 0.95 O. 54 0.77 0.75 0.73 0.67 O. 58 1.02 O. 94 Age 65+
Male Female
0.29 0.27
0.20 O. 19 O. 3,6 O, 39 O. ~14 O. 16
0.32 0.40
0.22 0. !5 ¯
0.25 0.21
®
As a whole the Zone has a proportion of population in age group 0-14 markedly above the expected proportion. In particular, Finglas West and Artane has proportions of males and females of this age well above the Co. Borough average; wMle in Coolock, ]3allyfermot, Santry and Rath-farnham South the percentage of females (although not of malqs) of this age was also much higher than the average. As the housing areas in these wards are catering for young married couples, as indicated by the migration estimates and figures for conjugal status, a large child population is to be expected. In the allocation of houses, the Corporation tends to give priority to large families. Also people tend to migrate when they are young: "The following’ generalization has been found to be valid in many places and for a long period of time. I?ersons in their late teens, twenties and early thirties are much more mobile thanyounger or older persons. Migration is highly associated with the first commit-ments and acts of adjustment ~o adulthood tlmt are made by adolescents as they mature(12). .. Thus the privately develc, ped housing estates as in Santry are
taking up the overspill of these young parents and their families who have
migrated from the remaining 26 counties ~o. the city, as well as the young married Dubliners. In Cooiock and Artane. apart from the Corporation developments
of the ’sixties, large private estates were completed bet[veen 1959-1969, as was the ease in Santry, which explains the very large child populations in 1966. Finglas West and Ballyfermot are characterised by very large families: in 1966, nearly 40 per cent o~ households contained over six persons, and in Rathfarlflmm South
nearly a third. (!3)
These three wards were prodominantly areas of local authority housing in 1961, and as was mentioned earlier, priority is given to large families
by the Corporation, also the lower the social grouping of p~}rents the larger
the size of family is likely to be. (14) Hence the large child population in these wards.
(12) Donald J. Bogue, "Internal. Migration" p. 504, The Study of Population, ed.~ Hauser and Duncan, The University of Chicago Press 1.959.
(13) C.P. 1966 Vol. VI Tablell.
@
As the majority of the families in these wards are still in the
first stage of the family cycle, the proporl:ion of population in age group 15-24 was well below the Co. Borough average (Table 7 (b)) Artane, l~aheny, and
Sanity being the more recently developed, again sh.ow the largest deviations from the mean. However, in Ballhffermot and ]~athfarnham South the proportion in the age group 15-2.4: is above average. Ballyfermot is the oldest Corporation housing
estate in the Zone. Housing allocations commenced in 1948, and between 1951-1958 the population increased by 122.3 per cent. Children of the original families are now adolescent, or older, and a large proporl:ion of population in age group 15-24 would therefore be expected. However out-migration, as previously mentioned, was high, 25 per cent of males and nearly 40 per cent of females from this age group depa;:ted during the intercensal period 1961-1966. Likewise in Ratlffarnham South, where housing allocations commenced in 1955 and a certain amount of private housing was completed between¯ 1962-1969, 30 per cent of this age group migrated in the same period. So Ballyfermot and ltat]ffarnham South are left with an average proportion of population aged 15-24.
These new housing estates, both Corporation and private, have been critieised for the monotony of their design and the social problems of isolation and boredom to which they give rise. However to the inhabitants they are their first healthy compact homes and the majority appear to be welI satisfied with
them. (14)
As a whole Zone 1 is outstanding in its dearth of an elderly population. All wards have proportions of population in age group 65 and over that are exceptionally below the expected percentage, giving rise to imbalance in
population structure (Table 7 (c)). Likewise there is a very small widowed population
(14) A survey undertaken in a Dublin Corporation housing estate on the north side of the city in 19(;(~ showed: "~he picture which appeared to q:l)nerge .from the ove~.~;~il pattern of replies of 75 per cent (of 24.9 respondents) was one of general contentment and happiness. These housewives too, had their difficulties and crises to face, but they appeared to be meetin,~ them through personal sacrifice and family sol,clarity, with help from neighbours in appro.~imately one third of the families". Conor K.
¯ CI °
W’-]~:’d "I.,ivi.ng in a New Com!nun].ty;" A Sun, mary of Results of a ,,octal
Survey.-¯ 1 . °O. "~ t 1 f
@
Many problems arise from such a situation. If all familieswithin a housing estate are at the same stage in the family cycle, the absence of older child’ren or relations to provide baby-sitting services must create great hardship though it can also lead to a new form of adjustment. Articles written about new estates describe the loneliness and feelings’of isolation of young mothers trapped for 24 hours a day with thier children,. (15) "Did all
three children accompany her into the busy shop or did she have one or two outside to become distracted excited and enervated? ... How often during the day can you park your children with a neighbour, who already looks after one of them while you collect another from school"?(16) Due to the urgent
need for rehousing, priority was given to the physical housing units and little thought spent on the provision of other facilities, social or recreational; and even less to the human and psychological problems of estate life. However, lessons may be learnt from past mistakes, and more recent Corporation housing developments include special accommodation for the elderly. For examp.~e, the Emmet Street and Vincent Street estates include a separate block of flats for old
¯ people, and in Ballymun the ground floors of the tower blocks are reserved for the elderly. However, according to Corporation workers, many old people ~,ho have lived all their lives in the noisy ’busy streets of the central city do not wish to be banished to its outskirts for the remainder of their lives. A certain number of these are accommodated in new blocks of flats in central areas
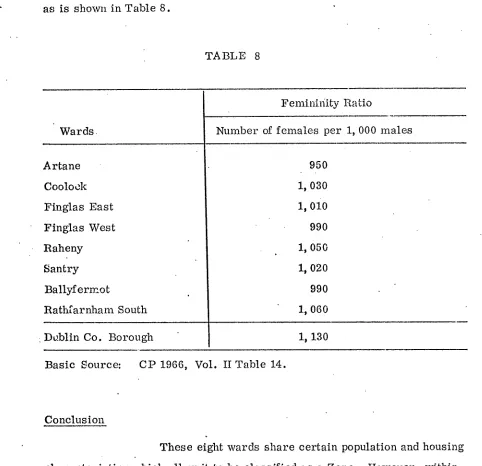
Femininity Ratio
_J
Although there are more males in Ireland than females, (in 1966 the ratio was 990 per 1, 000 males) yet Leinster and in particular Dublin Co.
Borough has traditionally a very large female population 1, 130 females per
1,000 males. The result of large scale in-migration of young females in particular, looking for work and an active social life.
(15) Ibid., constantly, problems. (16) Nell,
@
The wards of Zone 1 prove the exception. As we haveseen these are composed of predominantly new residential areas catering for a young n~arried population with their families. Their age sex pyramids
[image:17.576.50.532.203.669.2]show very broad bases which taper narrowly in the higher groups. However this imbalance has meant a greater equality in the male and female populations as is shown in Table 8.
TABLE 8
Wards
Artane Coolock Finglas East Finglas West l~aheny Santry Ballyfermot
Ratlffarnham South
Femininity Ratio
Number of females per i, 000 males
950 i, 030 i, 0i0 990 i, 050 i, 020 990 I, 060
D~,.blin Co. Borough 1, 130
Basic Source: CP 1966, Vol. II Table 14.
Conclusion
These eight wards share certain population and housing characteristics which allow it to be classified as a Zone. However, within this group there is a definite division between the areas of earlier housing developments, namely Ballyfermot, Ratldarnham South and Finglas East, where allocations commenced in 1948 and were completed during the ’fifties; and those of the remaining five wards, where the main development took place during the ’ sixties.
@
Net in-migration of males and females was low in Finglas East, practically non-existent in Ratlffarnl]am South; and in ]3ally-fermot slight,net out-migration occurred, while rates of in-migration in theage group 20-29 were low or non existent and out-migration occurred among those aged 15-19. The three wards had the lowest percentage~s of their
popula-tions in the age group 25-34 married. Ilatlffarnham South and Finglas East had a smaller proportion of their populations aged 0-14 and a higher proportion
aged 65 and over than the other wards. Finally these wards had a larger percentage of widows than the remainder. Thus it may be concluded that these immediate post-war development areas are drawing closer to tl~e average and
are taking on characteristics of the wards containing the older Corporation estates. .
The situation indicates the advantage of greater mobility between Corporation estates as the needs of the inhabitants change. A couple whose family are reared and have left hcme no longer need physically nor
economically the same house as formerly. If they could move to maisonet~es or flats the house would be available for a growing family. The same argument could be used for private neighbourhoods as well, since the demand for houses
@
ZONE II
Introduction
This zone comprises the fifteen central city wards,
which include the oldest parts of Dublin, namely Arran Quay, Inns Quay, North City, Rotunda, Mountjoy, Ballybough, North Dock, Usher’s Quay, Merchant’s Quay, Wood Quay, St. Kevins, Royal Exchange, Mansion House, South Dock and Phoenix Park on the north west periphery. Phoenix Park ward, an area of 1, 895 acres with a total population in 1966 of 1, 907 is an anomaly. It includes a handful of large official residences: the President’s Residence, the Apostolic Nuciature, the USA Ambassador’s Residence as well
as St. Mary’s Hospital, mainly geriatric. The Garda Siochana Headquarters are located in the Park andthe transfer of their Training Depot to Templemore in 1964 caused an out-migration rate of 92.9 per cent of males aged 25-29. Tho~gh a certain amount of res’idential area at Chapelizod and Islandbridge
is included in the ward, yet the very large elderly and widowed population is
probably accounted for by.the hospital and official residences. Hence a di.’.r-cussion of population movements would i~.ot be very meaningful, so the ward is excluded from further analysis.
The outstanding characteristic of these wards, (Usher’s Quay being the exception), is the large number of old and dilapidated nouseo which still exist, in spite of over 30 years of intensive rehousing and slum clearance by the Local Authority. The 1961 Census showed that the majority of dwellings were built either prior to 1860 or in the period 1860-1918.
Apart from Usher’s Quay to the south west of the city, which was developed later, not more than 15.4 per cent of total dwellings in these central city wards were
constructed after 1945. (17) .. .~
®
The area is one of high density, with a large numberof single-roomed dwellings. Itouseholds are small, at least a third of all dwellings in the various wards being 1 or 2 person households. (Table 13 (a)). Dwellings are mostiy rented mffurnished from private landlords. (Table 15 (b)).
F
Population Characteristics
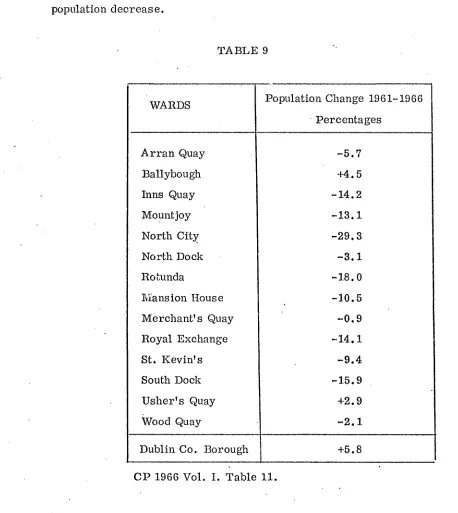
population decrease.
[image:20.576.42.500.256.769.2]In the period under study, this zone was an area of
TABLE 9
WARDS Population Change 1961-1966
Percentages
Arran Quay -5.7
Ballybough +4.5
Inns Quay -14.2
Mount joy -13.1
North City -29.3
North Dock -3.1
Rotunda -18.0
1Jansion House -10.5
Merchant’ s Quay -0.9
Royal Exchange -14.1
St. Kevin’s -9.4
South Dock -15.9
Usher’s Quay +2.9
Wood Quay -2.1
Dublin Co. Borough +5.8
CP 1966 Vol. I. Table Ii.
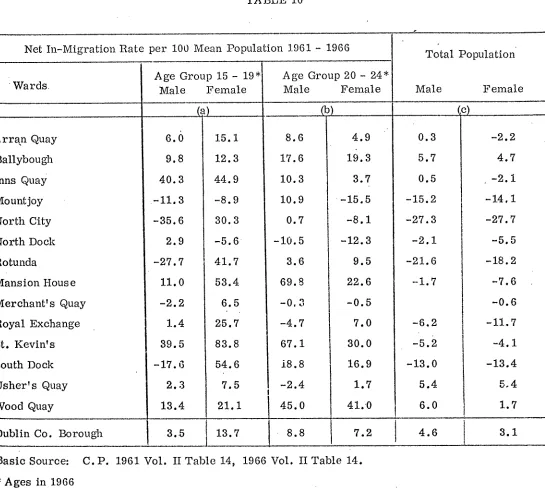
®
The estimates for migration illustrate more concisely [image:21.576.19.564.151.639.2]the different movements of population within tile various wards. (Table 10).
TABLE 10
Net In-Migration Rate per 100 5lean Population 1.961 - 1966
Wards.
Age Group 15 - 19" Age Group 20 - 24*~
Male Female Male Female
(a)
(b)
Arran Quay
6.0
15.1 8.6 4.9Ballybough 9.8 12.3 17.6 19.3
Inns Quay 40.3 44.9 10.3 3.7
Mount joy -11.3 -8.9 10.9 -15.5
North City -35.6 30.3 0.7 -8.1
North Dock 2.9 -5.6 -10.5 -12.3
41otunda -27.7 41.7 3.6 9.5
Mansion Hous e 11.0 53.4 69.8 22.6
~Merchant’ s Quay -2.2 6.5 -0.3 -0.5
Royal Exchange 1.4 25.7 -4.7 7.0
St. Kevin’s 39.5 83.8 67.1 ’ 30.0
South Dock -17.6 54.6 18.8 I
-2.4 }
16.9
Usher’ s Quay 2.3 7.5 1.7
Wood Quay 13.4 21.1 45.0
I 41.0
Dublin Co. Borough 3.5 13.7 8.8 7.2
Total Population Male Female 0.3 5.7 0.5 -15.2 -27.3 -2.1 -21.6 -1.7 -6.2
-5.2
-13.0 5.4 6.0 4.6 -2.2 4.7 -2.1 -14.1 -27.7 -5.5 -18.2 -7.6 -0.6 -ii.7 -4.1 -13.4 5.4 1.7 3.1Basic Source: C.P. 1961 Vol. II Table 14, 1966 Vol. II Table 14. * Ages in 1966
, -= net out-migration.
©
Mansion House, St. Kcvin’s and Wood Quay. As was apparent for the wards of Zone 1, the female rate of in-migration was dominant in theyounger age group, as wa~s also the case for the Co. Borough as a whole.
Certain central city wards do not attract young migrants. Apart from a small inflow of males aged 15--19, probably to.\vork on the
docks, North Dock had no net in-migration. Likewise Mountjoy experienced no in-migration of 15-19 years olds. Southof the river, Usher’s Quay and and Merchant’s Quay did not appeal to the younger age groups. All these wards are relatively distant from the centre of the city, and with the exception of North Dock, (which is virtually a .~eparate community centred on the docks) all have fairly large amounts of Corporation dwellings, and are thus more residential and less attractive for young independent men and
women.
.
This inflow for ages 15-24 represents: "the first commitments and acts of adjustment to adulthood’’(18~ of these young people, who are pre-sumably the new additions to the student population or to the work force, employed in shops, factories, offices etc., and living in crowded cheap accommodation, at best a bedsitter or a flat. The two most popular wards, St. Kevin’s and Mansion House in the south east sector of the city, had over
a quarter of tlmir total population, male and female, in the age group 15 - 24 in 1966. (The Co. Borough average was 18.5 per cent for males and 18.8 per cent for females in 1966). The presence of the two Universities and several
teaching hospitals in this area are reflected in these figures.
The large movement of young people into the central city is balanced by a corresponding movement out from central areas among those
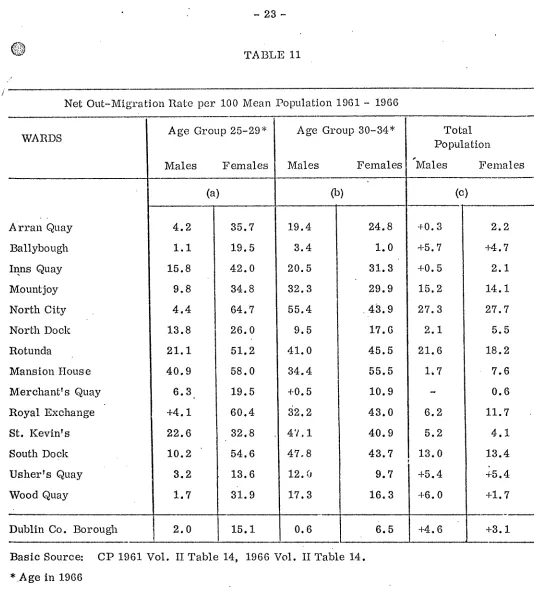
aged 25-34. Though the Co. Borough is an area of net in-migration, net out-migration occurs in these age groups. Likewise the central city area, apart from Ballybough, Usher’s Quay and Wood Quay, experienced overall net
out-migration. (’gable 11).
@
TABLE IiNet Out-Migration Rate per 100 Mean Population 1961 - 1966
Age Group 25-29* Age Group 30-34* Total
WARDS Population
Males Females Males Females "Males Females
(a)
(b) (c)Arran Quay 4.2 35.7 19.4 24.8 +0.3 2.2
Ballybough 1.1 19.5 3.4 1.0 +5.7 +4.7
Inns Quay 15.8 42.0 20.5 31.3 +0.5 2.1
Mount joy 9.8 34.8 32.3 29.9 15.2 14.1
North City 4.4 64.7 55.4 43.9 27.3 27.7
North Dock 13.8 26.0 9.5 17.6 2.1 5.5
Rotunda 21.1 51.2 41.0 45.5 21.6 18.2
Mansion House 40.9 58.0 34.4 55.5 1.7 7.6
Merchant’s Quay 6.3 19.5 +0.5 10.9 0.6
Royal Exchange +4.1 60.4 32.2 43.0 6.2 11.7
St. KevinTs 22.6 32,8 4’1.1 40.9 5.2 4.1
~outh Dock 10.2 54.6 47.8 43.7 13.0 13.4
!
Usher’s Quay 3.2 13.6 12.0 9.7 +5.4
45.4
Wood Quay 1.7 31.9 17.3 16.3 +6.0 +1.7
Dublin Co. Borough 2.0 I 15.1 0.6 6.5 +4.6 +3.1
Basic Source: CP 1961 Vol. II Table 14, 1966 Vol. II Table 14. *.Age in 1966
+ = net immigration.
In North City ward over a quarter of the total population male and female and in Rotunda ward, 21.6 per cent of males, and 18.2 per cent of females left during the intereensal period, 1961-1966. The acquisition of adequate sites
for redevelopment by the Corporation in central city areas necessarily takes time: while leases expire or buildings are condemed as dangerous or unhealthy. The larger the site to be redeveloped the longer will these adjoining houses
[image:23.576.20.554.22.611.2]©
1901-i966. In~the lqotunda, large blocks of flats have replaced the formertenements. In 1965, 20 flats were allocated in Grenville Street. In 1969, 60 flats in George’s Place and in 1970, 90 flats were allocated in Dominick Street Lower. In this case, densities remained lower than previously, but in some urban renewal shcemes, the new densities can be higI~er than those of the former tenements, due to the building of high rise blockS, of flats to replace them. In North City, the Corporation has not undertaken as yet
residential buildings, but recently as mentioned in the Introduction a plan to redevelop five acres of the eight acre site between Parne!l Street and Henry Street were announced. The scheme will provide shopping, two office blocks,
a hotel and other facilities and the work will be undertaken by a private concern.
A study of population movements by age shows that once again the female rate of out-migration in the Co. Borough is markedly higher than the male rate, particularly for ages 25-29, this is the situation in every ward In the older group 30-34, the mal~ rate. of out-migration is higher in the six wards Mountjoy, North City, St. Kevin’s and South Dock, Usher’s Quay and Wood Quay. This pattern of population movement is common in
large urban areas: "The stream of migrants arriving in a great metropolis tends to be highly concentrated in the ages 20-29, whereas the movement from the central city to the more distant suburbs tends to be a phenomenon
that has a very high incidence among parents just getting their second or third child, aged 25-35."(19) These migrants are composed partly of those
in-migrants described in Zone 1, who having qualified fora Corporation house, move to the city’s northern periphery with their young families, or of those, who have saved a sufficient amount to put down on a new house in a private estate on the outskirts of the built-up area. Howevdr the migrants are also persons, students or young employees who having used the capital city as the first step
in their careers move to the UK(20) or USA(21) to obtain further cxperiencc
or avail of greater opportunities. The higher female rates of out-migration are probably due to their marrying at younger ages than young men and moving
to their husband’s abode. (22)
It is interesting to observe that whereas only certain wards attracted tile young in-migrants in large numbers, all the central city wards
excepting Ballybough Usher’s Quay Wood Quay and possibly Merchant’s Quay experienced substantial rates of out-migration, male and female. The central city is an area of out-migration. However due to certain facts its accessibility, cheap rentable accommodation it is: "an attractive location for all those who welcome the anonymity and freedom from traditional social controls". (23) particularly among those aged 15-24. A decade later, their
circumstances and priorities altered, this group joins the general exodus out of central city areas.
Conjugal Status
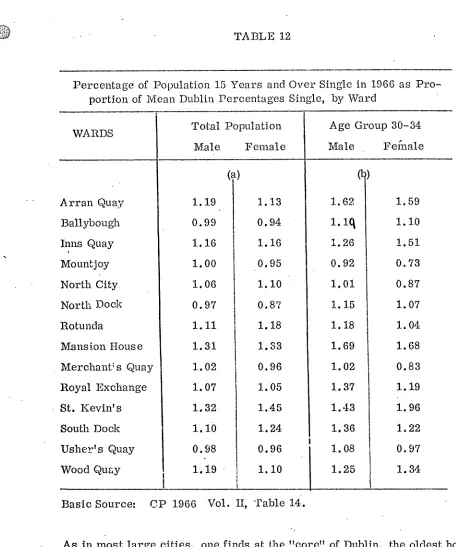
The percentage single of the population 15 years and oveT-of Zone 2, expressed as a proportion oveT-of the mean Dublin Co. Borough percentage single, (Table 12) shows that, as a whole, Zone 2 has a single population well above the Co. Borough average; and that in particular, Mansion House, St. Kevin’s and South Dock (for women) have single populations markedly above average. In contrast Ballybough, Mountjoy, North Dock, Merchant’s Quay (for women) and Usher’s Quay all have below average proportions single.
(20) The net outward balance by air and sea to the UK for 1961-1966 was 138,739 persons C.S.O.
’(21) The number of emigrants to the USA has fallen drarnatically. Between 1961-1965 the average number of immigrants visas issued in Dublin was 4,411 annually. Between July 1970 and June 1971, only 740 visas were issued.
(22) See Footnote 10,p. 8.
®
TABLE 12Percentage of Population 15 Years and Over Single in 1966 as Pro-portion of Mean Dublin Percentages Single, by Ward
WARDS Arran Quay Ballybough Inns Quay Mountjoy North City North Dock Rotunda Mansion House Merchant~ s Quay Royal Exchange St. Kevin’ s South Dock Usher’s Quay Wood Quay Total Population Male Female
L)
1.19 1.13 0.99 0.94 |I. 16 , I. 16
1.00 0.95
1.06 i i. I0
O. 97 0.8’;
i. II , i. 18
,
1.31 1.33 1.02 ’ 0.96
1.07 1.05
1.32 1.45
1.10 1.24
0.98 0.96
i. 19 ~ I. i0
Basic Source: CP 1966 Vol. II, ’Fable 14.
Age Group 30-34 Male Fe{nale 1.62 1.59
1.1q
1.1o
1.26 1.51 0.92 0.73 1.01 0.87I. 15 i. 07 I. 18 I. 04
1.69 1.68
1.02 0.83
i. 37 i. 19
1.43 1.96
1.36 1.22
I. 08 0.97
i. 25 I. 34
As in most large cities, one finds at the "core" of Dublin, the oldest houses originally built to house a wealthy nobility, now no longer suited to modern day residential use. Increasingly these buildings are being converted into flats, bedsitters, hotels, guest houses, or into commercial use as Offices. This is the "rooming" or "night" area of the city, inhabited by a transient population with very few normal households. Those families which remain are probably awaiting rehousing in the suburbs, due to the insanitary, dan-gerous, or overcrowded conditions of their dwellings; while those large houses when demolished are being increasingly replaced by office blocks, furthering the trend away from residential use. Between 1961-1966, the number of
(24) private households in these central wards dropped by 9 per cent.
[image:26.576.34.490.39.586.2]Into this environment is drawn the young, unmarried, working population, attracted by the cheap accommodation, accessibility of living in a ce~tral area, and anonymity of city life. Though as we have seen, large numbers leave at ages 25-34, no doubt on marriage or change of em-ployment, a very large single population continues to live and work in these areas (Table 12 (b)). Mountjoy alone has a proportion of population aged 30
-34 single, male and female below the Co. Borough average. The large number of unmarrieds is a reflection of traditionally late marriages and low marriage rates. Both of these patterns are improving but the latter, at ~8 per 1, 000 in 1966 was still the lowest rate in Europe by far. (25) Also, as we shall see,
the presence of large female populations in certain central areas is associated with large numbers of unmarrieds, male and female.
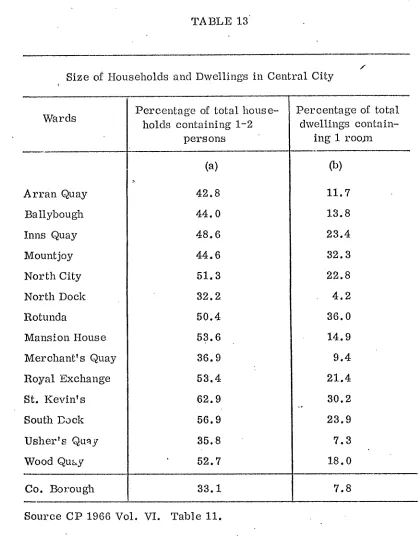
l~ansion House, S~. Kevin’s and South Dock include areas of the oldest and most derelict buildings in the city with a sizeable per-centage of dwellings rented mcfurnished and probably rent-controlled, hence they would r~ot experience a quick tur~.ove:: of tenants. However, a large percentage are rented furnished, twice, and three times the city average and though a cer’tain amount of Corporation housing existing in Mansion House, there are negligible amounts in So~lth Dock and St. Kevin’s. Here we find the "rooming" areas of the city. Households are small: (Table 13), the highest percentage
of one and two person households occur in ttlese wards. Overcrowding is extensive and the percentage of one room dwellings is twice and three times the city
ax,erage. (Table 13).
TABLE 13
Size of Households and Dwellings in Central City
Wards Arran Quay Ballybough Inns Quay Mount joy North City North Dock Rotunda Mansion House Merchant’s Quay Royal Exchange St. Kevin’s South Dock Usher’s Quqy Wood Quay
Percentage of total house-holds containing 1-2
persons
(a)
42.8 44.0 48.6 44.6 51.3 32.2 5O.4 53.6 36.9 53.4 62.9 56.9 35.8 52.7Percentage of total dwellings
contain-ing 1 roo~n
(b)
11.7 13.8 23.4 32.3 22.8 4.2 36.0 14.9 9.4 21.4 30.2 23.9 7.3 18.0Co. I~rough 33.1 7.8
Source CP 1966 Vol. VI. Table 11.
As we have seen large inflows of young people aged 15-24 (apart from males in South Dock) have distorted the age distribution of these wards so that a quarter of the total population both male and female are included in these groups. These migrants are the single transient working force which are to be expected at the core of the city, yet in the following age groups 25-34, where large out-migration occurs, there remains in these wards still a predominantly single population. A further indication of the areas "rooming" character.
are rented unfurnished and so subject to the Rent Restrictions Act. In Usher’s Quay and North Dock large numbers of new dwellings have been constructed since 1945 by the Corporation and in all five wards a large percentage of dwellings are rented from the Corporation. Since the Corporation does not
supply dwellings for single people, and rent restricted dwellings do not encourage mobility, one would expect in these wards a predominantly married and elderly population. All these wards, fairly distant from the central area, do ,,~.ot, as the migration estimates showed (Table 10) attract the young in-migrant. These are then areas of normal households with below average single populations. Families living in dilapldated houses while awaiting rehousing or families which have already been rehoused in the Corporation flats; as well as older household-~ living in their rent controlled dwellings.
~.ge Distribution
Table 14
C~ Percentage of Population in Age Groups as a Proportion of tl~e Mean Dublin Percel~tage in these Groups in 1966
WARDS Arran Quay Ballybough Inns Quay Mount joy North City North Dock Rotunda Mansion House Merchant’s Quay Royal Exchange St. Kevin’s South Dock Usher’s Quay Wood Quay
Age Group 0-14 Male Female
0.71 0.86 0.71 1.02 0.72 0.91 1.02 0.58 0.92 0.67 0.65 0.76 0.93 0.69 0.74 0.84 0.66 1.01 O. 65 ! 1.00 0.89 0.54 0.94 0.69 0.49 0.58 0.89 0.55
Age Group 15 - 24 Male Female
0
0.99 0.95
0. 92 0 89
1.15 1.11
0.98 0.87
0.92 1.14
1.00 " 0.95
0.92 1.29 1.43 1.40 0.89 0.87 0.83 1.00 1.37 1.44 0.99 1.35 0.87 0.88
0.99 I. 08
Basic Source: CP 1966 Vol. II. Table 14.
Age Group 65 and over Mate Female
1.41 1.38 1.38 0.90 1.39 1.06 0.98 1.25 1.33 1.68 1.32 1.25 1.70 1.65 (~) 1.43 1.41 i. 39
1. 2
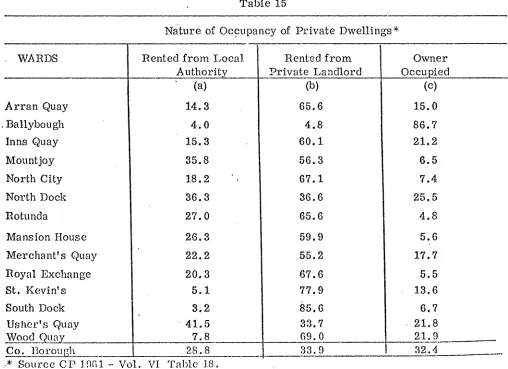
1.47 1.15 I. 04 I. 28 1.34 I. 53 1.48 1.26 1.66 1.56All these five wards exhibit characteristics of "rooming" areas or zones of transition. Over 60 per cent of all dwellings in 1961 were rented from private landlords (See Table 16(b)).
Table 15
Nature of Occupancy of Private Dwellings*
WARDS Rented from Local
Authority Arran Quay Ballybough Inns Quay Mount joy North City North Dock Rotunda
Ma ns ion House Merchant’s Quay Royal Exchange St, Kevin’s South Dock Usher’s Quay
Wood Q
Co. Boro’~h..* Source CP 1.961 - Vol. VI
(a) 14.3 4.0 15.3 35.8 18.2 36.3 27.0 26.3 22.2 20.3 5.1 3.2 41.5 7.8 28.8 TaMe 1.8. Rented from Private Landlord (b) 65.6 4.8 60.1 56.3 67.1 36.6 65.6 59.9 55.2 67.6 77.9 85.6 33.7 69.0 33.9 Owne r Occupied (c) 15.0 86.7 21.2 6.5 7.4 25.5 4.8 5.6 17.7 5.5 13.6 6.7 21.8 21.9 32.4
[image:30.576.32.540.543.912.2]®
Corporation involvement in 1961 was negiig{ble in Wood Quay, South Dock and St,. Kevin’s. (Table 15 (a)).
Over 50 per cent oi’ households in all five wards contained only I/2 persons which thus would exclude young families and account for the comparatively low child population (Table 13 (a)).
As was previously mentioned a large percentage of private dwellings
were rented furnished in Mansion House, St. Kev[n’s and South Dock and overcrowding, that is persons living two or more per room, were widespread. This would there£ore
be an area attractive for young people where tenancy turnover would be rapid and where several could share dwellings, so spreading the cost.
All five wards had above average single population. (Table 13) and apart from Wood Quay, all had very high femininity ratios. (Table 17).
As we have seen these wards attract large numbers of the young and single as a first stage in their possibly long and mobile careers, drawn by an accessibility of the area and the plentiful supply of rentable furnished dwellings. A type of area as described in The Urban Mosaic(26): "This is the area of first-generation immigrant
colonie~ and of the local isolates, its population is heterogeneous ... the property owners are interested only in the long term capital profit they can expect with the expansion of the central business district and with the short term profits which may be produced by packing in as many tenants as possible. As long as the tenants pay their rent no questions are asked."
The Rotunda is the exception in ~his group. Like South Dock, the above average proportion of population aged 15-24 refers to females only, a1~d probably
reflects the presence of two maternity hospitals in these wards, with their large female population of incumbents arid nursing staff. However, like its two adjacent wards i~{ountjoy, llotunda still has pockets of residential population. These three wards
Mountjoy, Rotunda (for men) North Dock (for women) have proportions of population 0 -14 above the Co. Borough average (Table 14 (a)). Mountjoy and Rotunda covered
areas of appalling slums with the highest number of persons per acrc in Dublin
@
in 194G, at 1.49 and 130 respectively. Though densities have decreased drastically due to the extensive and successful programme of rehousing carried out by the Corporation particularly since the ’thirties, and as offices and commercial buildings replace the former tenements, yet the number of persons :~er acre (88 and 60 respectively) is still amongst the highest in the city and the two wards manifesting the most severe over-crowding in the Co. Borough. In the immediate post-war period large scale reconditioning of mostly former Georgian town houses was undertaken by the Corporation as a temporary economy measure. These houses are still in use in Mountjoy, Rotunda and North Dock, apart from which there has been very extensive flat building in all three wards by the Corporation. In Mountjoy and Rotunda between 1957 - 1966, about 460 new dwellings had been completed which, since priority is given to large families, explains the above average child population.
Statistics for type of dwellings indicate the large amounts of Corporation activity, and reveal the large percentage ~f private dwellings in North Dock. This ward to the north east of the city is different from the rest. Life eentres upon the dock and ~o a large extent it is a separate stab:_e community with a balanced population structure and sex ratio and the highes~ percentage of very large households in the central city area. The small inflow "of males aged 15 - 19, and the fairly large outflow of young women aged 25 - 29,
probably on marriage, do not upset this well balanced age slex pyramid.
The proportion of population 65 years and over is markedly above the average for the Co. Borough in all but two wards. Mountjoy and
llotunda (for both men).
The central city wards, the area bounded by the Grand Canal to the south and roughly by the Royal Canal in the north, encompassed the
i
@
Dublin has developed and expanded so quickly, particularlyin the last fourteen years - with the introduction of tile first Economic Pro-gramme in 1958 - that the area now bounded by the two canals roughly falls into the first two zones as described by Burgess in his model of urban structure: (27) namely, tile central business district, and the zone of
transi-tion. The former contains the: "large department stores and smart shops ... main offices of financial institutions, the headquarters of various civic and poIKical organisations, the main theatres and cinemas, and the most expen-sive hotels, (27) some aspect of which is found on the inner side of all central
wards. Areas where;’ "only scattered pockets of residences remain, inhabited by the hobos of the city and by caretakers.(27) While at the outer edge of these
wards we find the transtion zone - the rooming areas of the city, in which: "The once-fashionable town houses have been converted into furnished rooms and have been surrounded by cheap bars, pawnshops and small industries. (27)
In these areas are found "the elderly,¯ the isolated, the defeated, leaderless arid help’,~’ss, ,,(27) left behind while the younger more able members of the
population prosper and move out to more pleasant surroundings.
This situation of a large elderly community in central city /
areas is fairly common, however these are not jus~ the remnants of a
former working class, but are composed also of old people moving into central /
/
city areas. I~ates of in-migration for ages 65 and over are high in several /
city wards. Cheaper dwellings, proximity to hospitals or to families who have moved to Dublin account mainly for this aged in-flow into the city.
Usher Quay, Wood Quay and Royal Exchange have an elderly population markedly above the Co. Borough average (Table 14) and the highest percentage of population widowed in the Co. Borough.
®
Table 16WARDS
Usher’s Quay Royal Exchange Wood Quay
Source: CP 1966 Vol. II,
Percentage of Population 15 Years and Over Widowed
i~{ales
6.8
5.6 4.1
(;
Females
17.3 15.4 15.2
Table 14.
¯ As has been mentioned previously, many old people are still living at very low rents in rent restricted dwellings. In both Royal Exchange and Wood Quay at least 60 per cent of private dwellings are rented unfurnished from private landlords. (28) In these two wards as well, over 80 per cent of dwellings were built before 1919. (29) While in Usher’s Quay, over 40 per cent
of dwellings are rented from the Corporation and more than one fifth of dwellings are ownez occupied. (29)
All three wards include the oldest areas of Dublin. In Wood Quay and Royal Exchange are located the two Cathedrals, Christ Church
and St. Patrieks. The Castle, City Hall, Trinity College and many old financial and commercial buildings are found in Royal Exchange, surrounded by a maze of small streets and old houses. Though much of Usher’s Quay has been reeon-, strueted yet here is the busy trading st-reef of St. Thomas, a continuation of High Street, fronting the hugh Guinness Brewery which gave employment to so many of the local inhabitants, and further north, Kingsbridge Station and the C.I.E. works, another big employer. These apart, there are also three hospitals in the wards including St. James’ the Health Board Hospital. There is also a very large oh] people’s home St. Patrields, run by the Little Sisters of the Poor. Among all these reasons, or a eombination of them lies the answer to the very large ehlerly
and widowed population of these wards.
(28) Census 1961 Vol. V I, Table 18.
[image:34.577.56.532.26.360.2]©
city wards. [image:35.577.46.533.85.484.2]Finally there is a very l~igh femininity ratio in all the central (Table 1’7). Ill particular St. Kevins’s South Dock and North City have exceptionally high ratios.
Table 17
Wards Arran Quay
Ballybough Inns Quay Mount joy North Dock Rotunda North City
Mansion House Merchant’ s Quay Royal Exehhnge St. Kevin’ s South Dock "Usher’s Quay
Wood Quay Co. Borough Basic Source:
Femininity Ratio Females per 1, 000 Males
I, 140 I, 150 i, 200 i, 170 I, 160 I, 020 I, 320 i, 200 i, 180 1, 100 1,450 1, 360 1, 160 1, 130
CP, 1966 Vol. II, Table 14.
I, 130
Traditionally, females have been attracted at yotmger ,:ges and in larger number than males(30) to large cities and in particular to Dublin. There is little employment opportunity for young girls living in the ceuntry. Formerly they would stay at home and help on the farm, but with increased mechanisation, the amalgamation of small holdings and the decrease in the agricultural population, the number of "relatives assisting" is falling rapidly. Also, the education received by the girls does not prepare them for life on the farm, so the majority prefer to escape from this potential drudgery and fine employment in an office or shop in a large town, where the social life will also be more active. The Civil Service, the gateway to success and opportunity for many young people from the country, recruits girls from the age of 16--~- years, hence a steady stream
of these st{ecessful candidates arrive in Dublin. Though one of the city’s attractions would be improved marriage prospects, yet due to their large number only a fraction of them marry and the remainder stay on in their employment, as permanent additions
to the large flal: dwelling single female population. (31) (30) Op. cir. Geary & Hughes, P. 8 ,~.
The foregoing analysis presents an interesting kaleidoscope of the changing life pattern of central Dublin. Old Dublin,
roughly the part bounded by the two canals is an area of decreasing popula-~’ lion and net out-migration. Office complexes are replacing tl)e old tenemel.~.~ and ethel- dwellings and their residents are being rehoused in the newCor-poration estates on the Co. Borough periphery or on private developments in the county. However interspersed among these areas of declining population, one finds thriving individual communities : of young single migrants aged 15-24, living in rented dwellings in the Mansion House, St. Kevin’s and South Dock; of .’normal’ households in the new, refurnished or old C0rporai;i0n dwellings of l~ountjoy, Rotunda, Ballybough and Merchant’s Quay; of elderly persons living in Usher’s Quay, Wood Quay and Royal Exchange.
¯ Though the predominant flow of population is outwards, particularly among those aged 5-9, 25-34, probably reflecting th.e movement of parents and young children in the secopd, and third stage of the family cycle ~o suburban houses or flats, yet there are high rates of in-migration in specific areas: of the young single individual aged 15-24 and the elderly aged 65 yea~"s and over, thus producing definite patterns of migration.
Finally the central city has a high femininity ratio caused by the influx of young females from the remaining counties in search of work and an improved social life.
In spite of the overall population movement outwards it is becoming apparent that a return to residential living in the central city is a definite possibility. Due to the continually increasing congestion of the roads, as more and more commuters join the various "rush hours" to and from work, the waste of time and energy becomes more obvious. Hence~the arguments for living in the central, area, or maintaining a "pied a terre" there while residing
w.
ZONE Ill
Introduction
The remaining County Borough wards do not fall into
j.
distinct groupings, but due to the periods and nature of their development call be associated loosely. The following eigllt wards, namely Crumlin,
Kirnmage, Kilmainham, Cabra East, Cabra West, Drmneondra North, Crumlln West and Baldoyle, share the characteristic that their main development
occurred as part of the Corporation’s housing schemes from 1930’s to 1950’s. In the South West, the area included in Crumlin and Kimmage wards formed the largest Corporation scheme ever completed; of over 5, 000 cottages.
Begun in 1934 to rehouse families from the slum clearance areas of the central city, it was finally completed in 1961. To the North West, in Cabra East, Cabra West and Drumcondra North, lay other Corporation developments of that period. 641 cottages in Cabra East in 1931, 2, 254 cottages in Cabra West in 1943, 421. cottages in Donnycarney, Drumcondra North in 1930, Baldoyle, though [ncl,lded in this group is an exception as it is still on the verge of large scaJe development.(32)
Crumlin West, too is more recent, and includes part of the Captain:s Lane
development of 1957. 59.5 per cent of all dwellings there were build after 1945(33)
Kilmainham ward includes the earliest housing schemes of the gToup wi’th 31 per cent of dwellings built between 1860-1918. (33) As .~mrly as 1912, 333 cottages
were erected by the Corporation in Inchicore and in 1927-1929 a further 102 cottages were completed in Emmet Road. In these wards, apart from Crumlin West, Cabra East and Baldoyle between a third and 80 per cent of dwellings w.ere
rented from Corporation in 1961. (34) Dwe!lings are srnal!, mainly 4/5 room
cottages, though in Baldoyle and Drunmondra North, 43 per cent of dwellings have
(32) Figures for ward densities illustrate this. In Baldoyle in 1966 there were ¯ 4.4 persons per acre. In CrumlinWest 15.0 persons per,acre. While in Crumlin
there were 45.3 persons per acre. Census 1.966 Vol. 1. "i;’a~ie 11. :’:~’i:~
6/7 rooms, while in Crumlin West 21 pe~: cent were one room dwellings, (35)
[image:38.577.64.526.113.523.2]Though dwellings are small to average, househ.olds, due to the worMng el.ass heritage of the inhabitants, are large and so overcrowding is widespread
(Table 18).
Table 18
,r
Incidence of Overcrowding
Wards
Crumlin Kimmage
Kilmainham Cabra East Cabra West
Drumeondra Nortl~ Crumlin West ]3aldoyle
Percentage of Persons Living 2 or more per room
23.0 35.2 29.3 16.3 25.5
9.1
16.9 12.2
Dublin Co. Borough 21.4
Source: CP 1966 Vol. VI Table 1i.
particularly in the areas of older Corporation schemes namely, Crumlin, Kimmage and Kilmainham. (36)
Population Characteristics
Apart from Baldoyle, and Crumlin West, areas in which extensive house building, both private and Corporation has recently been carried out, Table 19 shows that in all other wards the population is virtually static with only very slight changes occurring. The overall migration figures for total population reflects
this situation (Table 20).
(35) CP 1966, Vol. Vl. Table II.
(36) "Catholic marriag’es ,~re most fertile among farmers, farm labourers, and the "lower" soeio-economic groups in the non-farm population. The differentials are considerable: for women aged 20-24 at marriage, for example, who have been married for at least 20 years, the average family size of the unskilled Manual Workers group
r- l:
Table 19
Wards Population Change 1961-1966
Percentages
Crumlin Kimmage Kilmainham Cabra East Cabra West
Drumcondra North Crumlin Wes Baldoyle
Dublin Co. Borough
-2.2: -0.2 +2.9 -0.7 +I.0 +2.7 +16.4 +27.7
+5;8
Basic Source: CP 1966 Vol. I, Table II.
Table 20
Net 0ut-Migration Rate per 100 Mean Population 1961-1966
Total Population Age Group 15-19" Age Group 20-24* Wards
Male Female Male Female Male Female
(a)
(b)
(c)
Crumlin 3.1 4.3 6.6 +3.9 17.9 [ 29.3
Kimmage 0.2 2.5 9.5 2.3 19, 3 31.7
Kilmainham +1.0 1.2 6.8 10.3 5.9 2.0
Cabra East +2. +2.7 +2; 1 +27.6 +18.9 +23.8
Cabra West 0.1 4.6 3.6 1.7 9.4 ] 31.4
Drumcondra North +2.0 42.0 +0.3 0.8 6,8 9,1
Crumlin West +5.0 +10.2 +3.1 .4.0 36,0 21.0
Baldoyle , +17,8 +16.1 +30.6 47.8 +18.6
°
Dublin Co. Borough +4.6
i 4.3.1
+3.5 4-13.7 +8.8i
+7.2Basic Source: CP 1961 Vol. II Table 14, + = Net in-migration
* = Age in 1966.
@
Apart from Crumlin West and in partieulfir Baldoyle, where substan~iai ~’ates of in-migration occur, there are negl.igible popula~ion movements into the
remaining wards. These six wards, as mentioned heee, owe their develop-ment mainly ~o Corporation housing schemes. Allocations, commenced in all of them in the ’thirties and ’£orties therefore these areas are well
j.
settled, with the original families in Lheir second and third cycle, tlmt is with grown up, more independent children. Apart from movement on the fringes as people leave the area due to changed family or financial circurnseances, i. e. not being able to keep up their payments, there is no reason for any large population flows to or from these wards.
¯ " Figures for the individual age groups (Table 20 (b) and (e)), still demonstrate a mixed picture, though there is a definite movement of population into Cabra East, particularly of young people aged 20-24. In many respects Cabra East is similar to those central city wards, Mansion House, St. Kevin’s, South Dock Match were so attractive to the young migrants; being the fh~t dweller’s land of the norLh side. A quarter of private dwellings were in fiats in 1961, (37) 21 per cent were rented from private landlords (38) while 40 per cent of households con[ained 1/2 persons in 1966.
(39.’,
Theexcep-tionally high rate of in-migration of females aged 15-19 into Cabra East, with no similar movement of males is of significance. In the first grade, as already mentioned (elerical) the civil serviee recruits only girls aged 16½- years. Since a majority of these girls come from. outside the Dublin area and are relatively well
paid, it is quite likely that they tend to find accommodation in this area. The tnorth side’traditionally attracted civil servants probably due to its proximity to their work place. Glasnevin and Drumcondra North were first developed to house the lower middle classes, in particular civil servants. So possibly the
o
tradition still holds, though there is no factual evidence to support this theory.
(37)
![TABLE 4PERCENTAGE OF POPULATION 15 YEARS AN]_] OVER, SINGLE IN](https://thumb-us.123doks.com/thumbv2/123dok_us/1405018.675687/10.577.43.520.38.584/table-percentage-population-years-single.webp)