Proceedings of the Second Workshop on Machine Reading for Question Answering, pages 119–124 119
Evaluating Question Answering Evaluation
Anthony Chen1,Gabriel Stanovsky2,Sameer Singh1,and Matt Gardner3
1University of California, Irvine, USA
2Allen Institute for Artificial Intelligence, Seattle, Washington, USA 3Allen Institute for Artificial Intelligence, Irvine, California, USA
Abstract
As the complexity of question answering (QA) datasets evolve, moving away from restricted formats like span extraction and multiple-choice (MC) to free-form answer generation, it is imperative to understand how well current metrics perform in evaluating QA. This is es-pecially important as existing metrics (BLEU, ROUGE, METEOR, and F1) are computed us-ing n-gram similarity and have a number of well-known drawbacks. In this work, we study the suitability of existing metrics in QA. For generative QA, we show that while current metrics do well on existing datasets, convert-ing multiple-choice datasets into free-response datasets is challenging for current metrics. We also look at span-based QA, where F1is a rea-sonable metric. We show that F1may not be suitable for all extractive QA tasks depending on the answer types. Our study suggests that while current metrics may be suitable for ex-isting QA datasets, they limit the complexity of QA datasets that can be created. This is es-pecially true in the context of free-form QA, where we would like our models to be able to generate more complex and abstractive an-swers, thus necessitating new metrics that go beyondn-gram based matching. As a step to-wards a better QA metric, we explore using BERTScore, a recently proposed metric for evaluating translation, for QA. We find that al-though it fails to provide stronger correlation with human judgements, future work focused on tailoring a BERT-based metric to QA eval-uation may prove fruitful.
1 Introduction
Question answering (QA) has emerged as a bur-geoning research field driven by the availability of large datasets. These datasets are built to test a vari-ety of reading comprehension skills such as multi-hop (Welbl et al., 2017), numerical (Dua et al.,
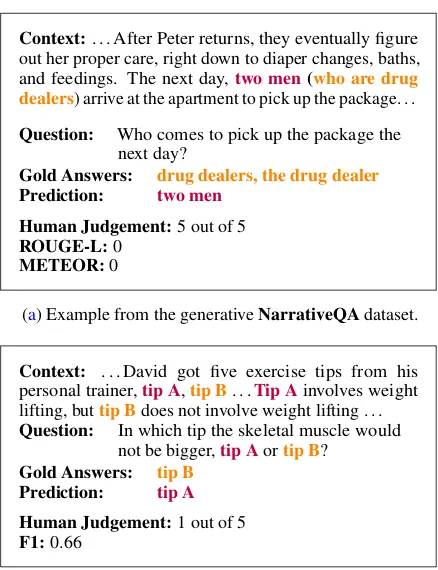
Context:. . . After Peter returns, they eventually figure out her proper care, right down to diaper changes, baths, and feedings. The next day,two men(who are drug dealers) arrive at the apartment to pick up the package. . .
Question: Who comes to pick up the package the next day?
Gold Answers: drug dealers, the drug dealer Prediction: two men
Human Judgement:5 out of 5
ROUGE-L:0
METEOR:0
(a) Example from the generativeNarrativeQAdataset.
Context: . . . David got five exercise tips from his personal trainer,tip A,tip B. . .Tip Ainvolves weight lifting, buttip Bdoes not involve weight lifting . . .
Question: In which tip the skeletal muscle would not be bigger,tip Aortip B?
Gold Answers: tip B Prediction: tip A
Human Judgement:1 out of 5
F1:0.66
[image:1.595.307.526.216.501.2](b) Example from the span-basedROPESdataset.
Figure 1: Examples where existingn-gram based met-rics fail to align with human judgements. Human judgements are between 1 and 5. (a) illustrates that be-cause existing metrics do not use the context, they fail to capture coreferences. (b) illustrates that changing a single token can make a prediction incorrect while F1 assigns a non-zero score.
more community attention. The second is that just as good datasets drive model development, good metrics drive dataset development. As QA datasets become more complex and models are expected to produce more free-form and abstract answers, it is crucial that the metrics we use are able to assign scores that accurately reflect human judgements. Despite the value of metrics as drivers of research, a comprehensive study of QA metrics across a num-ber of datasets has yet to be completed. This is important as present metrics are based onn-gram matching, which have a number of shortcomings (Figure1).
In this work, we survey the landscape of evalua-tion metrics for QA and study how well current met-rics approximate (i.e. correlate with) human judge-ments. We conduct our study on three datasets: NarrativeQA (Kocisk´y et al.,2017), ROPES (Lin et al., 2019), and SemEval-2018 Task 11 (Os-termann et al., 2018). For the generative Narra-tiveQA dataset, we find that existing metrics pro-vide reasonable correlation with human accuracy judgements while still leaving considerable room for improvement. We also study the span-based ROPES dataset, finding that it presents an interest-ing case where F1 struggles due to the high overlap in right and wrong answers. Finally, we convert the multiple-choice SemEval-2018 Task 11 dataset into a generative QA dataset. This produces a more difficult generative QA dataset compared to Nar-rativeQA as answers in SemEval are often more free-form in nature and have less overlap with the context. Here we find existingn-gram based met-rics perform considerably worse in comparison to NarrativeQA.
These results signify that as QA systems are expected to perform more free-form answer gen-eration, new metrics will be required. In explor-ing other metrics that go beyond n-gram match-ing, we study the recently proposed BERTScore. BERTScore computes a score by leveraging con-textualized word representations, allowing it to go beyond exact match and capture paraphrases bet-ter. We find that it falls behind existing metrics on all three datasets. We propose a potential step in constructing a better QA metric by extending BERTScore to incorporate the context and the ques-tion when computing the similarity between two answers. We show that extending BERTScore in this way slightly improves results when evaluating generative QA, though not to an extant that is
sta-tistically significant. Overall, our results indicate that studying the evaluation of QA is an under-researched area with substantial room for further experimentation.
2 Metrics
We provide a summary of popularn-gram based metrics, as well as sentence mover’s similarity, BERTScore, and an extension of BERTScore which we call conditional BERTScore. In this work, we study all mentioned metrics in the context of question answering.
BLEU is a precision-based metric developed for evaluating machine translation (Papineni et al., 2001). BLEU scores a candidate by computing the number ofn-grams in the candidate that also appear in a reference.nis varied from 1 up to a specifiedN
and the scores for varyingnare aggregated with a geometric mean. In this work, we look at BLEU-1 and BLEU-4, whereN= 1 andN= 4 respectively.
METEORis an F-measure metric developed for
evaluating machine translation which operates on unigrams (i.e. tokens) (Banerjee and Lavie,2005). METEOR first creates an alignment by attempting to map each token in a candidate to a token in a reference (and vice versa). A token is aligned to another token if they are the same, are synonyms, or their stems match. The alignment is aggregated into precision and recall values, which are combined into an F-measure score in which more weight is given to recall.
ROUGEis an F-measure metric designed for
evaluating translation and summarization (Lin, 2004). There are a number of variants of ROUGE however in this work we focus on ROUGE-L. ROUGE-L is computed based on the longest com-mon subsequence (LCS), which searches for the longest co-occurring set of tokens common to both reference and candidate. An advantage of ROUGE-L is that no predefinedn-gram size is required.
F1While the previously mentioned metrics have
been adapted for evaluating generative question answering, F1has been generally reserved for
eval-uating span-based question answering (Rajpurkar et al., 2016). It is computed over tokens in the candidate and reference.
Sentence Mover’s Similarity (SMS) is a
re-cent metric based on earth mover’s distance for evaluated multi-sentence texts such as machine-generated summaries (Clark et al.,2019) .1 SMS
first computes an embedding for each sentence in a document as an average its ELMo word represen-tations (Peters et al.,2018). A linear program is then solved to obtain the distance of “moving” a candidate document’s sentences to match a refer-ence document. SMS has shown better results over ROUGE-L in evaluating generated summaries and student essays.
BERTScoreis recent metric for evaluating
trans-lation (Zhang et al.,2019).2 BERTScore first ob-tains BERT representations of each word in the candidate and reference by feeding the candidate and reference through a BERT model separately. An alignment is then computed between candidate and reference words by computing pairwise cosine similarity. This alignment is then aggregated in to precision and recall scores before being aggregated into a (modified) F1 score that is weighted using inverse-document-frequency values. BERTScore has been shown to align better to human judge-ments in evaluating translation compared to exist-ing metrics. Additionally, because it uses word representations and not exact match, BERTScore has also been shown to capture paraphrases better than existing metrics. We include BERTScore and SMS in this work because they have not yet been studied in the context of QA.
Conditional BERTScoreA key difference
be-tween machine translation and QA is that determin-ing the correctness of a predicted answer requires using information from the context and question (Figure1a). While BERTScore can potentially han-dle phenomena like paraphrases better than existing metrics, it still overlooks the context and question. We propose an extension to BERTScore that incor-porates the context and question when calculating the answer word representations. More specifically, we concatenate the context, question, and answer delineated by BERT separator tokens as the input to BERT. We then extract the BERT representations of the answer words and compute BERTScore. In this way, the representation of the answer words are
conditioned(i.e. contextualized) with the context and question.
3 Datasets
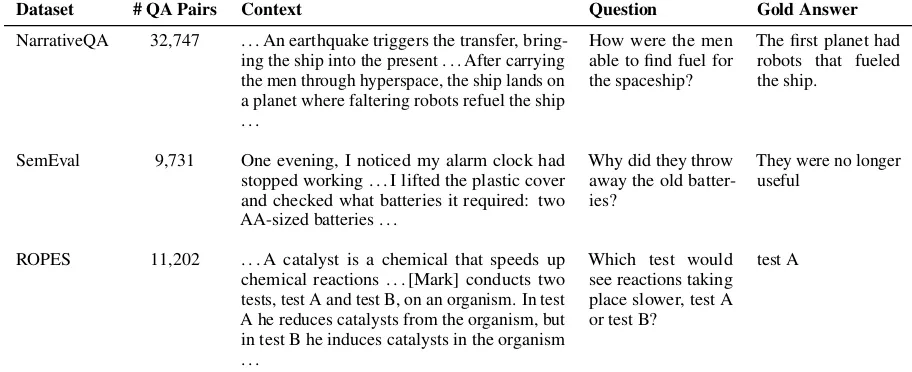
We describe the three QA datasets we use with examples in Table1.
NarrativeQA is a generative QA dataset on
books and movie scripts (Kocisk´y et al.,2017). The
2https://github.com/Tiiiger/bert_score
contexts are plot summaries taken from Wikipedia and each question has two reference answers. The official evaluation metrics of NarrativeQA are BLEU-1, BLEU-4, METEOR, and ROUGE-L.
SemEval-2018 Task 11 (which we refer to as
SemEval for brevity) is a multiple-choice QA dataset which focuses on commonsense reasoning about everyday scenarios (Ostermann et al.,2018). We convert this into a generative QA dataset by using the correct answer choice as a target for a generative QA system. We hypothesize that this results in a more difficult generative QA dataset compared to NarrativeQA as a number of the an-swers in the SemEval dataset have no overlap with the question or context.
ROPESis a recent span-based QA dataset with
questions that focus on cause-and-effect relation-ships (Lin et al.,2019). Each question is accom-panied by abackgroundpassage with auxiliary in-formation and asituationpassage. We concatenate the background and situation to use as the context. The official evaluation metric of ROPES is F1. A
unique characteristic of ROPES is that questions generally present two possible answer choices, one of which is incorrect (Table1). Because incorrect and correct answers often have somen-gram over-lap, we believe F1will struggle to accurately assign
scores (Figure1b).
4 Models
We describe the models used to generate predic-tions for our datasets. These models have publicly available code and have reasonable performance compared to the current state-of-the-art models.
Multi-hop Point Generator For NarrativeQA
and SemEval, we use a multi-hop pointer genera-tor (MHPG) model (Bauer et al.,2018)3. MHPG represents its input using ELMo embeddings. The embeddings are then fed into a sequence of BiDAF (Seo et al., 2017) cells, where the output of one BiDAF cell is fed as the input into another BiDAF cell. This allows multi-hop reasoning over the con-text. The output layer consists of a generative decoder with a copying mechanism. We evalu-ate MHPG’s predictions using BLEU-1, BLEU-4, ROUGE-L, METEOR, SMS, BERTScore and Con-ditional BERTScore.
BERTFor ROPES, we finetune BERT as a span based QA model following the procedure used for
3https://github.com/yicheng-w/
Dataset # QA Pairs Context Question Gold Answer
NarrativeQA 32,747 . . . An earthquake triggers the transfer, bring-ing the ship into the present . . . After carrybring-ing the men through hyperspace, the ship lands on a planet where faltering robots refuel the ship . . .
How were the men able to find fuel for the spaceship?
The first planet had robots that fueled the ship.
SemEval 9,731 One evening, I noticed my alarm clock had stopped working . . . I lifted the plastic cover and checked what batteries it required: two AA-sized batteries . . .
Why did they throw away the old batter-ies?
They were no longer useful
ROPES 11,202 . . . A catalyst is a chemical that speeds up chemical reactions . . . [Mark] conducts two tests, test A and test B, on an organism. In test A he reduces catalysts from the organism, but in test B he induces catalysts in the organism . . .
Which test would see reactions taking place slower, test A or test B?
[image:4.595.70.526.66.252.2]test A
Table 1: Examples for the datasets we use in our study. The# of QA Pairscolumn refers to the number of QA pairs in the training sets.
SQuAD (Devlin et al.,2019). We evaluate BERT’s predictions using F1, SMS, BERTScore, and
Con-ditional BERTScore.
5 Evaluating QA Metrics using Human Judgements
5.1 Collecting Human Judgements
After training our models on the three datasets, we extract 500, 500, and 300 data points from the validation sets of NarrativeQA, ROPES, and Se-mEval, respectively, along with the model predic-tions. When extracting data points to label, we filter out data points where the predicted answer exactly matches the gold answer. This filtering step is done as we are interested on how well metrics do when it cannot resort to exact string matching.
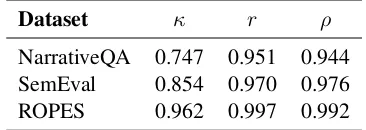
For the extracted data points, we ask annotators to rate how closely a prediction captures the same information as a gold answer. Annotations are on a scale from 1 to 5. Two of the authors annotated all data points in-house. We find strong agreement be-tween the two annotators across the three datasets (see Table 3). We note that because we have re-moved exact matches, the distribution of human judgement scores is right-skewed for each dataset. This is most prominent in ROPES, where around 400 predictions are labeled as a 1.
5.2 Correlation with Human Judgements
We first normalize the judgements for each annota-tor followingBlatz et al.(2004) and then average the judgements of the two annotators to obtain a single gold annotation per data point. We then
com-pute the Spearman and Kendall correlation of the gold annotations to the scores assigned by auto-matic metrics. The correlation results are presented in Table2.
5.3 Discussion
Of NarrativeQA’s four evaluation metrics, ME-TEOR aligns closest with human judgements, while leaving considerable room for improvement. ROPES proves to be a challenging dataset for F1 to evaluate. This highlights the fact that while F1 is a reasonable metric for many span-based QA datasets, the types of questions and answers can influence how well it works in practice and care should be taken when adapting evaluation metrics. For the SemEval dataset, which we converted to a generative QA dataset from a multiple-choice dataset, we find that existing metrics do consider-ably worse compared to NarrativeQA. This aligns with our hypothesis that more free-form generative QA datasets leads to a degradation inn-gram based metrics’ performance. Similar to NarrativeQA, METEOR aligns best with human judgements on SemEval. We make the recommendation based on these results that for evaluating generative QA, METEOR is currently the metric that should be given the most consideration.
Metrics NarrativeQA SemEval ROPES
Spearman Kendall Spearman Kendall Spearman Kendall
BLEU-1 0.617 0.483 0.443 0.351 -
-BLEU-4 0.563 0.433 0.437 0.350 -
-METEOR 0.752 0.614 0.642 0.542 -
-ROUGE-L 0.707 0.577 0.570 0.489 -
-Sentence Mover’s Similarity 0.474 0.365 0.488 0.384 0.376 0.307
BERTScore 0.733 0.573 0.406 0.323 0.448 0.365
Conditional BERTScore 0.741 0.581 0.415 0.330 0.434 0.353
[image:5.595.89.272.275.340.2]F1 - - - - 0.591 0.540
Table 2: Human Judgments and Metrics:Correlation between metrics and human judgments using Spearman’s rho (ρ) and Kendall’s tau (τ) rank correlation coefficients. “-” indicates the metric is not used for the dataset.
Dataset κ r ρ
NarrativeQA 0.747 0.951 0.944
SemEval 0.854 0.970 0.976
ROPES 0.962 0.997 0.992
Table 3: Inter-annotator agreementcomputed using Cohen’s kappa (κ), Pearson correlation (r), and Spear-man’s correlation (ρ).
improves results over BERTScore on our two gen-erative QA tasks, which is a promising sign that incorporating the context and question in a QA metric is a worthwhile pursuit. In the cases where Conditional BertScore improves over BERTScore, the gains are not statistically significant. One thing to note is that the BERT model was never exposed to context/question/answer triples during its pre-training. Finetuning a BERT model on QA datasets can potentially yield a better BERTScore-based metric.
6 Related Work
N-gram based metrics such as BLEU and ME-TEOR were originally developed and tested for evaluation of machine translation. These metrics have grown to become popular choices in evalu-ating all forms of natural language generation, in-cluding image captioning, question answering, and dialog systems. As these metrics continue to be used, there have been a number of papers that try to assess how suitable these metrics are for different domains.Nema and Khapra(2018) show that for question generation,n-gram metrics assign scores that correlate poorly to the notion of answerability
(i.e., is a generated question answerable). Yang et al.(2018) study the effect of using BLEU and ROUGE in evaluating QA, focusing on yes-no and entity questions on the Chinese DuReader dataset (He et al., 2017). For these types of questions, changing a single word from a gold answer can lead to an incorrect answer. In these cases, BLEU and ROUGE assign scores that do not necessar-ily reflect the correctness of an answer. Our work is continuation of this line of work in assessing the quality of current metrics for use in evaluating question answering across a number of datasets.
Because of the inherent limitations of n-gram metrics, recent work has focused on using met-rics that have been learned or are based on word representations. In image captioning, Cui et al. (2018) train a model that takes as input an image, a reference caption, and a candidate caption and learns to predict if the two captions are semantically equivalent. Using this trained model as a metric leads to better scores compared ton-gram based metrics. As mentioned earlier, sentence mover’s similarity and BERTScore leverage contextualized word representations for evaluating summarization and translation respectively, also obtaining better results compared to existing metrics. We hope to push the evaluation of question answering in this direction and study SMS and BERTScore in the context of QA as a first step in this direction.
7 Conclusion
SemEval dataset, existing metrics fare significantly worse. Our results indicate that as generative QA datasets become more abstractive in nature, better metrics that go beyondn-gram matching will be required. We also find that F1 struggles in
eval-uating the ROPES dataset, signaling that a better metric can also help improve span-based QA evalu-ation. In the search of a better metric, we also study BERTScore along with a conditional BERTScore that incorporates the context and question. Incor-porating the context and question into BERTScore slightly improves results, indicating that a BERT-based model that uses the context and question is a promising research direction. Future work also involves the collection of more data. This includes collecting human annotations on more datasets, generating model predictions using more reading comprehension models, and also evaluating metrics on human generated answers.
References
Satanjeev Banerjee and Alon Lavie. 2005. Meteor: An automatic metric for mt evaluation with improved correlation with human judgments. In IEEvalua-tion@ACL.
Lisa Bauer, Yicheng Wang, and Mohit Bansal. 2018. Commonsense for generative multi-hop question an-swering tasks. InACL.
John Blatz, Erin Fitzgerald, George F. Foster, Simona Gandrabur, Cyril Goutte, Alex Kulesza, Alberto Sanch´ıs, and Nicola Ueffing. 2004. Confidence es-timation for machine translation. InCOLING.
Elizabeth Clark, Asli elikyilmaz, and Noah A. Smith. 2019. Sentence mover’s similarity: Automatic eval-uation for multi-sentence texts. InACL.
Yin Cui, Guandao Yang, Andreas Veit, Xun Huang, and Serge J. Belongie. 2018. Learning to evalu-ate image captioning. 2018 IEEE/CVF Conference on Computer Vision and Pattern Recognition, pages 5804–5812.
Jacob Devlin, Ming-Wei Chang, Kenton Lee, and Kristina Toutanova. 2019. Bert: Pre-training of deep bidirectional transformers for language understand-ing. NAACL-HLT.
Dheeru Dua, Yizhong Wang, Pradeep Dasigi, Gabriel Stanovsky, Sameer Singh, and Matt Gardner. 2019. Drop: A reading comprehension benchmark requir-ing discrete reasonrequir-ing over paragraphs. In NAACL-HLT.
Wei He, Kai Liu, Jing Liu, Yajuan Lyu, Shiqi Zhao, Xinyan Xiao, Yuan Liu, Yizhong Wang, Hua Wu, Qiaoqiao She, Xuan Liu, Tian Wu, and Haifeng
Wang. 2017. Dureader: a chinese machine reading comprehension dataset from real-world applications. InQA@ACL.
Tom´as Kocisk´y, Jonathan Schwarz, Phil Blunsom, Chris Dyer, Karl Moritz Hermann, G´abor Melis, and Edward Grefenstette. 2017. The narrativeqa reading comprehension challenge. Transactions of the Asso-ciation for Computational Linguistics, 6:317–328.
Chin-Yew Lin. 2004. Rouge: A package for automatic evaluation of summaries. InACL.
Kevin Lin, Oyvind Tafjord, Peter Clark, and Matt Gard-ner. 2019. Reasoning over paragraph effects in situ-ations. ArXiv, abs/1908.05852.
Preksha Nema and Mitesh M. Khapra. 2018. Towards a better metric for evaluating question generation sys-tems. InEMNLP.
Simon Ostermann, Michael Roth, Ashutosh Modi, Ste-fan Thater, and Manfred Pinkal. 2018. Semeval-2018 task 11: Machine comprehension using com-monsense knowledge. InSemEval@NAACL-HLT.
Kishore Papineni, Salim Roukos, Todd Ward, and Wei-Jing Zhu. 2001. Bleu: a method for automatic eval-uation of machine translation. InACL.
Matthew E. Peters, Mark Neumann, Mohit Iyyer, Matt Gardner, Christopher Blake Clark, Kenton Lee, and Luke S. Zettlemoyer. 2018. Deep contextualized word representations. volume abs/1802.05365.
Pranav Rajpurkar, Jian Zhang, Konstantin Lopyrev, and Percy Liang. 2016. Squad: 100, 000+ questions for machine comprehension of text. InEMNLP.
Min Joon Seo, Aniruddha Kembhavi, Ali Farhadi, and Hannaneh Hajishirzi. 2017. Bidirectional attention flow for machine comprehension. InICLR.
Alon Talmor, Jonathan Herzig, Nicholas Lourie, and Jonathan Berant. 2018. Commonsenseqa: A ques-tion answering challenge targeting commonsense knowledge. InNAACL-HLT.
Johannes Welbl, Pontus Stenetorp, and Sebastian Riedel. 2017. Constructing datasets for multi-hop reading comprehension across documents. Transac-tions of the Association for Computational Linguis-tics, 6:287–302.
An Yang, Kai Liu, Jing Liu, Yajuan Lyu, and Sujian Li. 2018. Adaptations of rouge and bleu to better eval-uate machine reading comprehension task. ArXiv, abs/1806.03578.