Abstract—A comparative study between fuzzy and common Failure Mode and Effect Analysis (FMEA) was performed on a Discontinuous Distillation Plant. Fuzzy FMEA provides a tool that can work in a better way with vague concepts and without sufficient information than conventional FMEA. To compare fuzzy with common considerations, we work on a specific plant. Also were considered human error contributions. As a result, the most important conclusions and recommendations are shown.
Index Terms—FMEA, Fuzzy FMEA, Discontinuous Distillation Pilot Plant.
I. INTRODUCTION
FMEA was formally introduced in 1940s for military usage by the US Armed Forces. It develops a list of failure modes ranked according to their effect on the user. This ranking provides a measure for deciding which components or subsystems need further testing and/or redesign. Major factors include component or sub-system failure rate, type of failure (fail, degrade, etc.), severity of failure, and likelihood of detection [1].
FMEA methodology is now extensively used in a variety of industries including semiconductor processing, food service, plastics, software, and healthcare [2].
There are several applications for FMEA, including: design, which focuses on components and
subsystems;
process, for manufacturing and assembly processes; system, which orients on global system functions; service functions;
software functions.
The method is a procedure to analyze failure modes and classified them by severity. It is a systematic process for identifying potential failures before they occur with the intent to eliminate them or minimize the risk associated with them. A group of experts make this quantification gathering information from memory and experience of the plant personnel.
Manuscript received March 23, 2009. This work was supported in part by Cuyo National University with the project titled Fuzzy Logic application to Failure Mode and Effect Analysis and by Bioenergy Research Program, Cuyo National University - YPF .
S. S. Rivera is with the Cuyo National University, Engineering Faculty, CEDIAC Institute, Casilla de Correo 405 (M5502KFA) Centro Universitario, Mendoza, Argentina (phone: +54-261-4135000 ext. 2100; fax: +54-262-4380120; e-mail: srivera@ cediac.uncu.edu.ar).
J. E. Núñez Mc Leod is with the Cuyo National University, Engineering Faculty, CEDIAC Institute, Casilla de Correo 405 (M5502KFA) Centro Universitario, Mendoza, Argentina (phone: +54-261-4135000 ext. 2100; fax: +54-262-4380120; e-mail: jnmcleod@ cediac.uncu.edu.ar).
The most known way to implement this analysis is in an ordinary tabular form which is difficult to trace. An FMEA worksheet is often arranged in a lot of columns with inconvenient horizontal scrolling [3].
In order to eliminate this trouble a matrix method was developed. The idea has already been explored for different authors [4].
The matrix FMEA is a pictorial representation of relationships between several FMEA elements. Traditionally, the numbers in the matrix are a prioritization of failures based on ranked numbers evaluating concepts as severity, frequency of occurrence and detectability of failure. These numbers are combined in one number called Risk Priority Number.
The Risk Priority Number (RPN) methodology is a technique for analyzing the risk associated with potential problems identified during a Failure Mode and Effects Analysis (FMEA). The RPN for each issue is calculated by multiplying Severity x Occurrence x Detection [3].
Vague or ambiguous information and subjectivity in the ranking scales adds inherent inconsistency. Some authors eliminate this deficiency by introducing fuzzy logic [5]-[6].
To compare the matrix FMEA and fuzzy considerations, we work about its application on a Discontinuous Distillation Plant of biofuel.
II. BIOFUEL
Biofuel is an alternative fuel that is gaining attention all over the world. Its primary advantages deal with it being one of the most renewable fuels currently available and it is also non-toxic and biodegradable. The issues involved in the implementation of a biofuel production plant are known in extensive. But it is not known the latent dangers involved in the technology. In an industry an accident can be fatally and biofuel plants are not exempt.
III. DISCONTINUOUS DISTILLATION PLANT OF BIODIESEL
Biodiesel is the name of an alternative fuel, produced from renewable resources. It can be blended with petroleum diesel to create a biodiesel blend at any rate. It can be used in compression-ignition (diesel) engines with little or no modifications. It is biodegradable, nontoxic, and essentially free of sulfur and aromatics.
Biodiesel is made through a chemical process called transesterification whereby the glycerin is separated from the fat or vegetable oil. The process leaves behind two products: methyl esters (the chemical name for biodiesel) and glycerine [26-27].
There are different technologies currently used in biodiesel production in the market. Depending on which type of biodiesel this technology is going to be used, the energy
Recommendations Generated about a
Discontinuous Distillation Plant of Biofuel
efficiency and productivity results could vary from a wide range. Biodiesel from fatty acid methyl esters (FAME) can be produced by a variety of esteritification technologies. The production of biodiesel, or methyl esters, by esteritification is a well-known chemical process that has been used for decades in the soap and detergent industry. First the oil is filtered and pre-processed to remove water and contaminants. If free fatty acids are present, they can be removed or transformed into biodiesel using pre-treatment technologies. The pre-treated oils and fats are then mixed with an alcohol (usually methanol) and a catalyst (usually sodium or potassium hydroxide). The oil molecules (triglycerides) are broken apart and reformed into esters and glycerol, which are then separated from each other and purified. The resulting esters are biodiesel.
Distillation is the purification or concentration of a substance, the obtaining of the essence or volatile properties contained in it, or the separation of one substance from another, by such a process.
This is another way to separate chemicals in a fluid mixture, by exploiting the differences in boiling points between the chemicals. Therefore, this is useful in a biodiesel plant for sub-products recovery such as it happens with water and biodiesel. Distillation can be done by applications including both batch and continuous fractional process.
The degree of the separation that can be achieved depends on the relative volatilities of the chemicals to be separated, and also on the number of trays or the height of the packing, and finally on the reflux ratio [7].
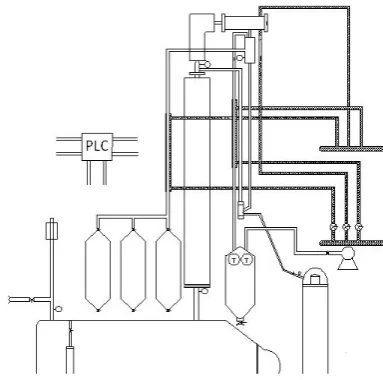
The plant analyzed including a batch process is shown in “Fig.1”. It was built to be use in teaching, research and services. It is a membership of the Bioenergy Program developed at Engineering Faculty, Cuyo National University. The Bioenergy Program is concerned with the generation of knowledge in connection with the new sources of energy and focuses on how to develop and exploit them.
It also centers on human resources and how to provide them with grade and post grade levels of training so that they can access a new field of study. Each component was analyzed by traditional and fuzzy FMEA [3].
The Plant is located at the Engineering Faculty – Cuyo National University – Mendoza – Argentina.
The plant is composed by: Boiler of 250 liters (10 KW)
Column of filling structured of 4” xs 2.5 ms (18 - 20 theoretical stages)
Condenser of helmet head and tubes - 0.22 m2 Condensated buffer
Vacuum system (5-10 mmHg) Distilled reception tanks
Account with a security system made up of: Safty valve
Presostato
Pushbutton in plant for total cut Fire protection system
IV. CONVENTIONAL FMEA
There are several types of FMEAs; some are used much more often than others. FMEAs should always be done
components.
In the process of an FMEA, analysts compile lists of component failure modes and try to infer the effects of those failure modes on the system. System models, typically simple engineering diagrams, assist analysts in understanding how the local effects of component failures propagate through complex architectures and ultimately cause hazardous effects at system level [8].
In first column are item numbers, in second column is the component description, it is possible to repeat this item because each raw describe one failure mode and each component can has one or more failure modes. In third column is the description of the component function. In fourth column each failure mode is described. In fifth column the effect on the system is described. In sixth column cause of failure is shown and seventh column detail if there is any detection of the failure or not.
In Table I two component analyses are shown. In the whole work, with the total of component analyzed, 63 rows gather the most important failure modes detected.
A. Risk priority number
The Risk Priority Number (RPN) methodology is a technique for analyzing the risk associated with potential problems identified during a Failure Mode and Effects Analysis (FMEA). This method evaluates the risk associated with the process and to prioritize problems for corrective action.
The RPN method then requires the analysis team to use past experience and engineering judgment to rate each potential problem according to three rating scales:
Severity, which rates the severity of the potential effect of the failure.
Occurrence, which rates the likelihood that the failure will occur.
Detection, which rates the likelihood that the problem will be detected before it reaches the end-user/customer.
Rating scales usually range from 1 to 5 or from 1 to 10, with the higher number representing the higher seriousness or risk[9].
[image:2.595.322.514.59.249.2]In this work range from 1 to 5 was adopted. After the ratings have been assigned, the RPN for each issue was calculated by multiplying Severity x Occurrence x Detection.
B. Risk ranking tables
In this work ranking issues were organized developing risk kinking tables.
These tables identify whether corrective action is required based on some combination of Severity, Occurrence, Detection and/or RPN values. In Table I the risk ranking table is shown.
The Table I places Severity horizontally and Occurrence vertically as in [9]. Numbers inside the table indicate whether a corrective action is required for each case. Corrective action needed if the Detection rating is equal to or greater than the given number at each element in the matrix.
Table I. Risk ranking table.
O/S 1 2 3 4 5
1 N N N C C 2 N N 5 C C 3 N 4 4 C C 4 N 4 3 C C 5 N 3 2 C C
Where:
N= No corrective action needed. C= Corrective action needed.
The FMEA table performed is shown in Table II. The following components were analyzed:
1) Spherical valve (entrance)
-2 failure modes (totally open and totally closed) 2) Temperature meter
-3 failure modes (excess error, defect error and without measurement)
3) Vent valve
4) -2 failure modes (fail to function and no open) 5) Boiler resistances
-1 failure mode (degraded) 6) Boiler
- 1 failure mode (leak)
7) Spherical valve (level indicator)
-2 failure modes (totally open and totally closed) 8) Level indicator
-3 failure modes (excess error, defect error and without measurement)
9) Spherical valve (end of level indicator)
-2 failure modes (totally open and totally closed) 10) Spherical valve (end of process)
-2 failure modes (totally open and totally closed) 11) Pressure and temperature meter (tower entrance)
-3 failure modes (excess error, defect error and without measurement)
12) Structure tower
-1 failure mode (blockage)
13) Pressure and temperature meter (tower head)
-3 failure modes (excess error, defect error and without measurement)
14) Condenser
-2 failure modes (misssizing and blockage) 15) Accumulator
[image:3.595.102.499.480.777.2]-1 failure mode (blockage)
Table I. Conventional FMEA
Table I. Conventional FMEA
COMPONENT
FAILURE
MODE EFFECT ON SYSTEM
CAUSE OF FAILURE
FAILURE DETECTION # DESCRIPTION FUNCTION
1 Spherical valve Biofuel in Totally open Pressure lost. Stream recirculation.
Inner stem break.
Boiler pressure gauge. Boiler level increase.
2 Spherical valve Biofuel in Totally closed
Do not enter biofuel in boiler.
Inner stem break. (soldering)
No increase boiler level.
3
Temperature
meter
Temperature control
temperature excess error
Temperature in boiler is lower than the necessary. Steam water and alcohol
diminishing.
Lack of maintenance.
Temperature meter at enter
of tower.
4
Temperature
meter
Temperature control
temperature defect error
Temperature in boiler is higher than the necessary.
It is possible to bring to the boil the biofuel.
Lack of maintenance..
Temperature meter at enter
of tower.
5
Temperature
meter
Temperature
control No measure
Failure to
function
(normal operation)
Lack of
maintenance. Action on PLC. Table II. Conventinal FMEA
16) Thermometer
-3 failure modes (excess error, defect error and without measurement)
17) Flow meter
-3 failure modes (excess error, defect error and without measurement)
18) Spherical valve (between flow meter and nitrogen tank) -2 failure modes (totally open and totally closed) 19) Manometer (nitrogen tank)
-3 failure modes (excess error, defect error and without measurement)
20) Nitrogen tank -1 failure mode (leak) 21) Vacuum meter
-3 failure modes (excess error, defect error and without measurement)
22) Condensomate units
-2 failure modes (lleak and overflow) 23) Spherical valve (condensomate discharge)
-2 failure modes (totally open and totally closed) 24) Spherical valve (between condensomate and pump)
-2 failure modes (totally open and totally closed) 25) Vacuum pump
-2 failure modes (miss suction and no suction) 26) Spherical valves (storage tank in)
-2 failure modes (totally open and totally closed) 27) Tanks
-2 failure modes (leak and over pressure) 28) Spherical valves (sub products discharge)
-3 failure modes (totally open, totally closed and degraded)
29) Gate valves (refrigeration flow) -1 failure mode (closed) 30) PLC
-4 failure modes (not response, without connectivity, slow response and response error)
It is important to make a model to a biodiesel production plant but it is not a straight work. The context is relevant in more than one aspect. The countries like Argentina without a consistent history in the biofuels production have not techniques and professionals prepared with their undergraduate or graduate education. The experience in the biofuels production will be obtained with the new installations. The models to diminish the risk of such installations must include that issue.
The models without the human error influence can´t diminish or management the risk. The risk management will require the complete written procedures to operation and maintenance.
The existence of written procedures allows the qualification of the personnel with new information. This information can be audited, analyzed, corrected or even perfected. But, without this information the oral tradition is the worst way to implement a technology to new users [26].
V. FUZZY FMEA
with vague concepts and without sufficient information. The conventional FMEA has been one of the well-accepted reliability and safety analysis tool due to its visibility and easiness.
A lot of difficulties are originated from the use of the natural language due to the necessity to assign values to those concepts.
Fuzzy sets are sets whose elements have degrees of membership.
Fuzzy sets have been introduced by Lotfi A. Zadeh [10-11] in 1965, as an extension of the classical notion of set.
Severity, occurrence and detection are the linguistic variables [12] considered.
Each linguistic variable has five linguistic terms to describe it. These linguistic terms are, Very Low (VL), Low (L), Moderate (M), High (H) and Very High (VH).
Several defuzzification algorithms [13-14] have been developed. In this work, the center average defuzzifier [10] was adopted due to its simplicity.
In this approach the center of the fuzzy set is similar to the mean value of a random variable and it is calculated.
The method used was presented in [3] where preliminary results were shown.
In this paper, the final results are presented. Some conclusions and recommendations will be explained in the following sections.
VI. HUMAN ERRORS
The authors agree with A. G. Foord & W. G. Gulland [15-17] who argues that it would not be possible to design technological systems to eliminate all human errors during operation because people are involved in: specifying, designing, implementing, installing, commissioning and maintaining systems as well as operating them.
Thus to improve process safety it will be necessary to focus on behavior and methods of working during all phases of the lifecycle so as to remove or reduce opportunities for human error.
Basically, human errors can be classified in two types of errors: errors by omission and errors of commission [3,18]. All the accidents reported [3] are due to the belief that in such simple process is impossible to have troubles. This belief is a constant in all kind of industries and much more in biofuel plants where the lack of experience and the simple process are combined to prepare the environment to produce errors.
From this point of view a new technique is adequate for these cases. In 2000 the Nuclear Regulatory Commission of the United States displays ATHEANA [3, 19-20] (Technique Human Event Analysis) a methodology that incorporates the contexts like generating sources of error.
The ATHEANA HRA method is being developed to provide a way for modeling new types of human errors with an emphasis on so-called errors of commission.
In nuclear power plants the risk is formed with the frequency of severe accident and the individual doses due to the accident and the end plant state. The worst case includes accidents with radiation on operator and public. This risk is inherently defined with the original design and increased with the maintenance and test tasks scheduled during the plant life.
In the last decades the risk point of view become in a relevant issue [21-26].
In the case of biofuel plants one face of the coin is simpler than in the nuclear case. The installation is extremely simple, but the interaction with the operators and technicians must be taken into account. Those interactions are complex and not clear at the moment.
VII. RESULTS
Results are obtained from both points of view, current and fuzzy FMEA. Each technique alone or combined contribute to explain a different issue.
Vent valve is very important in plant safety. Incorrect design or missfunction will put down the device at inadequate pressures with explosion danger.
Vacuum meter was calibrated to operate with benzene in this plant. An error measure due to a different condensed was obtained.
Condensomate unit do not have condenser level indicator. It is possible that liquid go in vacuum pump degrading it.
Gate valve broken prevents the temperature control overheating different devices.
Condenser size was inadequate. Wet biodiesel with alcohols was obtained.
The plant has 3 storage tanks with one of them in standby. Each tank has a spherical valve at the entrance. It is possible that these valves fail to the function if they are not used frequently. If this fails occur when the tank is required it is possible to increase back flow and pressure in the tower and wet biodiesel with alcohols is produced. These conditions can lead to a possible explosion.
Spherical valves place at storage tank discharge were not adequate to work at vacuum.
From this case of study it is detected that it is important take into account all measurements variables.
VIII. SUGGESTIONS
From the analysis below rise the following suggestions:
1) Perform preventive maintenance to assure correct operation.
2) Assure that the flow meter is calibrated to operate at different densities.
3) Verify that exist an indicator level in condensomate units. 4) Perform preventive maintenance to the gate valves to
increase the availability.
5) Verify the size of the condenser to guarantee the quality of the product.
6) Level indicators at storage tanks and condensomate units are very important. This indicator could be used to detect other failures.
7) Verify that the vacuum valve is of the adequate type. 8) Verify storage tank and condensomate unit connections. 9) Perform human reliability analysis.
IX. CONCLUSIONS
This work gathers the results of a research about the improvements to apply to a discontinuous distillation plant of biodiesel.
Due to the simplicity of the biodiesel process it is not frequently that systematic analysis are applied.
It is not known the latent dangers involved in the technology.
All plants are similar, but the lay out, personnel and procedures are different.
In this work, results are obtained by a particular case of study. It is important do not lack of view the human intervention as error source.
At biofuel plants a dangerous material like methanol can be spilled and can generate explodes if it is not having adequate manage.
It is important to note the lack of training in safety of the personnel.
It is highly recommended to do an FMEA in order to improve the safety of the facility and to diminish human, component, systems and procedures errors.
Each technique (conventional and fuzzy FMEA) alone or combined contribute to explain a different point of view.
By fuzzy logic approach applied to matrix FMEA form allows to detect easily the main contributor to the risk in a better way.
Due to the main concern with accidents in this kind of plants are related with human errors is highly recommended to apply error forced by context method in order to diminish commission errors.
ACKNOWLEDGMENT
To the Cuyo National University that support this project. To Eng. Pablo Gusberti and to the staff personnel of the Bioenergy Program.
REFERENCES
[1] C. F. Eubanks, S. Kmenta and K. Ishii, “System behavior modeling as a basis for advances failure modes and effects analysis,”Proceedings of the 1996 ASME Design Engineering Technical Conferences and
Computers in Engineering Conference, 96-DETC/CIE-1340, August
18-22, 1996, California, pp. 1-8. Available: http://www.fmeainfocentre.com/papers/1996.ASME.CIE.Eubanks.pd f
[2] E. Fadlovich. (2008,01). Performing Failure Mode and Effect Analysis. Embedded Technology Magazine. Available: http://www.embeddedtechmag.com/content/view/181/121/1/0/ [3] S. S. Rivera and J. E. Núñez Mc Leod, “Fuzzy FMEA: a study case on
a discontinuous distillation plant,” ESREL 2008 and 17th SRA-Europe Conference, Safety, Reliability and Risk Analysis: Theory, Methods and Applications, Tylor & Francis Group - CRC Press/ Balkema, London, U.K., 2009, pp. 1129-1133.
[4] Xu et al., Fuzzy assessment of FMEA for engine systems. Reliability
Engineering and System Safety 75 (2002) 17-29.
[5] Sankar & Prabhu , Application of fuzzy logic to matrix FMECA. Review of Progress in Quantitative Nondestructive Evaluation. Thompson and D. E. Chimenti (ed.). Vol. 20. American Institute of Physics, 2001.
[6] Yeh R. H. & Hsieh M., Fuzzy assessment of fmea for a sewage plant.
Journal of the Chinese Institute of Industrial Engineers. Vol. 24, No.
6, 2007, pp. 505-512.
Strathclyde, Glasgow, 2006. Available: http://www.esru.strath.ac.uk/Documents/MSc_2006/mendez.pdf [8] Y. Papadopoulus, D. Parker and C. Grante, “Automating the Failure
Modes and Effects Analysis of Safety Critical Systems,”Proceedings of the Eighth IEEE International Symposium on High Assurance
Systems Engineering (HASE’04), 2004. Available:
http://www.fmeainfocentre.com/papers/20940310.pdf
[9] Reliability Edge, “Examining risk priority numbers in FMEA”, 2009. Available: http://www.reliasoft.com/newsletter/2q2003/rpns.htm [10] Klir G. J. & Yuan Bo, Fuzzy Sets and Fuzzy Logic - Theory and
Applications,Prentice Hall P T R, 1995.
[11] Yager R.. Fuzzy logics and artificial intelligence. Fuzzy sets and
systems 90 (1997) 193-198, 1997.
[12] A. Devorak & V. Novák, Formal theories and linguistic descriptions.
Fuzzy Sets and Systems143 (2004) 169–188.
[13] Roventa E. & Spircu, Averaging procedures in defuzzification processes. Fuzzy sets and systems136 (2003) 375-385.
[14] Abbasbandya S. & Asadyb B. 2002. Note on a newapproach for defuzzyfication. Fuzzy Sets and Systems128 (2002) 131 – 132. [15] Impact analysis. Life cycle analysis of biofuels shows mixed results.
Available: http://impact_analysis.blogspot.com/ 2006/07/life-cycleanalysis-of-biofuels-shows.html
[16] A G Foord and W G Gulland, 2007, March, 20, “Can technology
eliminate human error?”, Availabe:
http://www.4-sightconsulting.co.uk/Current_Papers/Technology_and _Human_Error/technology_and_human_error.html
[17] D. Gertman and H. Blackman, “Human Reliability & Safety Analysis Data Handbook”, Wiley, 1994.
[18] NRC, “Handbook of Human Reliability Analysis with Emphasis on Nuclear Power Plant Applications”, Nureg/CR-1278, USA, 1983. [19] NRC, Technical Basis and Implementation Guidelines for A
Technique for Human Event Analysis (ATHEANA), Nureg-1624, Rev. 1, USA, 2000.
[20] U. S. Nuclear Regulatory Commission – Sandia National Laboratories, "Philosophy of ATHEANA", 1999.
[21] J.C. Duthie, et al., “Risk-based approaches to ageing and maintenance management,” Nuclear Engineering and Design, 1998, 184: p. 27-38. [22] P. Kafka, “Probabilistic safety assessment: quantitative process to balance design, manufacturing and operation for safety of plant structures and systems,” Nuclear Engineering and Design, 1996, 165: p. 333-350.
[23] R.J. Rohrer and C.F. Nierode, “Simple method for risk assessment of nuclear power plant refueling outages,” Nuclear Engineering and Design, 1996, 167: p. 193-201.
[24] M. Richner and S. Zimmermann. “Applications of simplified and of detailed PSA models,” Probabilistic Safety Assessment and Management, 1998, Springer Verlag.
[25] A.Muñoz, S. Martorell, and V. Serradell. “Numerical absolute & constrained optimization of maintenance based on risk and cost criteria using genetic algorithms,” European Safety and Reliability Conference,Vol. 3, 1997. Portugal: Pergamon, pp 1749-1756. [26] J. E. Núñez Mc Leod & S. S. Rivera, A discussion about how to model
biofuel plants for the risk optimization, Lectures Notes in Engineering and Computer Science, Newswood Limited - International Association of Engineers, London – UK