i
THE KNOWLEDGE REPRESENTATION AND
ALGORITHM FOR PERSONALIZED INFECTIOUS
DISEASE RISK PREDICTION
A thesis submitted to the
Trinity College Dublin, the University of Dublin
for the degree
Doctor of Philosophy
Retno Aulia Vinarti
Knowledge and Data Engineering Group
School of Computer Science and Statistics
Trinity College Dublin, Ireland
[email protected]
2019
ii
DECLARATION
I, the undersigned, declare that this work has not been previously submitted as an exercise for a degree at this or any other University, and that, unless otherwise stated, it is entirely my own work.
iii
PERMISSION TO LEND OR COPY
I, the undersigned, agree that the Trinity College Library may lend or copy this thesis upon request.
iv
ACKNOWLEDGMENT
During the PhD journey, I feel blessed to meet people with positive influences on my life and on this thesis particularly.
First of all, I would like to thank Lucy Hederman for all her time and patience to support the research written in this thesis. From the beginning, the PhD interview, until the ending, this thesis submission. She surely becomes one of the most inspiring people that I have met, as a woman, as a researcher, and as a mother. I am truly thankful that the destiny brought me to meet you, as my PhD supervisor.
As importantly, I thank my husband, Fajar Annas Susanto, whose unconditional love to me and our daughter, Rania Annas Ramadhani, led me to finish this thesis. To my parents and parents-in-law who always pray for my strength when I am at the lowest points in this journey. Also, to my brother, Lintang Jati Prasojo, who sublet his apartment to me and my family.
I would like to thank my Indonesian friends, for the delish food they sent to my apartment when I was busy doing my thesis at my lab, or for their companion to keep my sanity when I was deeply missing my daughter. To my best friends who patiently listen to my rantings, Riska Asriana, Junita Purwandari, Rizka Hadiwiyanti. To my supportive colleague, Hanim Maria Astuti. To my knowledge sources, Fariziyah Dwi Safitri, Nurul Kodriati, Gumgum Darmawan, Ika Yuni Wulansari.
I would also thank my lab mates, Ramisa Hamed, for her limitless kindness; Gary Munnelly for the guitar; Harshvardhan Pandit for optimizing the algorithm, Brendan Spillane, Fahim Salim, Jamie McGann, and other lab mates for their help at KDEG. Also, for Irish people, chatty grandmas on the bus or streets who are very welcoming to foreign people, so my family and I can live in peace. This condition truly supports everyone to make this world as a better place to live. Somehow, their spirits of independence in all sectors inspire me so much. I promise that I will tell my future generations to be kind to any foreigners they meet anywhere.
v
“To expect the unexpected shows a thoroughly modern intellect.”
vi
ABSTRACT
Infectious diseases are a major cause of human morbidity. However, in the EU in 2014 more than 40 thousand deaths caused by infectious diseases were considered preventable. Information about infection risk based on personal and environmental attributes, as well as up-to-date infectious disease risk knowledge is expected to make lay people aware of their infection risks. With the emergence of APIs and GPS technology, surrounding location features and weather information can be inferred from a person's position. This offers an opportunity to create a system for personalized infectious disease risk prediction.
This thesis presents research towards a system that can predict personalized infectious disease risk (IDR) based on a person's attributes and geo-position by utilizing infectious disease risk knowledge (entitled PROSPECT-IDR: Personalised Prediction of Infectious Disease Risk). A knowledge representation was designed to facilitate epidemiologists to encode infectious disease risk knowledge in a form familiar to them. The generic IDR ontology represents personal and environmental risk factors for all human infectious diseases (n=234). Quantifications for the risk factors (e.g. odds ratios) are encoded using five IDR rule types. This IDR knowledge representation (ontology and rule types) allows encoding of knowledge about risk of infectious diseases prevalent in a region.
The IDR ontology can never be complete, as new risk factors for existing diseases, and new diseases, are constantly discovered. The initial generic ontology contains all risk factors found in the Atlas of Human Infectious Diseases, and in factsheets from the CDC and WHO. Each instantiation of knowledge for a specific disease in a region comprises of a subset of risk factors from the generic ontology plus any new risk factors not found there, along with a set of risk quantification rules (instantiations of the five rule types). An algorithm (entitled BN-Builder) converts the knowledge-base into a fully functioning and consistent risk prediction model, a Bayesian Network, which is the core of the PROSPECT-IDR prediction system.
vii objects needed to encode the knowledge in the evaluation case-control studies were found in the initial generic ontology. With regard to usefulness, more than 3/5 were used to encode evaluation case-control studies. With regard to completeness and usefulness of the five rule types, all infectious disease risk knowledge in the 22 evaluation case-control studies can be encoded with just those five rule types, and all five rule types were used. To evaluate BN-Builder algorithm, the consistency between the generated BN and the knowledge-base was measured. Chi-square tests for differences were carried out for two evaluation knowledge-bases that covered all functions of the algorithm and all data ranges allowed by the rule types. There was no significant difference between the resulting infectious disease risk prediction and the encoded knowledge (p > .05).
viii
RESEARCH OUTPUTS
Published
R. A. Vinarti and L. Hederman, “Personalization of Infectious Disease Risk Prediction: Towards Automatic Generation of a Bayesian Network,” in Proceedings – IEEE Symposium on Computer-Based Medical Systems, 2017, vol. 2017 - June (see Appendix 3 for full paper).
R. Vinarti and L. Hederman, A knowledge-base for a personalized infectious disease risk prediction system, Book Section – Studies in Health Technology and Informatics. vol. 247. 2018 (see Appendix 4 for full paper).
R. A. Vinarti and L. Hederman, “Introduction of a Bayesian Network Builder Algorithm - Personalized Infectious Disease Risk Prediction,” Proceedings – 11th
International Joint Conference on Biomedical Engineering Systems and
Technologies, vol. 5, no. Biostec, pp. 115–126, 2018 (see Appendix 5 for full paper).
The form of Knowledge Representation is available in R. A. Vinarti, “IDR Ontologies”,
https://osf.io/p6qv8/, Open Science Framework, 2018.
The BN-Builder algorithm is available in R. Vinarti, "Thesis Code",
https://github.com/retnor/ThesisCode
Submitted
R. A. Vinarti and L. Hederman, “A Personalized Infectious Disease Risk Prediction System”, International Journal of Expert Systems with Applications (see Appendix 6 for full paper).
ix
TABLE OF CONTENTS
1. Introduction ... 1
1.1 Background ... 1
1.2 Motivation ... 4
1.3 Research Questions ... 7
1.4 Objectives and Goals ... 7
1.5 Contribution to the State of the Art ... 8
1.6 Methodology ... 9
1.7 Thesis Overview ... 11
2. State of the Art – Infectious Disease Risk Prediction System ... 14
2.1 Definition of Personalized Infectious Disease Risk Prediction System ... 14
2.2 Existing Research on Infectious Disease Risk Prediction and its Predictor Modelling ... 17
2.2.1 Previous research related to risk prediction techniques ... 21
2.2.2 Previous research related to person and environmental modelling ... 24
2.3 Conclusion... 26
3. State of the Art – The domain knowledge and its representation ... 28
3.1 The Domain of Knowledge: Human Infection Risk ... 28
3.1.1 Etiology of Infectious Diseases ... 29
3.1.2 Disease Risk Quantifications ... 42
3.1.3 Summary ... 47
3.2 Disease Knowledge Representation ... 48
3.2.1 Ontology ... 54
3.2.2 Fuzzy Cognitive Map ... 58
3.2.3 Bayesian Network ... 61
3.2.4 Rules ... 64
3.2.5 Summary ... 68
3.3 Approaches that combine knowledge representation and risk prediction as a single model ... 70
3.3.1 Probabilistic Relational Model ... 71
3.3.2 Bayesian Knowledge-base ... 72
3.3.3 Probabilistic Knowledge-base ... 74
3.3.4 Probabilistic-OWL (PR-OWL) ... 75
3.3.5 BayesOWL and BNTab ... 77
x
3.4 Conclusion ... 79
4. Design of PROSPECT-IDR System Architecture and the User Interfaces ... 81
4.1 Introduction ... 81
4.2 Influences from the State of the Art ... 81
4.2.1 Data Sources, Reports, APIs ... 82
4.2.2 Reused Concepts and Objects ... 82
4.2.3 Required Tools and Activities ... 83
4.3 The PROSPECT-IDR system ... 86
4.4 The System Components ... 89
5. Design and Evaluation of the Infectious Disease Risk (IDR) Knowledge-base (KB) ... 93
5.1 Introduction ... 93
5.2 Influences from the State of the Art ... 93
5.2.1 What knowledge to represent ... 94
5.2.2 How to represent the knowledge and yield personalized prediction from it . ... 96
5.3 Ontology Construction ... 97
5.3.1 Generic ontology ... 99
5.3.2 Disease-specific ontology ... 105
5.4 Rule Type Design ... 107
5.5 Knowledge-base Evaluation ... 112
5.5.1 Evaluation Plan ... 112
5.5.2 IDR Evaluation Cases ... 114
5.5.3 Evaluation Results: IDR Rule Types ... 117
5.5.4 Evaluation Results: IDR Rules ... 119
5.5.5 Evaluation Results: IDR Generic Ontology ... 121
5.6 Conclusion ... 124
6. Design and Test of the BN-Builder Algorithm ... 126
6.1 Introduction ... 126
6.2 Influences from the State of the Art ... 126
6.3 The Design of BN-Builder Algorithm ... 127
6.3.1 Translation from Ontology to Bayesian Network ... 128
6.3.2 Intermediate Representation of Network and Rule Structure ... 130
6.3.3 Network Construction procedure ... 139
6.3.4 CPT Population procedure ... 141
6.3.5 Summary ... 144
xi
6.4.1 Testing Plan and Testing Cases ... 145
6.4.2 Test Results: BN structure ... 152
6.4.3 Test Results: CPT ... 155
6.5 Conclusion... 164
7. Conclusions ... 166
7.1 Overview ... 166
7.2 Objectives and Achievements ... 166
7.3 Contribution to the State of the Art ... 169
7.4 Limitations ... 171
7.4.1 Limitations of the research ... 171
7.4.2 Limitations of the proposed solution ... 173
7.5 Discussion ... 174
7.6 Future Work ... 175
References ... 177
Appendices ... 191
Appendix 1 – Articles used in Knowledge Representation Design ... 191
Appendix 2 – Design of the User Interfaces for Knowledge Encoding ... 201
Appendix 3 – CBMS Proceeding Publication ... 205
Appendix 4 – MIE Book Section Publication ... 212
Appendix 5 – HealthInf Proceeding Publication ... 217
Appendix 6 – ESWA Journal Submission ... 230
Appendix 7 – BMC Journal Submission ... 248
xii
TABLE OF FIGURES
Figure 1.1: Extract of an output of a case-control study for tuberculosis in African
population [21] ... 5
Figure 1.2: An early version of the knowledge representation ... 5
Figure 2.1: Distribution across subject areas of articles in Scopus containing “risk prediction” terminology ... 15
Figure 2.2: Distribution across subject areas of Scopus articles matching “personalization” ... 16
Figure 3.1: Diagram of chain of infection ... 30
Figure 3.2: Infection transmission modes ... 31
Figure 3.3: The correlation between environment and infectious diseases (redrawn from [125]) ... 34
Figure 3.4: A sample of peacefulness as an infection driver from AHID [13] ... 36
Figure 3.5: A sample of Tuberculosis brief explanation from AHID [13] ... 37
Figure 3.6: A distribution map of Tuberculosis from AHID [13] ... 37
Figure 3.7: A WHO factsheet that explains malaria risk factors [31] ... 40
Figure 3.8: A CDC factsheet that explains cholera risk factors [30] ... 41
Figure 3.9 Procedure to select documents about knowledge representation for this review. ... 49
Figure 3.10: A tree explaining the relationship between ontologies given in Table 3.6 ... 56
Figure 3.11: Fuzzy Cognitive Map to represent the example of Anthrax risk. Blue arrows indicate positive relationships, whereas brown arrows indicate negative relationships. 59 Figure 3.12: Dummy adjacency matrix that represents anthrax risk ... 59
Figure 3.13: Confidence Rating for each link in the FCM ... 60
Figure 3.14: The example of BN representing Anthrax risk ... 63
Figure 3.15: Sample extract of the CPT of the BN that representing anthrax risk ... 63
Figure 3.16: Probabilistic Relational Model for Anthrax risk knowledge ... 72
Figure 3.17: Bayesian Knowledge-base for Anthrax risk knowledge ... 73
Figure 3.18: An OWL schema for representing one predicate of Anthrax risk knowledge ... 76
Figure 3.19: A PR-OWL schema for representing the same predicate as Figure 3.17 . 76 Figure 3.20: An ontology to represent the Anthrax risk knowledge ... 77
Figure 3.21: The generated binary BN ... 78
Figure 4.1: Draft of PROSPECT-IDR system architecture ... 85
Figure 4.2: The design of PROSPECT-IDR system ... 92
xiii
Figure 5.2: The IDR generic ontology (without individuals); the main classes are inside
the polygon ... 103
Figure 5.3: The disease-specific ontology for cholera risk in India ... 106
Figure 5.4: The correlation between IDR generic ontology main classes and the IDR rule types ... 107
Figure 5.5: IDR examples written in SWRL ... 110
Figure 5.6: COVER anomaly types [226] ... 113
Figure 6.1: RDF Structure... 130
Figure 6.2: A sample of person risk factor multiple hierarchy ... 131
Figure 6.3: An RDF representation of some class and individual of the example given in Figure 6.2 ... 133
Figure 6.4: XPath queries for retrieving node and state names from RDF ... 133
Figure 6.5: Rule examples and their design ... 133
Figure 6.6: Rule splitting illustration ... 134
Figure 6.7: The SWRL rule RDF representation of the S1 in Figure 6.6 (some unimportant URL was truncated) ... 135
Figure 6.8: XPath queries for retrieving items in the rule intermediate representation from RDF ... 136
Figure 6.9: XPath query for retrieving item in the optional risk factor from RDF ... 136
Figure 6.10: The generated sample Tuberculosis BN ... 141
Figure 6.11: Sample set of Tuberculosis CPT ... 142
Figure 6.12: A resource to specify impossible combination ... 143
Figure 6.13: The IDR ontology structure of tuberculosis in Indonesia ... 149
Figure 6.14: The IDR rules of tuberculosis in Indonesia ... 150
Figure 6.15: The IDR ontology structure of tuberculosis in China ... 150
Figure 6.16: The IDR rules of tuberculosis in China ... 151
Figure 6.17: SPARQL query result for TBINS ... 153
Figure 6.18: The generated BN for TBINS ... 153
Figure 6.19: The backend encoding for unknown individual that is shared between smoking and HIV sub-classes ... 154
Figure 6.20: SPARQL query result for TBCHN ... 154
Figure 6.21: The generated BN for TBCHN ... 155
Figure 6.22: Capture from the BN-Builder algorithm console that showing the number of impossible combinations ... 160
xiv
TABLE OF TABLES
Table 1.1: Top 20 leading causes of DALYs globally in 2015 [1] ... 1
Table 1.2: Incidence report of infectious diseases in 2014 per WHO region (in millions) [2] ... 2
Table 1.3: The number of preventable deaths in EU countries in 2013 (infectious disease mortality only) ... 2
Table 2.1: Search aim and keys submitted to the academic repositories, and the resulting articles ... 19
Table 2.2: Search aim and keys submitted to the non-academic repositories, and the resulting articles ... 19
Table 2.2: Summary of risk prediction approaches and techniques ... 21
Table 2.3: Summary of articles about predictor model of infectious disease risk prediction ... 24
Table 3.1: The infection drivers summarized from [13] ... 37
Table 3.2: Retrieved articles that contain the risk quantifications ... 42
Table 3.3: An example of a table for calculating the magnitude of a risk factor (i.e. contingency table) ... 46
Table 3.4: Summary of disease-related knowledge representations from articles published from 2008 until mid-2018. ... 50
Table 3.5: A list of the found ontologies ... 55
Table 3.6: A CPT example of a generated SSBN... 77
Table 4.1: The reused concepts from existing ontologies ... 83
Table 5.1: Extract of the collation table (2 of 234 human existing infectious diseases) ... 100
Table 5.2: Ontology encoding of infection drivers into the main classes of IDR generic ontology [13] ... 101
Table 5.3: The IDR rule types and their encoding examples ... 109
Table 5.4: Selection of infectious diseases for evaluation ... 115
Table 5.5: The coverage of the infectious diseases selected for the evaluation based on the reservoir types, transmission modes and the risk factor categories. ... 116
Table 5.6: Descriptions of the case-control studies used for evaluation ... 116
Table 5.7: The IDR rule types usefulness ... 118
Table 5.8: Summary of the number of IDR rules for each knowledge-base. ... 119
Table 5.9: The used individuals in IDR generic ontology ... 122
Table 5.10: The summary of the completeness evaluation ... 124
Table 6.1: First option of the network intermediate representation ... 132
xv
Table 6.3: Sample components of intermediate representation of the sample rules in
Figure 6.5 ... 135
Table 6.4: Coverage of test cases ... 147
Table 6.5: The declarative risk knowledge encoded in TBINS and TBCHN ... 148
Table 6.6: The coverage of each test case ... 151
Table 6.7: Explanation Table of IDR rules in TBINS ... 156
Table 6.8: The correctness test of the TBINS ... 157
Table 6.9: Explanation Table of IDR rules in TBCHN ... 160
xvi
ABBREVIATIONS
AHID Atlas of Human Infectious Diseases AIDS Acquired Immunodeficiency Syndrome ANN Artificial Neural Networks
API Application Programming Interface
ASP Answer Set Programming
BFO Basic Formal Ontology
BKB Bayesian Knowledge-base
BN Bayesian Network
CARRE Cardiorenal Risk Factor Ontology
CDC Centre for Disease Control and Prevention
CPT Conditional Probability Tables
DALY Disability-adjusted life year
FCM Fuzzy Cognitive Maps
GPS Global Positioning System
HIV Human Immunodeficiency Virus
HPV Human Papillomavirus
IDO Infectious Disease Ontology
IDR Infectious Disease Risk
KB Knowledge-base
LR Logistic Regression
OBO Open Biomedical Ontologies
OntoQA Ontological Quality Assessment
OR Odds Ratios
OWL Web Ontology Language (WOL), an honor for William A. Martin’s knowledge representation project named One World Language (OWL)
PKB Probabilistic Knowledge-base PRM Probabilistic Relational Model
PROSPECT-IDR Personalized Prediction of Infectious Disease Risk
PR-OWL Probabilistic – OWL
RDF Resource Description Framework
RR Relative Risk
SARS Severe Acute Respiratory Syndrome
SEIR Susceptible – Exposed – Infected – Recovered
SN Semantic Networks
SIRS Susceptible – Infected – Recovered – Susceptible SPARQL SPARQL Protocol and RDF Query Language
STI Sexual Transmitted Infections
SWRL Semantic-web Rule Language
TB Tuberculosis
UNSD United Nations Statistics Division
URL Uniform Resource Locator
WHO World Health Organization
XML Extensible Markup Language
1
1.
INTRODUCTION
1.1 Background
[image:17.595.167.462.322.659.2]Infectious disease is a major cause of human morbidity. The measure of human morbidity is disability-adjusted life year (DALY). DALY is a measure of overall disease burden, expressed as the number of years lost due to ill-health, disability or early death [1]. Global leading causes of DALYs for the year 2015 are shown in Table 1.1. The items in bold letters are top five infectious diseases listed in top 20 leading causes: lower respiratory infections (e.g. pneumonia), diarrheal diseases (e.g. cholera), HIV/AIDS, tuberculosis, malaria, from which it is clear that infectious disease is a significant cause of morbidity even though it is not the first rank cause.
Table 1.1: Top 20 leading causes of DALYs globally in 2015 [1]
Rank Cause % DALYs
0 All Causes 100.0
1 Ischaemic heart disease 7.2
2 Lower respiratory infections (e.g. pneumonia) 5.3
3 Stroke 5.2
4 Preterm birth complications 3.8
5 Diarrhoeal diseases (e.g. cholera) 3.2
6 Road injury 2.8
7 Chronic obstructive pulmonary disease 2.7
8 Diabetes mellitus 2.6
9 Birth asphyxia and birth trauma 2.5
10 Congenital anomalies 2.4
11 HIV/AIDS 2.4
12 Tuberculosis 2.1
13 Depressive disorders 2.0
14 Iron-deficiency anaemia 2.0
15 Back and neck pain 1.9
16 Cirrhosis of the liver 1.6
17 Trachea, bronchus, lung cancers 1.5
18 Malaria 1.4
19 Kidney diseases 1.4
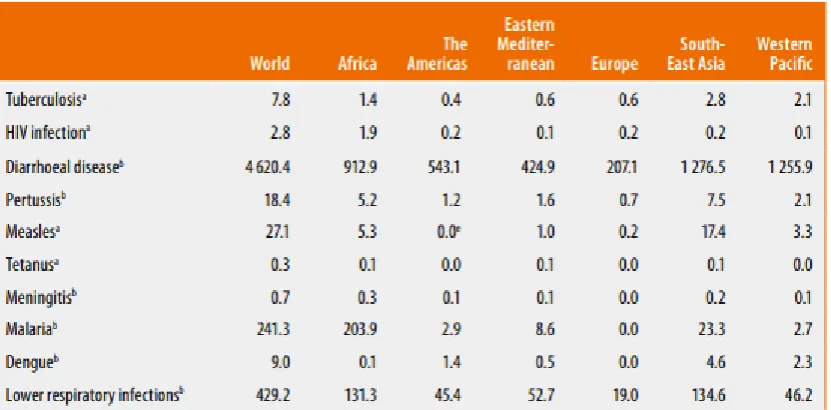
20 Self-harm 1.4
2 lower respiratory infections (e.g. pneumonia), and malaria. Second, based on the incidence distributions across WHO regions, infectious diseases are spread worldwide: diarrheal disease, and lower respiratory infections. Also, there are infections that are predominant in specific regions (e.g. malaria, dengue fever).
Table 1.2: Incidence report of infectious diseases in 2014 per WHO region (in millions) [2]
[image:18.595.76.492.180.385.2]Though infectious diseases are a major cause of human morbidity, they are largely preventable. In 2013, 47,480 deaths in European countries were considered preventable through better public health interventions (see Table 1.3).
Table 1.3: The number of preventable deaths in EU countries in 2013 (infectious disease mortality only) Infectious Diseases Number of preventable deaths
Selected invasive bacterial and protozoal infections 12,593
Tuberculosis 2,725
Hepatitis C 3,057
HIV 3,825
Influenza (including swine flu) 1,190
Pneumonia 24,090
3 geo-location), (2) mechanism to yield infectious disease risk prediction based on the submitted attributes, (3) the prediction should be based on recent knowledge, (4) the personalized recommendations that depends on the predicted infectious disease risk. Quantitative prediction techniques are widely available to achieve the second element, including (infectious) disease risk modelling [3]–[5], (infectious) disease risk factor analysis [6]–[8], and (infectious) disease outbreak prediction based on geo-location [9]. However, attention needs to be paid to developing a holistic framework that captures the role of the disease risk factors, from demography, behavioral risk factors, land use and
atmospheric factors. At the same time, there is still considerable room for communicating with domain experts and users with the aim to improve the prediction modelling [10]. By involving communication with domain experts, up-to-date knowledge can be acquired and documented (this is relevant to the third element). As research in infectious diseases develops, a repository of the acquired knowledge needs to be updated, so the knowledge is relevant to the current predicted infectious disease risk [11]. Thus, a knowledge repository (i.e. knowledge-base) that is able to store infectious disease knowledge that is continuously updated by experts is an essential component.
From the general epidemiology theory for human infectious diseases [12], the risk of human infection is affected by the pathogens that emerge in an environment where the person lives, and the immunity level when the person is exposed to the pathogen. Some pathogens are weather-dependent or found in a specific location feature (e.g. vegetation) [13]. Through communication with users, detailed personal attributes (e.g. gender, habit) can be obtained to personalize the infection risk information (this can be used to answer the first element). Also, users’ geolocation can be gathered to retrieve the weather and the surrounding location feature to infer the infections on that day at that location [9] [14]. From the envisaged framework, an example query asking for the personalized information from an individual is “what is my risk of contracting tuberculosis here now?” and (for future research) “what precautions should I take to reduce the predicted tuberculosis risk?”.
4 on the concept of here [9], [15]. Weather-related APIs (e.g. OpenWeather) provide atmospheric conditions of a city in a country at a given date and time, this can be used to expand on now in the query above [16]–[18]. WHO reports can be used to give the latest tuberculosis incidence in here [19]. The basic personal attributes are required to be submitted by the users to explain my.
To sum up, the background of this thesis is in public health and epidemiology, and, to be more specific, is epidemiology of human infectious diseases. Meanwhile, in the context of computer systems, the thesis background is in knowledge representation, (infectious) disease risk prediction systems, and personalization systems.
1.2 Motivation
Started by a concern about infectious disease burden in the world, informing lay people about their personal infection risk is achievable through designing a framework (e.g. system, service) that allows communication with both experts and the users (whose risk are being predicted) and capable of predicting the infectious disease risk based on the weather, location, personal attributes, and recent knowledge.
In the public health area, there is a type of study (i.e. case-control study) that provides knowledge about risk of an infectious disease along with a measure of the extent to which a person with observed attributes is at risk relative to a baseline case (e.g. odds ratio) [20]. The output of case-control studies is the risk factors, along with their odds ratios, for the observed population. The output of such studies can be used to inform lay people about their infectious disease risk (see Figure 1.1).
5
Figure 1.1: Extract of an output of a case-control study for tuberculosis in African population [21]
Besides encoding from published case-control studies, broader and deeper understanding of the related infectious disease risk knowledge can be acquired directly from experts (e.g. epidemiologists). Another motivation of this thesis is to facilitate more than one epidemiologists to encode their knowledge. Thus, the designed knowledge representation is intended for to be a generic approach, which can later be instantiated for each infectious disease. Each infectious disease will contain detailed risk factors and ratios that are specific for that particular condition in a certain environment context.
Queries: my TB risk
here now
Result: Personalized
TB Risk Prediction
Clients
The Epidemiologist(s) The Knowledge Engineer
Knowledge Representation
that encodes infectious disease risk factors and
their odds ratio
Encode (input and
update) the Infectious Disease Risk Knowledge
(a)
Manage the contradicting
or duplicating Infectious Disease Risk Knowledge
(b)
Case-control studies: risk factors and odds ratios
are encoded
6 Since it is possible to have conflicting (contradicting or duplicating) knowledge across the experts, a knowledge manager is then required to resolve the conflicting knowledge by using prioritization. The illustration of the incorporated roles and the personalized query is shown in Figure 1.2.
The following paragraphs outline the gap that this research aims to fill which motivates this research. The existing knowledge representations (e.g. IDO [22], IDOBRU [23], IDOSchisto [24]) related to infectious diseases and risk factors do not allow the odds ratio encoding. Other knowledge representations for non-infectious disease risk factors such as CARRE [25], ORC [26], HEPO [27] are available, but, these ontologies do not provide a placeholder to put the odds ratio to be bound with the represented risk factors. Another form of knowledge representation, rules [28], [29], allows (1) the binding of numerical variables (e.g. odds ratios, prevalence values) with risk factors in the context of causal relationships, and (2) the priority encoding for each piece of knowledge. From studies carried out for this thesis (explained in section 3.2), there is no form of knowledge representation that represents the infectious disease risk knowledge and allow the experts to encode their knowledge and update it as the knowledge develops.
To get kinds and characteristics of the infectious disease risk knowledge to be encoded in the knowledge representation, a study of the Atlas of Human Infectious Diseases (AHID) [13], the Center for Disease Control and Prevention (CDC) [30], and the World Health Organization (WHO) [31] is conducted. The (infectious) disease risk factors are usually presented as categorical variables: nominal, ordinal, and binary. Meanwhile the odds ratios are presented as numeric with certain meaning of range [32]. Approaches that represent the knowledge and calculate the risk probability are available (e.g. Probabilistic-OWL [33], BayesOWL [34], [35], BNTab [36]). These approaches provide the ontology modelling and calculate the risk using a Bayesian Network technique. But, since these approaches are not specially built for infectious disease risk knowledge encoding, they only provide binary encoding. The detailed explanation of the investigation results will be given in section 3.3. These approaches cannot handle odds ratios to be involved in the conditional probability table population.
7 (FCM) [37], [38], Bayesian Networks (BN) [3], [39], Logistic Regression (LR) [40], [41]). Knowledge about infectious disease risk factors has characteristics (mix between nominal, ordinal, binary states) which are compatible with the BN technique. A version of Bayes chain rule [42], [43] is available to be utilized. However, none of the existing algorithms populate a CPT by utilizing this version of Bayes chain rule. A detailed explanation of each risk prediction model will be elaborated in section 2.2.1.
Taking all previous into consideration, a knowledge-base that (1) represents infectious disease risk knowledge (as in Figure 1.1), (2) allows infectious disease risk prediction, (3) is usable by the epidemiologists and manageable by knowledge manager continuously as the knowledge develops (illustrated in Figure 1.2), is the goal of this thesis.
1.3 Research Questions
The research question posed in this thesis is,
‘can a useful knowledge representation be designed to encode infectious disease risk knowledge, and can this the encoded knowledge be correctly availed of to yield personalized infectious disease risk prediction?’
1.4 Objectives and Goals
In answering the research question presented in the preceding section, the main goal of the useful knowledge representation is that it -
G1. allows epidemiologists to encode infectious disease risk knowledge continuously as the knowledge develops.
G2. can be availed to yield personalized infectious disease risk prediction. To achieve those main goals, the objectives of this thesis is
O1. to comprehend the characteristics of the infectious disease risk knowledge that are relevant to predict a person's infectious disease risk from declarative knowledge sources (e.g. AHID [13], CDC [30], WHO [31]).
8 O3. to search and review the state of the art of knowledge representation specific
for (infectious) disease knowledge.
O4. to design a form of knowledge representation that fits the knowledge characteristics and meets the goals G1 and G2.
O5. to evaluate the consistency between the resulting personalized infectious disease risk prediction and the encoded knowledge.
As a placeholder of the knowledge representation and the needed tools, a system is also designed in this thesis that,
G3. facilitates the clients to submit their personal queries and personalize their infectious disease risks
G4. facilitates the knowledge manager to resolve the conflicting knowledge (e.g. contradicting and duplicating)
G5. retrieves relevant contexts from live data sources (e.g. APIs) and disease morbidity from WHO reports
However, since the main focus of this thesis is the form of the knowledge representation that is capable of encoding infectious disease risk knowledge which allows risk prediction, thus, the design of the system that utilizes the knowledge-base and allows communication to the experts and the clients is adequate. Therefore, the system development is not included in this thesis.
1.5 Contribution to the State of the Art
This thesis proposes a contribution, a format of knowledge representation that allows domain experts to continuously encode the knowledge related to a personalized infectious disease risk prediction. The form of knowledge representation is published in a a conference proceeding and uploaded to the Open Science Framework repository (see Appendix 4 for early development and Appendix 7 for the later version). Together with
9 with the other components (e.g. APIs) to serve personalized requests from clients. The request is to calculate a person’s risk of contracting of an infectious disease at a time at a certain place. The system also facilitates a knowledge manager to resolve conflicting knowledge as the epidemiologists continuously update the knowledge-base. We call this system PROSPECT-IDR (Personalised Prediction of Infectious Disease Risk).
1.6 Methodology
To answer the research question posed in section 1.3 and achieve goals listed in section 1.4, this section explains how this research is conducted. Basically, this section is an elaboration of the objectives listed in section 1.4.
The contexts of this thesis are infectious diseases, risk prediction, knowledge representation, and personalization. To retrieve existing research, projects, apps, web services in these contexts, a search on the peer-reviewed article repository, and app and web stores is conducted. For the journal repository search, the relevant topics are
infectious disease informatics, public health informatics, global health informatics, computational epidemiology, and digital epidemiology. The search results are then analyzed based on two focuses: (1) the risk prediction techniques that they use, and (2) how they model their risk factors (i.e. predictors). Any related data stores (e.g. APIs, reports, patient admission records) that may be reused for the system are also investigated during this search.
10 search in journal and knowledge repositories is conducted with specific key search on ‘disease’. The search aims to find the concepts, objects, or structure of existing knowledge representation that can be reused partially or wholly.
The next part of the research question is whether the knowledge representation is usable by the epidemiologists. To make this knowledge representation usable, a user interface that facilitates inputting knowledge into the knowledge representation is designed. The characteristics of the epidemiological knowledge are represented as input controls of the user interface. The process of inputting knowledge details obtained from case-control studies is then designed as features in the user interfaces.
The last part of the research question is whether the encoded knowledge can be correctly availed to yield personalized infectious disease risk prediction. This part of the question adds another focus to the knowledge representation search by investigating a way or a tool that allows the encoded knowledge to support the infectious disease risk prediction. The system that serves the personalized queries from clients asking for their infectious disease risk prediction, PROSPECT-IDR, is then designed. In this system design, the reusable and relevant data sources that were obtained, the forms of knowledge representation and the prediction techniques that were reviewed, the facilitations of the communication to experts, knowledge manager and clients, are all included. At this stage, a decision of the risk prediction technique that meets all requirements is made. Following this decision, the form of knowledge representation that is compatible with the risk prediction technique is chosen. Two involving activities: time to encode knowledge, and prediction time, are also described at this stage.
11 found in the infectious disease risk knowledge are the main focus of the tool development. Evaluation cases (in the form of a knowledge-base) are intentionally built (including the
contradicting and duplicating knowledge) with aim to test the consistency of the resulting infectious disease risk prediction with the encoded knowledge, and the ability to handle different priority levels that are set by the knowledge manager to resolve the conflicts. The outcome of the PROSPECT-IDR as a holistic system is the infectious disease risk prediction that is personalized based on personal attributes (including the inferred environment condition at a time in a place). The correctness of the resulting personalized infectious disease risk prediction can be evaluated using reliability testing [43]. However, the infectious disease risks depend on the quality of the case-control studies’ outputs (risk factors, and the associated risk ratios). The better the case-control studies were researched, the more qualified the risk factors and odds ratios that are encoded in the knowledge-base, thus, the more reliable the infectious disease risk prediction. However, the tool that is designed in this thesis only makes sure that the resulting risk prediction results are consistent with the encoded knowledge in the designed form of knowledge representation. This means that the tool is not responsible for the quality of the encoded knowledge which can impact the reliability of the end results. Therefore, even though a reliability evaluation for the risk prediction results is related, this evaluation is not included in this thesis. An article that evaluates the reliability of the resulting infectious disease risk prediction for three infectious diseases prevalent in three different countries has been submitted to a journal. See Appendix 6 to read this submission.
1.7 Thesis Overview
The preceding section described the thesis methodology that covers review of the state-of-the-art, design and evaluation of the knowledge representation (including the required tool). The search related to literature, apps, web services, projects, forms of knowledge representation resulted in two thesis chapters.
12
Chapter 3 describes the domain knowledge that explains how a person is at risk of an infectious disease based on personal and environment risk factors. This kind of knowledge is available in epidemiology for infectious diseases provided by CDC. Thereafter, the reviews of the disease knowledge representations are discussed and reviewed. Other articles about the risk prediction models that also serve as knowledge-base, or a knowledge-base that also models probabilistic knowledge are investigated. Advantages and limitations for each model are outlined in this chapter. An example of declarative infectious disease risk knowledge is also shown in each model with aim to give a fair comparison for the discussion.
From the state-of-the-art review chapters above, data sources, forms of knowledge representation, the way the projects, web services, systems, proposals, or apps model their predictors and their prediction techniques were gathered. The relevant features or concepts were taken for inspiration to create the components of PROSPECT-IDR system.
Chapter 4 explains the influences taken from the literature review chapters (chapter 2 and 3) to design the PROSPECT-IDR system. All required data sources and components are described in this chapter. The system is designed to achieve goals G3 to G5 in section 1.4. In this chapter, the explanation about decisions of the knowledge representation and the risk prediction technique that fit the system is elaborated. The further details of the knowledge representation are elaborated in chapter 5.
Taking two decisions made in chapter 4, the design and evaluation of the covered components are elaborated in chapter 5 and chapter 6 as the main chapters of this thesis.
Chapter 5 describes the design of the form of knowledge representation that encodes the infectious disease risk knowledge taken from declarative knowledge sources (e.g. AHID, WHO, CDC). The form of knowledge representation is designed to allow the encoded knowledge to be used for predicting personalized infectious disease risk using the chosen risk prediction technique. In the evaluation, knowledge of several infectious diseases prevalent in several countries is encoded in the designed knowledge representation. This encoding activity aims to test the usefulness and completeness of the initial design of the knowledge representation.
13 make sure the consistency of this algorithm, test cases (i.e. knowledge-bases) that touch the boundaries of the requirements (including conflicting knowledge) are chosen. Thereafter, the algorithm is executed to transform the encoded knowledge into a BN. The resulting BN and the encoded knowledge are then compared and analyzed whether they are consistent or not.
14
2.
STATE OF THE ART –
INFECTIOUS DISEASE RISK PREDICTION SYSTEM
This chapter reviews the state of the art in infectious disease risk prediction systems, focusing on context-specific and personalized prediction. This chapter describes projects, apps, ongoing research that is related to infectious disease risk prediction and personalization. This chapter informs us about the basic definition and typical research in "personalization", "infectious disease" and "risk prediction" in the context of the areas of medicine and computer science. The domains that cover this kind of research are
Computational Epidemiology, Public Health Informatics, Infectious Disease Informatics, Digital Epidemiology, and Global Health Informatics. The review yields the prediction models that are usually used for (infectious) disease risk prediction, the kind of the inputs and outputs for each model, and what kind of data in what form is available for person and environment modelling relevant to (infectious) disease risks.
Together with the following chapter (chapter 3 – the domain knowledge and its representation), the prediction models and obtainable data found in this chapter will influence the design decisions (explained in chapters 4, 5, and 6).
2.1 Definition of Personalized Infectious Disease Risk Prediction System
Based on the Merriam-Webster dictionary, prediction is an act to declare or indicate in advance; foretell on the basis of observation, experience or scientific reason [44].
15
Figure 2.1: Distribution across subject areas of articles in Scopus containing “risk prediction” terminology
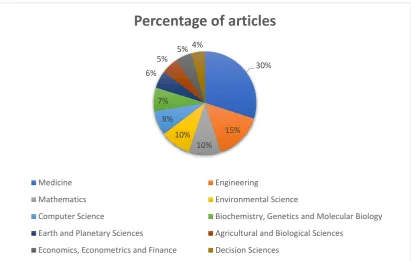
Infectious disease risk prediction is a risk estimation of specific infectious disease for individuals. In medicine, the subject area of this research, most risk prediction articles focus on finding predictors of disease risk using data mining approaches and measure how precise and accurate the prediction results are against real observations (i.e. ‘ground truth’) [46], [47], [48] either using historical data [4], [49]–[52] or rare events which are largely unknown [47], [53], [54]. Usually, they predict the mortality rate [46], or the probability of an event, such as suicide [55], contracting a disease [4], [50]–[52] or prematurity [54].
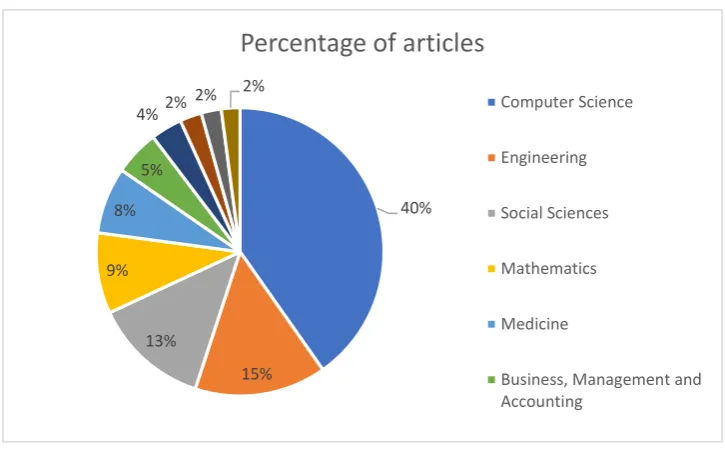
The term personalized or individualized in general domains mean to make personal or individual, or tailor something to suit the individual needs [56]. Based on Scopus search using “personalization” keyword, the percentages of the subject areas that contain this term are presented in Figure 2.2. The figure shows that articles on personalization are common in computer science (40%) and medicine (8%), the subject areas of this research.
30%
15% 10% 10% 8% 7% 6%
5% 5% 4%
Percentage of articles
Medicine Engineering
Mathematics Environmental Science
Computer Science Biochemistry, Genetics and Molecular Biology
Earth and Planetary Sciences Agricultural and Biological Sciences
16
Figure 2.2: Distribution across subject areas of Scopus articles matching “personalization”
Personalization in medicine is a model that allows customization of health-care to the individual person by use of genetic, proteins, personality traits, behavior, environment or other information to prevent, diagnose, and treat disease using therapy [57]–[61].
Personalized medicine is able to improve the safety of patients [62], reduce unnecessary expenses for medical procedures by providing early diagnosis and optimal therapies (e.g. for cancer, and diabetes cases) [63], or help avoiding adverse drug reactions [64]. Mostly,
personalized medicine yields the same outputs for the same users with the same characteristics, or for different users with the same characteristics (e.g. hyper-tailoring) [65]. Therefore, the concept of personalization is centralized to the user’s attributes. Even though personalized medicine for cancer or diabetes started in 2005, personalized medicine for infectious diseases is first mentioned in 2016 [14], [66]. This late issue of personalized for infectious disease is caused by the complexity of the predictors. Personalized medicine for cancer or diabetes is mostly researched from the genetic and risky habits, thus, the predictors in the personalization model are almost known. Whereas, a person’s risk of contracting of infectious diseases are determined by the ‘invisible’ variable: the pathogen (e.g. virus, bacteria) which the emergence only known when there are reported incidences in the area. Some of the pathogen survival depends on the availability of the reservoir (e.g. nature, land use), and the climate (e.g. weather, season). Besides that, the host (e.g. human, animal) attributes also have certain ‘role’ in infection
40%
15% 13%
9% 8%
5%
4% 2% 2%
2%
Percentage of articles
Computer Science
Engineering
Social Sciences
Mathematics
Medicine
17 risk [14]. Host susceptibility is affected by the host’s immunity level which is, in turn, influenced by weather, genetic factors, demographic factors, behavior, or pre-existing illness [66], [67].
These personal and environmental risk factors become the definition of an extended personalization concept. The personalization is not only focused on the user attributes but also the environment (e.g. weather and location) of the user. This extended personalization definition was used to search for articles that relate to the PROSPECT-IDR system developed for this research.
2.2 Existing Research on Infectious Disease Risk Prediction and its Predictor Modelling
In order to find state of the art in personalized infectious disease risk prediction systems, the first step was to identify relevant domain topics. These were gathered from the titles of journals, conferences, and book chapters; the names of laboratories, research centers, and course disciplines at the intersection between informatics, computer science, public health, and (infectious) diseases. The following domains recurred in multiple titles:
computational epidemiology, public health informatics, infectious disease informatics, digital epidemiology, and global health informatics.
Computational epidemiology is a multidisciplinary field that harnesses computer science, mathematics, geographic information science and public health to understand the spread of (infectious) diseases, or human behavior patterns that contribute to (infectious) disease risk [68].
18
Infectious disease informatics is a multidisciplinary field of science that is extended from research on the public health laboratory data to find potential infectious disease vectors and more robust to surveillance and computational of epidemiological factors. This domain is intersected with computational epidemiology and public health informatics but have more focus at vectors of infectious diseases [72].
Digital epidemiology is epidemiology that uses digital data to find the patterns (using machine learning) which are used to understand and mitigate or preventing the disease. The source of the data generation can be from inside, or outside the public health system in a region [73].
Global health informatics is a multidisciplinary field between computer science, medicine, engineering, public health, policy, and business that aims to improve healthcare systems and outcomes. Admittedly, the global health informatics focus on specific vector-borne diseases (e.g. Ebola, zika) in specific region.
Having identified the relevant domains, search queries were submitted to two types of repository: (1) repository of established mobile or web apps (including the general-purpose search engines such as Google, app store, and web store). The resulting information from this kind of research is usually used to find the terminologies, general concepts, and current technology which may not registered to peer-reviewed publications, (2) repository of scientific articles (mainly referred from index citation database, such as Scopus); the results from this repository usually follow a valid research methodology and thus the information is more credible and qualified as the basis of the state-of-the-art of this research.
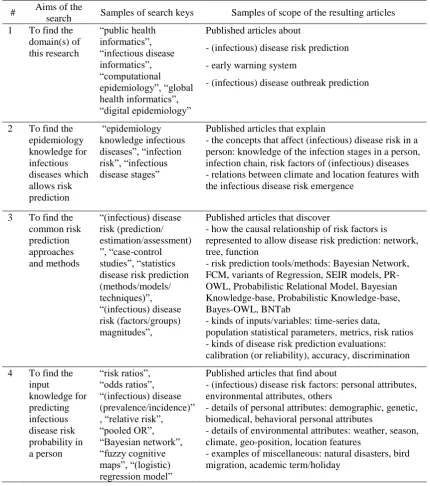
The search keys used to obtain the supporting articles for this chapter are presented in
19
Table 2.1: Search aim and keys submitted to the academic repositories, and the resulting articles
# Aims of the
search Samples of search keys Samples of scope of the resulting articles 1 To find the
domain(s) of this research “public health informatics”, “infectious disease informatics”, “computational epidemiology”, “global health informatics”, “digital epidemiology”
Published articles about
- (infectious) disease risk prediction
- early warning system
- (infectious) disease outbreak prediction
2 To find the epidemiology knowledge for infectious diseases which allows risk prediction “epidemiology knowledge infectious diseases”, “infection risk”, “infectious disease stages”
Published articles that explain
- the concepts that affect (infectious) disease risk in a person: knowledge of the infection stages in a person, infection chain, risk factors of (infectious) diseases - relations between climate and location features with the infectious disease risk emergence
3 To find the common risk prediction approaches and methods “(infectious) disease risk (prediction/ estimation/assessment) ”, “case-control studies”, “statistics disease risk prediction (methods/models/ techniques)”, “(infectious) disease risk (factors/groups) magnitudes”,
Published articles that discover
- how the causal relationship of risk factors is represented to allow disease risk prediction: network, tree, function
- risk prediction tools/methods: Bayesian Network, FCM, variants of Regression, SEIR models, PR-OWL, Probabilistic Relational Model, Bayesian Knowledge-base, Probabilistic Knowledge-base, Bayes-OWL, BNTab
- kinds of inputs/variables: time-series data,
population statistical parameters, metrics, risk ratios - kinds of disease risk prediction evaluations: calibration (or reliability), accuracy, discrimination
4 To find the input knowledge for predicting infectious disease risk probability in a person “risk ratios”, “odds ratios”, “(infectious) disease (prevalence/incidence)” , “relative risk”, “pooled OR”, “Bayesian network”, “fuzzy cognitive maps”, “(logistic) regression model”
Published articles that find about
- (infectious) disease risk factors: personal attributes, environmental attributes, others
- details of personal attributes: demographic, genetic, biomedical, behavioral personal attributes
- details of environmental attributes: weather, season, climate, geo-position, location features
[image:35.595.97.528.88.575.2]- examples of miscellaneous: natural disasters, bird migration, academic term/holiday
Table 2.2: Search aim and keys submitted to the non-academic repositories, and the resulting articles
# Aims of the
search Samples of search keys Samples of scope of the resulting articles 1 To find current
information technology related to infectious disease risk prediction
“public health risk monitoring (mobile/web) application”, “(infectious) disease risk prediction system”, “expert system (infectious) disease risk estimation projects”
20 The search results of the queries listed in Table 2.1 and Table 2.2 are then used in section 2.2.1 and 2.2.2. The results are either scientific articles or web pages that explain certain web services, apps, or projects that exist or in development or planned. Some of the projects in Table 2.1 and Table 2.2 are reviewed below.
The VBD-AIR tool [74] enables the user to explore the interrelationships among distributions of vector-borne infectious diseases (malaria, dengue, yellow fever and chikungunya) and international air service routes to quantify seasonally changing risks of vector and vector-borne disease importation and spread by air travel. It uses Climatic Euclidean Distances (CEDs) to measure similarity in climatic regime between one airport and another. The incorporated atmospheric attributes are rainfall (r), temperature (t) and humidity (h) recorded for each airport location for each month. From this tool, the current research adopted way of retrieving atmospheric attributes from weather API.
HealthMap [75], [76] is an internet-based system designed to collect and display information about new infectious disease outbreaks according to geo-location, time, and infectious agents. HealthMap integrates outbreak data from multiple electronic sources such as UN data, news websites, WHO and CDC websites.
The AIME.Life (Artificial Intelligence in Medical Epidemiology) project [9] aims to predict dengue outbreak 3 months in advance based on geo-position and date/time, by incorporating public health data, weather, and geographical data. Both HealthMap and AIME.Life projects are using Google Map APIs as a geo-position locator; their way of converting the geo-position into location for other purposes influenced the PROSPECT-IDR system. Even though this AIME.Life used the same inputs with this thesis to predict an infectious disease: geo-position, public health data, weather, and geographical data, AIME.Life does not contain the knowledge-base for infectious diseases. Thus, it cannot be replicated to other infectious diseases because it might need different knowledge and lead to different inputs.
21 from which the Dementia risk is calculated using a logistic regression model. To achieve the second aim, health care providers and practitioners are asked to communicate with each other using the provided features. From this app, features to facilitate communication with users and domain experts are adopted.
This section reviews the existing research on prediction of the infectious disease risk and the way they model the predictors. From the reviewed systems, apps, or projects, some APIs and data sources, that are beneficial to this research are adopted. The next section will review the same retrieved articles with Table 2.1 and Table 2.2 based on their risk prediction techniques.
2.2.1 Previous research related to risk prediction techniques
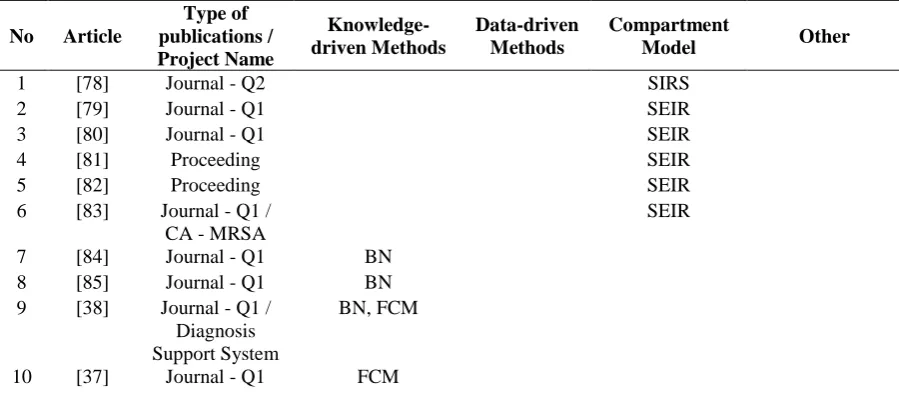
[image:37.595.87.537.547.757.2]From articles retrieved from Table 2.1 and Table 2.2, there are three approaches that are used to predict the (infectious) disease risk from person or environment models: data-driven, knowledge-driven, and compartmental model approach. The data-driven and knowledge-driven approach to classification is known in the computer science area, whereas the compartmental model appears in the public health area. A list of articles that lead to this classification can be seen in Table 2.3. Quartile Scores (Q1-Q4) are derived based on Impact Factor (IF). Q1 (high) denotes top 25% of the IF distribution; Q2 (middle-high) denotes between top 50% and top 25%; Q3 (middle-low) denotes from 75% to 50%; and Q4 (low) denotes bottom 25% of the IF distribution.
Table 2.3: Summary of risk prediction approaches and techniques
No Article
Type of publications / Project Name
Knowledge-driven Methods
Data-driven Methods
Compartment
Model Other
1 [78] Journal - Q2 SIRS
2 [79] Journal - Q1 SEIR
3 [80] Journal - Q1 SEIR
4 [81] Proceeding SEIR
5 [82] Proceeding SEIR
6 [83] Journal - Q1 / CA - MRSA
SEIR
7 [84] Journal - Q1 BN
8 [85] Journal - Q1 BN
9 [38] Journal - Q1 / Diagnosis Support System
BN, FCM
22
11 [42] Journal - Q1 BN
12 [86] Journal - Q2 BN
13 [87] Journal - Q1 BN
14 [74] Journal - Q1 / VBD - AIR
Distance-based Risk Metric 15 [77] Journal - Q2 /
CAIDE
Scoring Method
16 [88] Journal - Q1 Preference
Similarity Computation
(PSC) 17 [89],
[90]
Book Chapters Probabilistic Relational Model
(PRM) 18 [91],
[92]
Journal - Q3 Bayesian Knowledge-base 19 [93],
[94]
Journal - Q1 Probabilistic Knowledge-base 20 [33],
[95]
Journal - Q2 Probabilistic-OWL 21 [35],
[96]
Book Chapters Bayes-OWL
22 [36] Journal - Q1 BNTab
23 [97] Proceeding Generalized
Linear Mixed Model
24 [98] Journal - Q1 Logistic
Regression
25 [99] Journal – Q2 Regression
26 [100] Journal – Q2 Time Series
Regression
27 [101] Journal – Q1 Time Series
Regression
28 [102] Journal – Q1 Time Series
Regression
29 [103] Journal - Q1 Logistic
Regression
30 [104] Journal - Q2 Regression
31 [105] Journal - Q1 Citizen Scientist
Crowdsourcing
32 [106] Journal - Q1 Lomb-Scargle
Periodograms (LSP)
The example knowledge-driven approaches are (some of) Bayesian Network (BN) and Fuzzy Cognitive Maps (FCM). Other knowledge-driven approaches utilize a distance formula to measure similarity between data in the knowledge-base and data in the actual data (e.g. distance-based risk metric [74], preference similarity computation [77]). Generally, the knowledge-driven approach requires input knowledge that expresses a
23 of malaria). A basis of predictive reasoning that explains correlation between predictors and predicted object is also needed (e.g. conditional probability table for BN, adjacency matrix for FCM, and risk metric for distance-based risk metric or preference similarity computation).
Data-driven approaches to risk prediction include mostly variants of Regression, variant of Generalized Mixed Model, and (some of) Bayesian Network. The data-driven approach, essentially machine learning, requires structured data (e.g. time-series Electronic Health Record (EHR) [107], [108], sales record [85], prescription record [104]) for building the prediction model. The regression technique has two outputs: the
risk prediction model (e.g. regression equation), and the magnitude of the risk factors
(e.g. odds ratio, or r correlation).
In the epidemiology theory, a person’s risk of contracting infectious diseases is determined by the state of the health of the person at the time he is exposed to the infectious pathogen. A technique that is used to calculate the infectious disease risk is the
compartmental model. This technique categorizes human population into several compartments based on the generic infection stages: Susceptible, Exposed, Infected and Resistant [78], [101], [109]–[111] (see section 3.1.1 for details of these stages). Some implementations of this compartmental model can have a modified infection flow, for example, SIR, SIRS, SEIRS.
24
2.2.2 Previous research related to person and environmental modelling
Based on the extended definition of personalization in the context of (infectious) disease risk prediction, this thesis needs both person and environmental (climate and location) modelling. User modelling in (infectious) disease risk prediction [37], [38] includes personal attributes such as age [83], [98], race [84], [114], occupation [115], and fields specified in health records [106], [107]. These attributes can be used to determine a person’s immunity level. For example, infants and elderly are at lowest immunity level compared to adults. Other elements of the user model allow inference of the possibility that a person can be exposed to a certain pathogen through a specific transmission mode. For example, aquatic athletes are vulnerable to pathogens which live in water-related habitat or water-borne infectious diseases.
Previous articles that includes person, climate (season or weather), and location in their (infectious) disease risk prediction models were retrieved using the search keys listed in the row of Table 2.1 and Table 2.2. The collected articles from Table 2.1 are presented in rows 1-22 of Table 2.4. Whereas the collected projects, apps, or web-services from
Table 2.2 are presented in rows 23-27 of Table 2.4. Table 2.4 only includes articles that focus on infectious disease risk prediction. From these articles, the predictors of the risk prediction model are identified. The tick () symbol marks articles that model the associated column to predict the infectious disease risk. From Table 2.4, it can be seen that none article that include both person and environment (location/climate) attributes.
Table 2.4: Summary of articles about predictor model of infectious disease risk prediction
No. Article
Type of publications / Project Name
Inclusion of person attributes
Inclusion of location
or climate attributes Other predictors
1 [106] Journal – Q2
2 [80] Journal - Q1
3 [81] Proceeding
4 [82] Proceeding
5 [38]
Journal - Q1 / Diagnosis Support System
6 [83] Journal - Q1 /
25
7 [98] Journal - Q1
8 [84] Journal - Q1
9 [86] Journal – Q2
10 [87] Journal - Q1
11 [97] Proceeding
12 [88] Journal - Q1
13 [105] Journal - Q1
14 [99] Journal – Q2
15 [100] Journal – Q2
16 [101] Journal – Q1
17 [78] Journal – Q2
18 [102] Journal – Q1
19 [74] Journal - Q1 /
VBD – AIR
20 [79] Journal - Q1
21 [85] Journal - Q1 Thermometer sales
22 [104] Journal - Q2 Prescription record
Name of web serv./ app./ project
Inclusion of person attributes
Inclusion of location or climate attributes
23 [116] Healthians: Android
24 [117] Smart Health Care: Android
25 [118] Framingham Heart Disease Risk
Prediction
26 [119] Infectious Disease Advisor:
Android, iOS
27 [120] iCheqult
Published research that includes weather or season model in their infectious disease risk prediction [78], [88], [97], [99]–[102] usually make use of the data of when the disease occurred, as well as the number of disease cases to deduce what atmospheric attributes may affect the pathogen occurrence and spread of a disease by a vector. For example, a windy day accelerates the spread of air-borne infectious diseases (e.g. anthrax). Besides that, the data about the changes of the weather in a period of time (e.g. hour, day) is also observed. This kind of research usually focuses on research about person’s susceptibility which is affected by weather changes.
26 is determined by whether a person lives close to the pathogen’s reservoir, or vector’s natural habitat. For example, the natural habitat of a chikungunya mosquito’s eggs is a stagnant water pool; thus, the people who are infected are found to live near locations that contain such water-related features (e.g. lake, basin).
From Table 2.4, it can be seen that no one risk prediction article includes person, climate, and location attributes for predicting infectious disease risk. However, there are research articles that include person, climate, and location attributes in disease-related studies but are not about infectiousdisease risk personal prediction (e.g. disease outbreak prediction research, early warning system). Outbreak detection systems [9], [39], [121]–[125] do include all those attributes in their prediction models. The outputs of these articles can tell the user when and where the pathogen will be active and cause an outbreak. Some knowledge can be taken from these outbreak detection articles:
(1) Even though the possibility of contracting of an infectious disease is higher during an outbreak period, not all people living in the location of the outbreak will have the same risk of contracting the disease; the risk also depends on the person’s susceptibility level, and the transmission modes of the infectious diseases. (2) The exact GPS location of someone yields atmospheric attributes that infer
weather at a location. The weather information can be an indicator whether pathogens or vectors are active or not in a location.
(3) The sources of infectious disease data, the methods to get odds ratios and prevalence from the data, the prediction evaluation methods and risk prediction models that these articles use to predict the location of the outbreak can be reused. To be more specific, the location features can be used to identify the reservoir of a particular pathogen.
2.3 Conclusion
![Table 1.1: Top 20 leading causes of DALYs globally in 2015 [1]](https://thumb-us.123doks.com/thumbv2/123dok_us/1365375.669556/17.595.167.462.322.659/table-leading-causes-dalys-globally.webp)
![Figure 1.1: Extract of an output of a case-control study for tuberculosis in African population [21]](https://thumb-us.123doks.com/thumbv2/123dok_us/1365375.669556/21.595.101.504.435.720/figure-extract-output-control-study-tuberculosis-african-population.webp)

![Figure 3.3: The correlation between environment and infectious diseases (redrawn from [127])](https://thumb-us.123doks.com/thumbv2/123dok_us/1365375.669556/50.595.79.492.293.628/figure-correlation-environment-infectious-diseases-redrawn.webp)
![Figure 3.5: A sample of Tuberculosis brief explanation from AHID [13]](https://thumb-us.123doks.com/thumbv2/123dok_us/1365375.669556/53.595.102.505.368.647/figure-sample-tuberculosis-brief-explanation-ahid.webp)
