LEABHARLANN CHOLAISTE NA TRIONOIDE, BAILE ATHA CLIATH TRINITY COLLEGE LIBRARY DUBLIN OUscoil Atha Cliath The University of Dublin
Terms and Conditions of Use of Digitised Theses from Trinity College Library Dublin
Copyright statement
All material supplied by Trinity College Library is protected by copyright (under the Copyright and Related Rights Act, 2000 as amended) and other relevant Intellectual Property Rights. By accessing and using a Digitised Thesis from Trinity College Library you acknowledge that all Intellectual Property Rights in any Works supplied are the sole and exclusive property of the copyright and/or other I PR holder. Specific copyright holders may not be explicitly identified. Use of materials from other sources within a thesis should not be construed as a claim over them.
A non-exclusive, non-transferable licence is hereby granted to those using or reproducing, in whole or in part, the material for valid purposes, providing the copyright owners are acknowledged using the normal conventions. Where specific permission to use material is required, this is identified and such permission must be sought from the copyright holder or agency cited.
Liability statement
By using a Digitised Thesis, I accept that Trinity College Dublin bears no legal responsibility for the accuracy, legality or comprehensiveness of materials contained within the thesis, and that Trinity College Dublin accepts no liability for indirect, consequential, or incidental, damages or losses arising from use of the thesis for whatever reason. Information located in a thesis may be subject to specific use constraints, details of which may not be explicitly described. It is the responsibility of potential and actual users to be aware of such constraints and to abide by them. By making use of material from a digitised thesis, you accept these copyright and disclaimer provisions. Where it is brought to the attention of Trinity College Library that there may be a breach of copyright or other restraint, it is the policy to withdraw or take down access to a thesis while the issue is being resolved.
Access Agreement
By using a Digitised Thesis from Trinity College Library you are bound by the following Terms & Conditions. Please read them carefully.
Issues Relating to the Application of
Monolithic Tuneable Laser Diodes to Multi-
Species Gas Detection
by
Richard P. Phelan
A thesis submitted for the degree of
Doctor of Philosophy
in the University o f Dublin
Department of Physics
Trinity College
University of Dublin
Declaration
This thesis has not been submitted as an exercise for a degree in this or any other
university. The work described is entirely my own, with exception o f assistance and
the collaborative work mentioned in the acknowledgements. I agree that Trinity
College Library may lend or copy this thesis upon request.
fullJ
__________Summary
Tuneable Diode Laser Absorption Spectroscopy (TDLAS) technology for gas sensing
has had reliance on, and has benefited from, devices developed for the optical
communications sector, namely distributed feedback laser diodes. The range in
wavelengths o f available DFB lasers coincides with absorption spectra o f many gases
o f environmental and industrial interest. However, since the distributed feedback laser
diode has a narrow wavelength tuning range, only one gas can be targeted without
changing the laser. The objective o f this thesis is to advance the strategic capability
required to allow development o f TDLAS multi-species gas detection systems using
widely tuneable laser diodes recently developed for the telecommunication sector.
In this thesis, the application o f widely tuneable laser diodes and a single frequency
tuneable laser diode to trace gas detection in the near infrared region o f the spectrum
is reported.
emission wavelength o f Si and S2. We have investigated stabilisation techniques to
minimise the effect o f this cross-talk.
The application o f a sampled grating distributed Bragg reflector and modulated
grating Y-branch laser as widely tuneable sources to a multi-species gas detection was
investigated. In particular, the use o f these widely tuneable laser diodes as sources in a
multi-gas analysing system using wavelength modulation spectroscopy and second
harmonic detection o f acetylene hydrogen cyanide and ammonia has been
investigated The critical issues relevant to the application o f such widely tuneable
diode lasers to spectroscopic based high selectivity multi-gas sensing are outlined.
The general emphasis o f the work described here is not on detection limits but to
selectively detect three gases with overlapping absorption bands.
A simple and straightforward method using multiple reference gases for wavelength
characterisation and monitoring o f the spectral emission from a SGDBR is next
outlined. This method requires measurements o f the gas absorption lines, an etalon
trace and comparison o f the separations between gas absorption lines and the
corresponding separations from a database (HITRAN) to determine the emission
wavelength o f the SGDBR
The results o f the experiments reported in this thesis make a significant contribution
to advancing the capability required to allow development o f a TDLAS multi-species
sensor. In addition it has been shown that the tuning behaviour o f the SGDBR can be
characterised using a combination o f reference gases to provide unique wavelength
Acknowledgements
In the four years and that it took to complete the research presented in this thesis, it
gives me great pleasure to thank the many people who made it all possible. I am
extremely grateful for having had the opportunity to complete my thesis at Trinity
College. The excellent facilities and many brilliant people that I have encountered
here over the years have made it a most enjoyable experience.
Firstly I would like to acknowledge my supervisor Prof. John Donegan for his
continuous work behind the scenes, to create and maintain a stimulating working
environment in the semiconductor photonics group and for giving me the opportunity
to come to Trinity and complete this Ph.D.
It gives me great pleasure to acknowledge Dr Vincent Weldon and Mick Lynch, who
helped set out the goals for my research and gave constructive feedback along the
road. Their combined experience in gas sensing and photonics always formed a
reliable touchstone for new ideas to which I am indebted. The generosity with which
Vincent and Mick gave o f their time and patience went far beyond the call o f duty.
I would like to say thanks to Karl Boylan for sourcing the strongly gain coupled DFB
laser diode used in this research.
At this point, I would like to thank the members o f the group both past and present,
especially Canice, Alan, Cian, Andrea and John P who provided support in the early
feet-fmding days o f the lab. To the present group members a special thanks goes to
Torsten, Mathias, Laura, Severine, Aoran, for all the help. A special thanks to Dave
and Seve better known as ‘the Dude’, the frustrations o f life underground never
seemed quite as bad after talking to these two guys.
Thanks also to the technical staff o f the Physics Department, Dave Grouse, Mick O ’
Reilly, Ken Concannon and John Kelly.
To all my teammates from the St Judes hurling team for all the highs and lows o f
championship hurling throughout the last four years.
To my friends for putting up with me when work w asn’t going so well, thanks to
Dermot, Larry, Ken and the rest o f the gang, and especially Helen.
Publications
R. Phelan, V. W eldon, M. Lynch, and J. F. Donegan, "Simultaneous multigas
detection with cascaded strongly gain coupled DFB laser by dual w avelength operation," E lectronics L etters, vol. 38, pp. 31-32, 2002.
R. Phelan, M. Lynch, J. F. D onegan, and V. W eldon, "Investigation o f a strongly gain coupled D FB laser cascade for sim ultaneous m ultigas sensing," O ptoelectron ics, lE E P roceedin gs-, vo \. 150, pp. 182-186, 2003.
R. Phelan, M. Lynch, J. F. D onegan, and V . W eldon, "Absorption line shift with
temperature and pressure: impact on laser-diode-based H2O sensing at 1.393 |^m," A p p lied O ptics, vol. 42, pp. 4 9 6 8 -4 9 7 4 , 2003.
R. Phelan, M. Lynch, J. F. D onegan, and V. W eldon, "Investigation o f w id ely
tuneable laser diodes for spectroscopic based m ultigas sensing at 1.5 |J.m," presented at Lasers and Electro-Optics Europe, 2003. CLEO/Europe. 2003.
Table o f Contents
1 Introduction
.
.
.
.
.
.
.
.
1
1.1 Background
.
.
.
.
.
.
.
1
1.2 Thesis Overview .
.
.
.
.
.
.
4
1.3 References.
.
.
.
.
.
.
.
6
2 Principles o f Absorption Spectroscopy
.
.
.
.
.
7
2.1 Introduction
.
.
.
.
.
.
.
7
2.2 Beer-Lambert law .
.
.
.
.
.
.
7
2.3 Linestrength
.
.
.
.
.
.
.
8
2.3.1 Measuring Linestrength.
.
.
.
.
9
2.4 Spectral Lineshapes
.
.
.
.
.
.
9
2.4.1 Doppler broadening
.
.
.
.
.
10
2.4.2 Pressure broadening and shift .
.
.
.
12
2.4.3 Voigt Profile
.
.
.
.
.
.
14
2.5 Dicke Narrowing .
.
.
.
.
.
.
15
2.6 Sensitivity o f Direct detection
.
.
.
.
.
17
2.7 Modulation Spectroscopy.
.
.
.
.
.
19
2.7.1 Introduction
.
.
.
.
.
.
19
2.7.2 W M S ...20
2.7.3 F M
S ...26
2.8 References.
.
.
.
.
.
.
.
30
3 Widely Tuneable Semiconductor Lasers
.
.
.
.
.
35
3.1 Introduction
.
.
.
.
.
.
.
35
3.2 Basic Concept o f tuneable laser .
.
.
.
.
36
3.3 Wave propagation in periodic structures .
.
.
.
37
3.3.1 Distributed Bragg reflectors
.
.
.
.
38
3.3.2 Distributed feedback lasers
.
.
.
.
40
3.4 Carrier-induced index change
.
.
.
.
.
43
3.4.1 Band-filling
.
.
.
.
.
.
43
3.4.2 Band-gap shrinkage
.
.
.
.
.
43
3.4.3 Free-carrier absorption .
.
.
.
.
43
3.4.4 Temperature tuning
.
.
.
.
.
43
3.5 Extending the tuning range o f DBR-type lasers .
.
.
44
3.5.1 Vernier effect between two comb reflectors
.
.
44
3.5.2 Sampled Grating DBR .
.
.
.
.
46
3.5.3 Modulated Grating Y-Laser
.
.
.
.
49
3.6 Characteristics o f tuneable lasers for gas sensing.
.
.
51
3.6.1 Tuning Range
.
.
.
.
.
.
51
3.6.2 Spectrum and Side Mode suppression ratio
.
.
53
3.6.3 High FM/AM r a t i o ... 55
3.6.4 Spectral Linewidth
.
.
.
.
.
56
3.7 Conclusions
.
.
.
.
.
.
.
63
4 A bsorption Line S h ift with Tem perature an d P ressure Im pact on Laser D iode
b a sed H2O S ensing a t 1.393/jm 71
4.1 Introduction . . . . . . . 71
4.2 Experimental . . . . . . . 72
4.2.1 Gas c e l l ... 72
4.2.2 Laser diode . . . . . . 73
4.3 Near-Infrared Spectra o f H2O . . . . . 76
4.4 Direct-Detection Measurements . . . . . 77
4.5 Direct-Detection Results . . . . . . 78
4.6 WMS 2/measurements . . . . . . 85
4.7 WMS 2 / R e s u l t s ... 86
4.8 Conclusions . . . . . . . 89
4.9 References. . . . . . . . 90
5 Sim ultaneous M ulti-G as Sensing using a Strongly Gain Coupled D FB laser diode . . . . . . . . . 93
5.1 Introduction . . . . . . . 94
5.2 SGC-DFB D e v ic e ... 95
5.3 Near-Infrared Spectra o f Target gases . . . . 97
5.3.1 Hydrogen Sulphide . . . . . 97
5.3.2 Carbon dioxide . . . . . . 97
5.4 Experimental Details . . . . . . 99
5.5 Simultaneous detection o f H2S and CO2 . . . . 100
5.6 Feed-back control and stabilisation . . . . 104
5.7 Conclusion . . . . . . . 108
5.8 References. . . . . . . . 109
6 M ulti-Species Gas Sensing using a SG -D BR an d M G -Y laser Sensing and A bsorption Line Identification 112 6.1 Introduction . . . . . . . 112
6.2 Advanced static characterisation . . . . . 113
6.2.1 Characterisation methods to generate a frequency look-up tables . . . . . . 120
6.3 Application to gas sensing . . . . . 125
6.3.1 Experimental . . . . . . 126
6.3.2 Results . . . . . . . 127
6.3.2.1 Grating Modulation . . . . 127
6.3.2.2 Multiple-species gas sensing . . . 129
6.4 Line Identification . . . . . . 134
6.4.1 Introduction . . . . . . 134
6.4.2 Identification o f Gas Lines . . . . 135
6.5 Conclusions . . . . . . . 142
6.6 References. . . . . . . . 143
7 Conclusions . . . . . . . . 146
7.1 Overview . . . . . . . . 146
7.2 Future work . . . . . . . 148
Chapter 1
Introduction
1.1 Background
Significant demand exists for gas-sensing techniques that are fast, selective and
compact, and laser-based approaches are attractive because they offer the promise o f
meeting these criteria. For these systems, near infrared diode lasers are popular as
sources because they have the beneficial feature o f narrow linewidth, compact size,
cost-effectiveness and compatibility v^ith optical fibres, which enables convenient
alignment and multiplexing. Historically, the first measurements with diode-lasers
have been made with mid-infi’ared lead-salt devices [1,2]. Lead-salt lasers cover the 3
to 30 )o,m spectral region, which overlaps with the fundamental absorption bands o f a
number o f important molecular species. For industrial applications the use o f lead-salt
diode-lasers is limited due to the need for cryogenic cooling, occurrence o f multimode
emission and low power levels [2]. Several molecular species have absorption
features in the near infrared spectral region. Telecommunication lasers operate at near
infrared wavelengths (generally 1.5|j.m), and therefore overlap with the spectra o f
vibrational overtones, which are 10-200 times weaker than the spectra resulting from
fundamental vibrations. To compensate for these small absorption strengths, high
sensitivity detection techniques such as Frequency Modulation Spectroscopy (FMS)
and Wavelength Modulation Spectroscopy (WMS) are employed [3].
diode can lock on the unique fine structure o f the target gas absorption spectrum and
use it as a fingerprint to measure the gas absorption spectrum with high specificity
and high sensitivity [4],
Recently, industrial and private capital investment in the commercialisation o f diode
laser sensors has surged, providing an end-use for the development o f sensors in
research laboratories. The uptake o f TDLAS is currently buoyant due to the increased
availability o f single frequency laser diodes at lower cost, which is a result o f the
growth in optical fibre communications. Today diode lasers dominate the overall laser
market, representing over $1.6 billion in 2003 sales [5], as illustrated in Fig 1.1. The
majority o f these sales are in the optical storage and telecommunication industries,
comprising devices operating between 400-700 nm and 950-1600 nm respectively.
The requirements o f the telecommunication industry for devices operating near room
temperature, with a wavelength tuning, high spectral purity, long-term stability, and
compatibility with fibre-optic networks are all consistent with practical spectroscopic
absorption sensors.
Tok?cc‘’rinijr'iK:utiufi5
H
-TniiioP i c o til’O*
P b C u i i t i M t g J h *HrTfl(rnv- ti
I
M.itrrriir. prr>r<>ftB..f>3Sum-: -vj C)rr>pi
•ooo S a l e f t ( S t t iil lio n i s }
■ ___ O p iir.n l
? f x w
?o o r>
Figure 1.1 Worldwide diode-laser sales by application [5J.
nm to 1625 nm can now be used for laser transmission with reasonably low
attenuation. Therefore, telecom lasers are likely to be available over this larger
wavelength range in the near future to take full advantage o f these new fibres. Many
important gas species have transitions in this wavelength range, and thus this
extension o f telecom wavelength range can be valuable to the gas sensing community.
The current state-of-the-art in the application o f TDLAS is single species limited, due
to the narrow tune ability o f distributed feedback laser diodes, which limits detection
to a single gas. This has prevented the widespread uptake o f TDLAS technology in
multi-gas detection applications despite the strong demand and the demonstrated
TDLAS capability in respect o f single gas detection. Fortunately, the insatiable
demand for bandwidth in optical communications has driven the development o f
widely tuneable laser diodes for incorporation in optical networks as back-up systems.
This is a major growth area in optical communications technology. These single
frequency laser diodes, because they are widely tuneable, present opportunities for
applications in absorption based multi-gas sensing regime. Sampled grating
distributed Bragg reflector. Modulated Grating Y-branch and Strongly Gain Coupled
cascaded distributed feedback laser diodes, with typical tuning ranges o f 50nm, 50nm
and 15nm respectively, are examples o f monolithic integrated widely tuneable devices
developed for optical communications. Lasers in which the wavelength selection and
tuning functions are external to the semiconductor structure are not discussed here
since they are considered not compatible with the requirements for industrial
deployment. Future development o f quantum cascade lasers will bring the benefits o f
room temperature operation to the longer wavelengths that are most useful for
sensitive gas detection
Research on monolithically integrated tuneable laser diodes has a fairly long history
(more than 20 years) [6]. However until recently tuneable laser diodes were deemed
unsuitable for applications in multi-species gas sensing due to their complex control
and the stringent requirements posed on devices for gas sensing applications.
1.2 Thesis Overview
Chapter 2
provides a general introduction to absorption spectroscopy in the near
infrared region. Spectral line intensity and lineshape theories are briefly outlined.
Chapter 3
provides a general introduction to single frequency laser diodes and
monolithically integrated widely tuneable laser diodes that are available for
applications in multi-species gas sensing. The relevant physical mechanisms enabling
electronic control o f the emission frequency o f these widely tuneable lasers is next
outlined followed by the main requirements for applications in multi-species gas
sensing.
Chapter 4.
High-resolution absorption measurements o f the H
2O line in the V1+V3band at 1.3928|j,m were made in the temperature range 296K - HOOK using an
InGaAsP distributed feedback laser diode operating at 1.39|j,m. Spectral line shift as a
function o f temperature and pressure and line strength measurements on the water
vapour line and their impact on the accuracy o f optical absorption based gas sensing
has been investigated. The results obtained were compared with values obtained from
the HITRAN database and values reported in the literature for H
2O. The results,
facilitates H
2O sensing in a non-standard temperature and pressure environment.
and S2. W e have investigated stabihzation techniques to m inim ise the effect o f this cross talk.
Chapter 6 outlines the application o f a sampled grating distributed Bragg reflector and a m odulated grating Y -branch laser as a w idely tuneable source in a m ulti-species gas detection system. The use o f w idely tuneable laser diodes as sources in a m ulti-gas analysing system using w avelength m odulation spectroscopy and second harm onic detection o f acetylene hydrogen cyanide and am m onia have been investigated The critical issues relevant to the application o f such w idely tuneable diode lasers to spectroscopic based high selectivity m ulti-gas sensing are outlined. The general em phasis o f the w ork described in this chapter is not on detection lim its but to selectively detect three gases w ith overlapping absorption bands.
A sim ple and straightforward m ethod using m ultiple reference gases for w avelength characterisation and m onitoring o f a SGDBR is next outlined. This m ethod requires m easurem ents o f the gas absorption lines, an etalon trace and com paring the separations betw een gas absorption lines and the corresponding separations from a database (H ITRA N) to determ ine the em ission w avelength o f the SGDBR.
1.3 References
[1]
R.T. Ku, E.D Hinkley, and J.O. Sample, "Long-path monitoring o f
atmospheric carbon monoxide with a tunable diode laser system,"
Applied
Optics, vol. 14, pp. 854, 1975.
[2]
P. Hering, Laser in Environmental and Life Sciences: Springer, 2004.
[3]
J. A. Silver, "Frequency-Modulation Spectroscopy for Trace Species
Detection - Theory and Comparison among Experimental Methods,"
Applied
Optics, vol. 31, pp. 707-717, 1992.
[4]
V. Weldon, "Spectroscopic Based Gas Sensing using Single Frequency Near
Visible/Infrared Laser Diodes," Ph.D thesis: Trinity College Dublin, 1997
[5]
R. Steele, "Review and forecast o f the laser markets: Part II: Diode lasers," in
Laser focus world. February, 2004.
[6]
L. A. Coldren, "Monolithic tunable diode lasers,"
Selected Topics in Quantum
Chapter 2
Principles of Absorption Spectroscopy
2.1 Introduction
This chapter provides an introduction to tuneable diode laser absorption spectroscopy in the near-infrared region. This is important since, in the work described here, narrow linewidth, single frequency, wavelength tuneable laser diodes are used to target individual rotational absorption lines. The fundamentals o f absorption spectroscopy and the dominant broadening mechanisms which determine the spectral width o f absorption lines are introduced. In addition, to spectral line broadening due to collisions, collisions can also result in a narrowing o f spectral profiles. In this work two techniques for diode- laser absorption spectroscopy were used: direct absorption spectroscopy and wavelength modulation spectroscopy. Their essential characteristics and limitations will be discussed
in the following sections.
path length L (cm), the transmission coefficient t(v), according to the Beer-Lambert law, is defined as
2.2 Beer-Lambert law
When monochromatic radiation o f frequency v (cm"') passes through an absorbing gas o f
where Iq and I t are the incident and transmitted intensities, respectively. The spectral dependence o f the absorption coefficient k(v) can be expressed as
k {v) = S n ( ! ) { y ) L (2.2) where S (cm/molecule) is the spectral line intensity, and n [molecule/cm^] is the number
density o f the absorbing species. Lineshape function (j)(v) (cm) represents the probability
o f finding absorbing events between frequencies v and v + dv and satisfies the normalization condition
\^ (t> { v )d v ^ \ (2.3)
2.3 Linestrength
Specifying the maximum value o f the absorption coefficient is not a satisfactory measure o f the total absorption intensity since no inclusion o f the width o f the spectral feature is made. The intensity o f a spectral feature must therefore be specified by the area under the absorption curve over the wavelength region o f interest. The strength S, is defined as
-Hjo
^ K { v ) d v (2.4)
—CO
The line strength or line intensity is a direct measure o f the ability o f a molecule to absorb photons corresponding to a given transition. The intensities o f spectral lines depend not only on the population density o f the molecules in the absorbing or emitting level which is a function o f the Boltzmann fraction, but also on the transition probabilities o f the corresponding molecular transitions.
1
The typical units for linestrength include a pressure-dependent version, S (cm ' a t m '), and a number-density dependent version used by Hitran, S* (cm m o l'') [1, 2], For gases obeying the ideal gas law (PV=nkT), the conversion between S and S* is given by,
5 ( r ) = « , | 5 * ( r ) D ^ : ^ ^ 5 * ( r ) (2.5)
where n i is the Loschm idt’s number, and To is the absolute temperature [3]. For converting room-temperature linestrength (T=296K), the conversion is
It must be remembered that since the transition probabilities corresponding to overtone bands is much less than corresponding fundamental transitions, absorption band strengths at these overtone/combination wavelengths are significantly weaker than at fundamental wavelengths.
2.3.1 Measuring Linestrength.
The linestrength o f an absorption transition is a key parameter for designing absorption based gas sensors. Though published linestrengths are available for many molecules in the 1.5|j,m region [2, 4], there are still a considerable number o f molecules where no linestrength information is available or are often based on calculations or low-resolution measurements. Thus, high-resolution tuneable laser diodes can be used to improve linestrength estimates.
The line strength S (cm''atm'^), for a particular transition can be determined from the integrated area A o f the transition [5], divided by the partial pressure o f the absorbing species Pj and the path length L.
The integrated area is measured by scanning the emission wavelength o f the laser and measuring the transmitted light attenuation as a function o f wavelength. Thus the lineshape profile o f the absorption feature can be recorded and fitted to extract the area.
2.4 Spectral Lineshapes
Av F W H M
0> o c CC
/ 2. . o
c/3
<
V o
F r e q u e n c y ( H z )
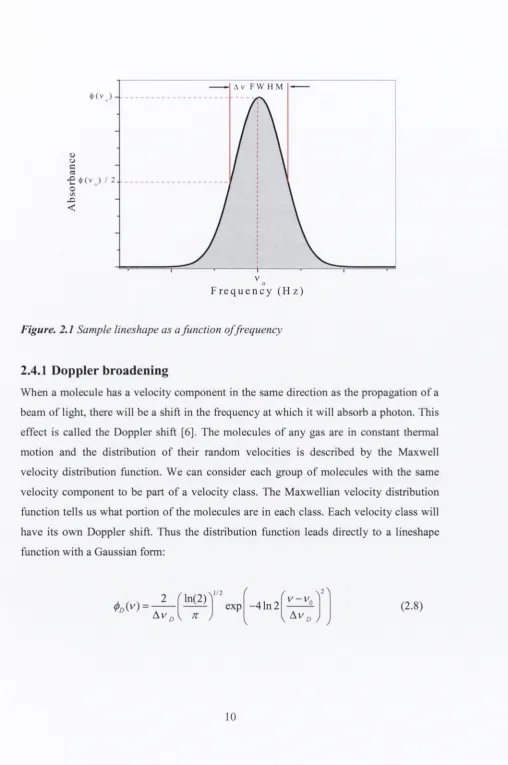
Figure. 2.1
Sample lineshape as a function o f frequency
2.4.1 Doppler broadening
When a molecule has a velocity component in the same direction as the propagation o f a beam o f light, there will be a shift in the frequency at which it will absorb a photon. This effect is called the Doppler shift [6]. The molecules o f any gas are in constant thermal motion and the distribution o f their random velocities is described by the Maxwell velocity distribution function. We can consider each group o f molecules with the same velocity component to be part o f a velocity class. The M axwellian velocity distribution function tells us what portion o f the molecules are in each class. Each velocity class will have its own Doppler shift. Thus the distribution function leads directly to a lineshape function with a Gaussian form:
, , , 2 rin(2)V .
<l)oiy) = ---- exp - 4 In2
[image:20.541.23.532.42.808.2]Where Vo is the line-centre frequency and Av£> is the Doppler full width half maximum (FW HM) linewidth.
The magnitude o f the Gaussian lineshape function at line centre is
(l>Diyo) =
D \ln2V^ K / The Doppler fullwidth (FWHM) Avd is given by
U T \ n 2 me
(2.9)
(2.10) for which a more convenient form is
Av^=Vo(7.1623xlO-’ )
— 7’(2 .11)
where T is in Kelvin and M is the molecular weight in grams/mole [7]. Fig. 2.2 illustrates the increasing Doppler width with temperature for H2O at 940nm, H2O at 1.39|j,m and CO2 at 1.39j.im. As can be seen from Fig. 2.2, thermal broadening affects H2O much more than CO2 due to the formers comparatively small mass. It affects shorter wavelengths more than longer wavelengths for the same molecule due to the frequency- dependence o f the broadening mechanism.
N X X l-L. -C ID
c
'H. a.o
Q2 .1 G
-H.O at 940nm H
□ CO .5 G
1.2G
-900.0M
600.0M
3 0 0 .0 M
[image:21.541.14.531.18.825.2]-200 400 600 800 1000 1200 1400
Temperature (K)
2.4.2 Pressure broadening and shift
It is well known that the dominant absorption line broadening mechanism at pressures
above a few tens of mbars is collision broadening. Since most optical absorption based
gas sensing is carried out at atmospheric pressure the effect of collision line broadening is
very important. Molecules in a gas are in continual motion and collide with each other at
a rate 1/Xc, which increases with gas pressure where Tc is the mean time between
collisions. Vibrational and rotational energies o f the molecules are perturbed by these
collisions, which interrupt the dipole oscillation resulting in a broadening o f the
vibrational/rotational lineshape. The largest source o f line shift is associated with energy
level shift caused by the interaction o f the molecules during elastic collisions as shown in
Fig 2.3 [8]. The collisional shift can be explained with the aid of potential curves. In a gas
mixture of atoms A and B the mutual separation R(A,B) show random fluctuations with a
distribution around a mean value R which depends on temperature and pressure.
Accordingly
co-
i^=\e
.{^R)-Ei^{^R)\lh yields a corresponding frequency distribution
around a most probable value cOik(Rm)? which may be shifted against the frequency
oJ
qof
the unperturbed atom A. The shift Aco = cOo - coik depends on how differently the two
energy levels Ej and Ek are shifted at a distance Rm(A,B) where the emission probability
has a maximum. The elastic collisions change not the amplitude, but the phase of the
damped oscillator, due to the frequency shift Aco(R) during the collision. They are often
termed phase-perturbing collisions. A pressure-broadened line has a Lorentzian profile
expressed as
<t>ciy) = -
---
^
--- T
(2-12)
where Avc is the collision FWHM and As is the pressure-induced shift [6]. Because the
collision interactions are proportional to the density of the perturbing species, Avc and As
are related to the pressure broadening coefficient, y (Hz/atm), and shift coefficient by 5
(Hz/atm), by
^ v ^ = y . P
(2.13)
AEi (R)
GOo
R
0
0
A
B
A V
CO
[image:23.541.14.529.45.771.2]where P is the perturber pressure in atmosphere. The temperature dependence of y and 5
are often modelled as
7 ( r ) o c r - "
(2.15)
5{T)azT-"'
(2.16)
where n and m are called temperature exponents [7]. Values o f n and m depend on the
absorber and perturber species and the rotational-vibrational quantum numbers.
2.4.3 Voigt Profile
In the gas pressure range between the above two cases where neither collision nor
Doppler broadening dominate, the absorption lineshape can be described by a Voigt
profile. The Voigt profile
is the convolution o f the Doppler (j)/) and the Lorentzian (j)/,
profile as indicated in the following equation,
+ 00
^v{^)=
(2-17)
-oo
For this reason, it assumes Doppler characteristics at low pressure and Lorentzian
characteristics at higher pressures. Therefore, one single expression for the lineshape can
be used throughout a wide range o f pressures. The Voigt y parameter indicates the
relative significance o f Doppler and collisional broadening, with y increasing as the
effects o f collisional broadening increase.
y = y f i ^ ^
(2.18)
Yd
The X parameter is a dimensionless measure o f the distance from line centre and is
defined as follows
defining an integral variable t as
2\l\n2{v - v \
= --- ^
(2.19)
, = (2 .20)
^ V D
V(x, >^) = — = Re[ w( x, j ' ) ] , (2.21)
n i y ^ + ( x - e )
^
The Voigt function is conveniently expressed as the real part o f the complex probability
function w{x, y). The real and imaginary parts o f the complex probability function w{x,y)
were calculated using a routine by Humlicek [9], Fig 2.4 compares the standardised
Gaussian, Lorentzian, and Voigt profiles. Note the Gaussian profile decays rapidly
(exponential) from the line centre while the Lorentzian profile decays slowly (quadratic).
Gaussian — •— Lorenztian
Voigt
0.6
-x"
>
0.2
-0.0
-1 0 •5 0 5 10
[image:25.541.25.528.73.622.2]X
Figure 2.4 Calculated lineshapes fo r Gaussian, Lorentzian and Voigt profiles (y= l).
2.5 Dicke narrowing
In addition to spectral line broadening due to phase-changing collisions, collisions can
also narrow spectral profiles [10]. Dicke first predicted the narrowing o f the Doppler
profile when he considered a radiating atom bouncing back and forth within a one
dimensional box. The mean free path (A) in this approach is equal to the box dim ension
since the atom can only collide with the walls. When the dimension o f the box is much
larger than the wavelength o f radiation (A » X) a detector on the wall observes distinct
the radiating frequencies are shifted and modulated by the frequent colHsions. If this
effect is averaged over a Maxwellian velocity distribution, the result is a normal Doppler
line with a sharp non-Doppler centre peak. The Dicke narrowing effect is also referred to
as the collisional, motional, or confinement narrowing effect.
In the presence of the Dicke narrowing effect, a lineshape may vary appreciably from the
Voigt profile. In this case the Galatry soft-collision profile [11] and the Rautian-
Sobelman hard-collision profile [11] are appropriate to facilitate the inclusion o f
collisional-narrowing effects and it is possible to extract line parameters with high
accuracy.
The model of Rautian considers that the mass o f the active molecule is much smaller than
the mass o f the perturber. This is the reason why this model is called the hard collision
model. This profile can be expressed as:
R ( x , y , z )
s Re
w( x , y + z)
(2 .22) 1-
V ^ z w( x , y + z)
where x and y have the same definition as in equation 2.21, and where z is the narrowing
parameter. This additional parameter is describing the Dicke effect and is given by
z = 2 V l n 2 - ^
A.
(2.23)
where Pc is the coefficient o f collisional narrowing [12]. Galatry has developed a model
considering that the mass o f the active molecule is much larger than the mass o f the
perturber. This profile can be expressed as:
G(x,>^,z) = - ^ R e i e x p
( - i x - y ) t + - ^ U - z t - e
[
L
2z
dt
(2.24)
where x, y and z have the same definitions as above.
The real and imaginary parts o f the complex probability function
w{x,y)
are calculated
using a routine by Humlicek [9, 13] and the calculation o f the Galatry profile according
0.5
Rautian V o ig t G alatry :
>
d
0.0
-1 0 -5 0 5 10
[image:27.541.22.535.25.834.2]X
Figure 2.5
Calculated lineshapes fo r Voigt, Galatry and Rautian profiles (fory = z
=1).
Theoretical Voigt, Rautian and Galatry profiles are compared and shown. Due to the
Dicke narrowing effect, the Rautian and Galatry profiles are narrower and sharper than
the Voigt profile. Both the Galatry and Rautian profiles collapse into the Voigt profile
when z=0.
2.6 Sensitivity of Direct detection
Typically, in a laser based gas sensing study the output o f the laser is directed through the
target gas and the transmitted light is measured as a function o f wavelength by a photo
detector. A typical detector consists o f a photodiode, which converts photons into hole-
electron pairs, and a load resistor, which converts current signals to voltage signals. The
intrinsic noises in the output voltage consist o f shot noise and thermal noise. Shot noise
originates from intrinsic random photon generation and annihilation processes in the laser
cavity [16]. If shot noise is the dominant noise source, an achievable minimum detectable
absorbance where amin is
where e is the charge on the electron, B [Hz] is the detection bandwidth, r] [A/W] is the
photodiode responsivity, Pq [W] is the incident power, and Iph [A] (= r|Po) is the
diode laser and r] = 1 A/W for a typical InGaAs photodiode). Inherent thermal noise in a
pn junction diode and a load resistor R is usually characterized by a Johnson-Nyquist
formula [17]. Detection sensitivity in the thermal-noise limit is
where T is the equilibrium temperature o f the junction. For ?o = 1 mW, r) = 1 A/W,
T = 300 K, and R = 1 kQ, a m in is ~ 4 x 10^ for a 1-Hz bandwidth. Fig 2.6 shows the
calculated amin at various incident laser power. N ote that amin decreases with increasing
incident laser power. At low power, amin is thermal-noise limited and decreases with 1/Pq.
When ?o > ImW , shot noise becomes the dominant noise source and amin scales with
1 / . For typical diode lasers with mW output power, theoretical amin is limited by the
shot noise. In practice, achievable amin is orders o f magnitude larger than the shot-noise
limited sensitivity, mainly due to a considerable ] / f intensity noise in the diode laser
output, which dominates at low frequencies in the range o f 0.1-10 MHz. Models have
been proposed to explain the 1 /f intensity noise in diode lasers, but the physical origin is
not yet clear [18].
Q
photocurrent [17]. For a 1-Hz bandwidth, amin is ~ 2 x 10 (using ?o = lm W for a typical
^j4kTRB 1 UkTB
10^
10' ’
_c
10'*
I o ’
1 0 ‘° - t - r r ™ ,... I
----lE -3 0.01 0.1 1 10
P o w e r (m W )
Figure 2.6 Calculated minimum detectable absorbance, amin, with IH z bandwidth as a
function o f laser incident power. (ri = ] A/W, T=300K, and R=1 kfl)
2.7 Modulation Spectroscopy
2.7.1 Introduction
The vibrational overtone/combination absorption line-strengths o f gases in the near-
infrared region o f the spectrum are significantly less than the fundamental line-strengths
in the mid-infrared. Hence, to measure these weak absorption signals high sensitivity
techniques known as W avelength M odulation Spectroscopy (WMS) or Frequency
Modulation Spectroscopy are required (FMS) [19-24], The key difference between these
two methods is that for FMS the modulation frequency is equal to or greater than the
absorption linewidth whereas for WMS the modulation frequency is much less than the
gas linewidth. In b rief the basic principle o f WMS, is to probe a gas absorption line
while modulating the emission wavelength o f the laser diode. The detected output is
processed by a lock-in-amplifier at the modulation frequency, f or n times the modulation
frequency w here n is an integer [25]. Its advantage over direct direction is twofold in that
it shifts the detection to higher frequencies where the 7/^ laser excess noise is reduced. It
also removes much o f the base line slope seen in direct detection. Diode-laser WMS and — — Shot noise
[image:29.541.44.530.68.786.2]FMS can be treated with a uniform approach using the electric field o f laser radiation [19,
20]. However, since only WMS was used in this thesis, the traditional mathematical
approach using the intensity o f laser radiation is used here [21]. A brief outline o f FMS is
also included.
2.7.2 WMS
The emission wavelength o f a diode laser can be conveniently modulated by modulating
the injection current at frequencies from sub Hz to their relaxation resonance frequency,
that is typically in the range 1-lOGHz. Although the name o f the technique suggests that
it is the wavelength that is modulated, it has been found more convenient to treat the
modulation process in frequency units [21]. The instantaneous diode laser light
frequency, v(t), can therefore be written:
v ( /) = v + acosco/ (2.27)
where v is the laser mean emission frequency and a is the modulation amplitude. We
can assume the mean frequency and the laser intensity are independent o f each other. If
we now substitute the time-dependent term I(v(t)) into the equation 2.1,
I {v) = Iq{v) \ - k { v + a CO?, cot)nL^ (2.28)
This time varying function (2.28) is a periodic and even function in cot and can be
expanded by Fourier cosine series as
A:(v+ acosco/) = (v)cos«co; (2.29)
n=0
where v is considered to be constant over a modulation period. //„ ( v ) is the n*'’ Fourier
component o f the modulated absorption coefficient. Individual Fourier components can
be selected using a lock-in amplifier at the harmonic o f the modulation frequency.
This term is ultimately dependent on the absorption lineshape. If the pressure is such that
collision broadening is dominant, then the absorption coefficient is described by a
1 +
'W-Vo
(2 .3 0 )
w here Yl is the H a lf W idth at H a lf M axim um (H W H M ) o f the absorption line. The
absorption coefficien t at line centre is norm alised to unity. T w o d im en sion less parameters
are defin ed as
v - v „
X = ■
Yl
(2 .3 1 )
m = - (2 .3 2 )
where m is the m odulation index and the absorption co efficien t b ecom es
( x , m) =
l + (x + «2cosco?)
(2 .3 3 )
The second harm onic (Fourier co efficien t) for the Lorentzian lineshape is g iven by
, + ( x + w c o s ^ )
(2 .3 4 )
T he first three harm onic signals are calculated and sh ow n in Fig 2.7. T he shape o f H„
1/3
c
c/3 o
c
o £
CO
X
6 ■4 ■2 0 2 4 6
X
Figure 2 .7 Calculated harmonic signal fo r a Lorentzian line. (m=2.2)
2f Lineshape and modulation index
Harmonic signals, described by Eq. 2.34, depend on both the absorbance a (including the
specific absorption lineshape) and the modulation index m. 2 / lineshape is often
characterised by its positive peak (P), negative peak (N), width (W), and the total signal
amplitude (A) as shown in Fig. 2.8a. The effects o f modulation index m on the 2/sign als
(of a Lorenztian absorption line) are illustrated in Fig. 2.8(b). When m increases, W
increases due to the modulation broadening effect [3]. P and A increase with m when m <
2, then decrease at larger values o f m. When m is larger than an optimum value, the 2 f
signal spreads out in frequency rather than building up in amplitude.
Variations in 2 f parameters o f a Lorenztian absorption line over a range o f m are
calculated and shown in Fig. 2.9. Note that for a Lorenztian absorption line, the
maximum positive peak (P) and the total amplitude (A) occur at m = 2.2 and 3.1,
respectively. 2 / parameters for absorption lines with other profiles can be calculated
w
A= P+ N
(a)
m = 1
m = 2
m = 3 m = 4
i n c r e a s i n g m
(b)
0,6
0.5
0.4
0.3
0.2
0.1
0.0
0 2 3 4 5
M o d u latio n in d ex (m)
Figure 2.9. Calculated 2fparam eters o f a Lorentzian absorption line at various values o f m.
Limiting Factors in WMS technique.
There are two limiting factors in WMS, which might prevent shot noise limited
sensitivity, they are residual amplitude modulation (RAM) and Fabry-Perot fringes. In
semiconductor lasers a change in the real part o f the refractive index due to a change in
carrier density is accompanied by a corresponding change in the imaginary part, and this
is expressed by the phase-amplitude coupling coefficient (aH-parameter) defined as.
I c o d n /d N
c d g ! dN
where n is the real part o f the refractive index, g is the imaginary part o f the refractive
index, c is the speed o f light, N is the carrier density and co the angular frequency.
induces an intensity modulation. When RAM is larger than the absorption signal the
detection becomes RAM-limited. Non-linearity in the output pow er versus current
characteristics o f the laser diode also gives rise to an unwanted RAM contribution to the
WMS harmonic signal even in the absence o f absorption by the target gas. It results in an
offset in the detected WMS signal at the fundamental frequency f .
Also o f note is at low modulation frequencies (< 10 MHz) the temperature o f the laser
diode is also modulated by the current modulation. Since the refractive index varies with
temperature, the laser wavelength is also modulated via this thermal effect. The
temperature and carrier effects are opposite in sign. The total modulation amplitude o f the
laser optical frequency is the sum o f these two contributions.
Fabry-Perot fringes, due to interference o f transmitted and partially reflected fields
between two surfaces, are commonly observed in laser spectroscopy [26, 27]. These
fringes are characterised by the Airy function [28]
- = ---TT---T (2.36)
I. 1 + F s m { i n v n D I c )
where Ii is the maximum transmitted intensity, D the distance between the two reflecting
surfaces, and n is the refractive index o f the medium between the reflecting surfaces. A
coefficient F describing the reflectivity o f the surfaces is defined as
F = 2r 1 - r ^
(2.37)
where r is the surface reflectivity intensity. The frequency spacing between two fringe
peaks, denoted by
c
Av =
-I n D FSR (2.38)
is the free spectral range (FSR). The amplitude o f the fringes can be reduced by angular
mis-alignment and the use o f reflective and anti-reflection coated optics. However fringes
a change o f ~10'^ in the transm itted intensity, w hich is orders o f m agnitude larger than
the sm all signals to be m easured.
2.7.3 FMS
The m ain advantage o f FM S over W M S is that noise is m uch less at higher frequencies.
M any excellent theoretical descriptions o f FM S can be found in the literature [20, 29-31],
a sum m ary o f w hich is briefly given here. F or FM S, the laser is m odulated at high
frequency cOm (cOm > y (H W H M )), and the instantaneous electric field o f the laser output
can be described as
w here cOm is the m odulation frequency, coo is the optical frequency, M is the am plitude
m odulation depth, p describes the phase m odulation (or frequency m odulation) and is
usually called the frequency m odulation depth, and \\i gives the phase difference betw een
the am plitude and phase m odulation.
Equation 3.5 can be transform ed to an optical carrier and sidebands as
and J/(P ) is the /'*’ order Bessel function. For FM S, P is typically m uch less than unity,
and thus the only significant com ponents in the expansion are the carrier (/=0) and the
first order sideband p a ir (/ = ±1), as illustrated in Fig 2.10. If the am plitude m odulation
effect is negligible then M =0, and
E { t ^ = Eq | l + M sin (fy ^ r + ^^/)exp^/<y()/ + //? sin (& )^ /)j| (2.39)
CO
£(o=v‘^'X
(2.40)w here
(2.41)
the two side-bands have the same amplitude, but they are 180° out o f phase. A gas
absorption line will act on each o f the above frequency components with an amplitude
and phase response a(co) and (p(co). The demodulated signal can be obtained by squaring
E(t), retaining only those components at the demodulation frequency (co for first
harmonic detection, nco for nth harmonic). This gives a complex amplitude o f
where r is the complex conjugate o f r. The detector phase angle 0 relates the phase o f the
detected signal to that o f the reference frequency in the lock-in amplifier. The in-phase
component corresponds to pure absorption, and the quadrature component corresponds to
dispersion. Therefore, not only the absorption but also the dispersion information may be
obtained. Fig 2.11 shows calculated absorption and dispersion waveforms for first-
harmonic detection o f a Gaussian absorption line as a function o f increasing modulation
frequency.
In the near-infrared region, the Doppler HWHM o f molecular transitions are ~100-
300MHz Thus FMS implies a modulation frequency cOm in the lOOMHz-GHz range.
Even higher cOm may be required when the transition is pressure-broadened. This high
frequency is more effective in avoiding excess laser noise and can achieve sensitivity
near the shot noise limit. Table 2.1 lists important features o f WMS and FMS techniques
for comparison. The instrumentation o f an FMS system, includes high-speed detectors
and RF circuit components, which becomes expensive.
Q = 2Ze'^
WMS FMS
® m « Av > Av
Modulation index > 1 < 1
Side bands Multiple 1 pair
Harmonic detection Usually 2 / I f
Instrumentation Easy Difficult
Cost Low High
d m in 1 X 1 0 '^ 1 X 1 0 ’’
Table 2.1 Comparisons o f WMS and FM S
• A bsorption
D ispersion
Y (H W H M )
m CO
m
0 .0 3 - • 50MHz
—^ lOOMHz — — 150MHz 300MHz — ^ 400MHz 500MHz 0.0 2
-0.0 1 -re
c
60
0.00
-0.01
--0.0 2
--0.03
-800 -400 0 400 800
Frequency (MHz)
(a)
50 MHz —^ 100 MHz —^ 150 MHz 300 MHz ^ ^ 4 0 0 MHz 0 .0 5
-0.00
0.05
--1000 -500 0 500 1000
Frequency (MHz)
(b)
2.8 References.
[1] L.
s.
Rothman, C. P. Rinsland, A. Goldman, S. T. Massie, D. P. Edwards, J. M.Flaud, A. Perrin, C. Camy-Peyret, V. Dana, J. Y. Mandin, J. Schroeder, A.
M cCann, R. R. Gamache, R. B. Wattson, K. Yoshino, K. V. Chance, K. W. Jucks,
L. R. Brown, V. Nemtchinov, and P. Varanasi, "The HITRAN molecular
spectroscopic database and HAWKS (HITRAN Atmospheric Workstation): 1996
edition," Journal o f Quantitative Spectroscopy & Radiative Transfer, vol. 60, pp.
665-710, 1998.
[2] L. S. Rothman, A. Barbe, D. C. Benner, L. R. Brown, C. Camy-Peyret, M. R.
Carleer, K. Chance, C. Clerbaux, V. Dana, V. M. Devi, A. Fa}^, J. M. Flaud, R.
R. Gamache, A. Goldman, D. Jacquemart, K. W. Jucks, W. J. Lafferty, J. Y.
Mandin, S. T. Massie, V. Nemtchinov, D. A. Newnham, A. Perrin, C. P.
Rinsland, J. Schroeder, K. M. Smith, M. A. H. Smith, K. Tang, R. A. Toth, J.
Vander Auwera, P. Varanasi, and K. Yoshino, "The HITRAN molecular
spectroscopic database: edition o f 2000 including updates through 2001," Journal
o f Quantitative Spectroscopy & Radiative Transfer, vol. 82, pp. 5-44, 2003.
[3] R. M. Measures, Laser Remote Chemical Analysis, vol. 94: John Wiley & sons,
1988.
[4] N. Jacquinet-Husson, E. Arie, J. Ballard, A. Barbe, G. Bjoraker, B. Bonnet, L. R.
Brown, C. Camy-Peyret, J. P. Champion, A. Chedin, A. Chursin, C. Clerbaux, G.
Duxbury, J. M. Flaud, N. Fourrie, A. Fayt, G. Graner, R. Gamache, A. Goldman,
V. Golovko, G. Guelachvili, J. M. Hartmann, J. C. Hilico, J. Hillman, G. Lefevre,
Newnham, A. Nikitin, J. Orphal, A. Perrin, D. C. Reuter, C. P. Rinsland, L.
Rosenmann, L. S. Rothman, N. A. Scott, J. Selby, L. N. Sinitsa, J. M. Sirota, A.
M. Smith, K. M. Smith, V. G. Tyuterev, R. H. Tipping, S. Urban, P. Varanasi, and
M. Weber, "The 1997 spectroscopic GEISA databank," Journal o f Q uantitative
Spectroscopy & R adiative Transfer, vol. 62, pp. 205-254, 1999.
[5] M. E. Webber, S. Kim, S. T. Sanders, D. S. Baer, R. K. Hanson, and Y. Ikeda, "In
situ combustion measurements o f CO2 by use o f a distributed-feedback
diode-laser sensor near 2.0 |J.m," A pplied Optics, vol. 40, pp. 821-828, 2001.
[6] P. W. M iloni. and J. E. Eberely, Lasers: John W iley & Sons, 1988.
[7] Schalow and Townes, M icrow ave Spectroscopy. Dover Publications, 1975.
[8] Demtroder, L aser Spectroscopy, 2®*^. Berlin: Springer Verlag, 1998.
[9] J. Humlicek, "An efficient method for evaluation o f the com plex probability
function: the Voigt function and its derivative," J Quant Spectrosc R adiat
Transfer, vol. 21, pp. 309-313, 1979.
[10] R. H. Dicke, "The effects o f Collisions upon the Doppler Width o f Spectral
Lines," P hysical Review , vol. 89, pp. 472-305, 1953.
[11] L. Galatry, "The Effects o f Collisions upon the Doppler Width o f Spectral Lines,"
Physical Review, \o \. 122, pp. 1218-1223, 1961.
[12] M. Lepere, "Line profile study with tunable diode laser spectrometers,"
Spectrochim ica Acta P a rt A: M olecular and B iom olecular Spectroscopy, vol. In
Press, Corrected Proof.
[13] W. Ruyten, "Comment on "A new implementation o f the Humlicek algorithm for
819-824," Journal o f Quantitative Spectroscopy & Radiative Transfer, vol. 86,
pp. 231-233,2004.
[14] P. L. Varghese and R. K. Hanson, "Collisional narrowing effects on spectral line
shapes measured at high resolution," Appl Opt, vol. 23, pp. 2376-2385, 1983.
[15] X. Ouyang and P. L. Varghese, "Reliable and Efficient Program for Fitting
Galatry and Voigt Profiles to Spectral Data on Multiple Lines," Applied Optics,
vol. 28, pp. 1538-1545, 1989.
[16] E. Rosencher. and. B. Vinter, Optoelectronics: Cambridge University Press, 2002.
[17] Yariv, Quantum Electronics: Wiley, 1989.
[18] P. Signoret, M. Myara, J.-P. Tourrenc, B. Orsal, M.-H. Monier, J. Jacquet, P.
Leboudec, and F. Marin, "Bragg section effects on linewidth and lineshape in
1.55 fj,m DBR tunable laser diodes," Photonics Technology Letters, IEEE, vol. 16,
pp. 1429-1431,2004.
[19] D. S. Bomse, A. C. Stanton, and J. A. Silver, "Frequency-M odulation and
Wavelength Modulation Spectroscopies - Comparison o f Experimental Methods
Using a Lead-Salt Diode-Laser," Applied Optics, vol. 31, pp. 718-731, 1992.
[20] J. A. Silver, "Frequency-Modulation Spectroscopy for Trace Species Detection -
Theory and Comparison among Experimental Methods," Applied Optics, vol. 31,
pp. 707-717, 1992.
[21] J. Reid and D. Labrie, "Second-Harmonic Detection with Tunable Diode Lasers -
Comparison o f Experiment and Theory," Applied Physics, vol. B, pp. 203-210,
[22] P. Kluczynski, J. Gustafsson, A. M. Lindberg, and O. Axner, "Wavelength
modulation absorption spectrometry - an extensive scrutiny o f the generation o f
signals," Spectrochimica Acta Part B-Atomic Spectroscopy, vol. 56, pp. 1277-
1354, 2001.
[23] P. Kluczynski, A. M. Lindberg, and O. Axner, "Background signals in
wavelength-modulation spectrometry with frequency-doubled diode-laser light. I.
Theory," Applied Optics, vol. 40, pp. 783-793, 2001.
[24] P. Kluczynski, A. M. Lindberg, and O. Axner, "Background signals in
wavelength-modulation spectrometry with frequency-doubled diode-laser light. II.
Experiment," Applied Optics, vol. 40, pp. 794-805, 2001.
[25] K. Boylan, "The Application o f Tunable and W idely Tunable Single Frequency
Laser Diodes to Trace Gas Detection in the near infrared," M.Sc thesis, Trinity
College Dublin, 2000,.
[26] H. C. Sun and E. A. Whittaker, "Novel Etalon Fringe Rejection Technique for
Laser-Absorption Spectroscopy," Applied Optics, vol. 31, pp. 4998-5002, 1992.
[27] N. Kagawa, O. Wada, and R. Koga, "Suppression o f the etalon fringe in
absorption spectrometry with an infrared tunable diode laser," Optical
Engineering, vol. 36, pp. 2586-2592, 1997.
[28] Hecht, Optics, 4th ed: Addison Wesley, 2003.
[29] U. Gustafsson, G. Somesfalean, J. Alnis, and S. Svanberg, "Frequency-
modulation spectroscopy with blue diode lasers," Applied Optics, vol. 39, pp.
[30] H. Riris, C. B. Carlisle, D. F. McMillen, and D. E. Cooper, "Explosives detection
with a frequency modulation spectrometer," Applied Optics, vol. 35, pp. 4694-
4704, 1996.
[31] G. C. Bjorklund, W. Zapka, M. D. Levenson, A. C. Tam, W. Lenth, F. M.
Schellenberg, T. F. Gallagher, R. Kachru, and F. Gounand, "Recent Progress in
Frequency-M odulation Spectroscopy," Applied Physics B-Photophysics and Laser


![Figure 3.12 Power reflectivity spectrum from a MG-Y Laser [26].](https://thumb-us.123doks.com/thumbv2/123dok_us/1359233.668512/60.541.19.530.29.727/figure-power-reflectivity-spectrum-mg-y-laser.webp)

