Original Article
The study of the correlation between quantitative
18
F-FDG PET/CT metabolic parameters and the
early treatment response for non-small cell
lung cancer with chemoradiotherapy
Hongbin Deng1,2*, Changsheng Ma2*, Jinghao Duan2, Judong Luo2, Yong Yin2
1School of Medicine and Life Sciences, University of Jinan-Shandong Academy of Medical Sciences, Jinan
250022, Shandong, China; 2Shandong Cancer Hospital Affiliated to Shandong University, Jinan 250117,
Shan-dong, China. *Equal contributors.
Received June 19, 2017; Accepted November 27, 2017; Epub February 15, 2018; Published February 28, 2018
Abstract: Objective: This study was to investigate the correlation of pretreatment 18F-FDG PET/CT metabolic
param-eters and the early treatment response to chemoradiotherapy in patients with non-small cell lung cancer (NSCLC). Methods: PET/CT images of 61 patients with locally advanced NSCLC (31 patients with adenocarcinoma and 30 with squamous cell carcinoma) were collected at Shandong Cancer Hospital. All patients accepted chemoradio-therapy. The gross tumor volume (GTV) was delineated on PET/CT images with standard uptake values (SUVs) > 2.5. SUV volume histograms, maximum SUV (SUVmax), mean SUV (SUVmean), metabolic tumor volume (MTV), total lesion glycolysis (TLG) and area under the curve of the cumulative SUV volume histogram (AUC-CSH) were extracted. The correlations between the metabolic parameters and three months after treatment for early treatment response were analyzed. Results: AUC-CSH, SUVmax, SUVmean, MTV, and TLG correlated with the early treatment response in lung adenocarcinoma patients. For squamous cell carcinoma, all parameters were associated with the early treat-ment response except for MTV, and all the results was same to the One-way ANOVA analysis. Multivariate Linear regression analysis, SUVmax was an independent prognostic factor for the early treatment response in adenocarci-noma cases (standardized coefficient =-0.708, P=0.000). AUC-CSH was an independent prognostic factor for squa-mous cell carcinoma (standardized coefficient =0.733, P=0.000). We used the ROC curve to analyze the efficacy of the parameters to predict the treatment response. Receiver-operating characteristic curve (ROC) analysis showed that the cut-off threshold of SUVmax for adenocarcinoma was 8.650, with 76.5% sensitivity and 100% specificity, and the cut-off threshold of AUC-CSH for squamous cell carcinoma was 0.4715, with 83.3% sensitivity and 100% specificity. Conclusions: Quantitative metabolic parameters are valuable for predicting the early treatment response in NSCLC, and special parameters should be applied for different pathological types of NSCLC.
Keywords: PET/CT, quantitative parameters, chemoradiotherapy, treatment response, NSCLC
Introduction
Lung cancer is one of the most common malig-nant tumors with the highest rates of morbidity and mortality worldwide [1]. In 2008, there were 1.61 million new cases and 1.38 million deaths from lung cancer [2]. Non-small cell lung cancer (NSCLC) accounts for up to 85% of all lung cancers, with adenocarcinoma and squamous cell carcinoma making up 50% and 30% of cases, respectively. For patients with inoperable NSCLC, radiotherapy and chemora-diotherapy play very important roles. The 5-year survival rates of patients with stage I-II and III
NSCLC are only 50% and 20%, respectively. The main cause of death is local progression and distant metastasis [3]. Early and accurately prediction of the treatment response can be detected in patients with high risk of recurr- ence and clinical intervention timely.
vivo and quantitative method of glucose metab-olism which precedes changes in tumor size and can possibly reflect drug effects at a cellu-lar level. It might also be a powerful tool for measurement of treatment response, which may enable a distinction between patients who are going to benefit from treatment. In recent years, 18F-FDG PET has been used to assess the treatment response and predict patient outcome [4]. 18F-FDG PET/CT images reflect both morphological changes of the tumor as well as the metabolic activity inside the tumor, which makes this the main method used to quantitatively analyze heterogeneity in tumor metabolism [5].
Traditional parameters, such as the maximum standard uptake value (SUVmax) and mean stan-dard uptake value (SUVmean), have some limita-tions in predicting the early treatment response [6]. Several studies have reported that quanti-tative and semi-quantiquanti-tative parameters of FDG-PET, including metabolic tumor volume (MTV), gross total lesion glycolysis (TLG) and cumulative area under the curve area (AUC-CSH), are more important for predicting progno-sis [7, 8].
The cumulative volume histogram (CSH) of SUV is a new method to quantitatively analyze intra-tumor heterogeneity. This method allows the area under the CSH (AUC-CSH) curve to be quantified as a percentage of the total tumor volume exceeding a percentage threshold of SUVmax, with lower AUC-CSH values correspond-ing to higher degrees of heterogeneity [9]. Kang SR et al. retrospectively reviewed 116 pretreat-ment FDG PET/CT scans of patients with inop-erable stage III NSCLC and found that the AUC-CSH was the most significant independent prognostic factor for local recurrence-free vival (LRFS) and distant metastasis-free sur-vival (DMFS) [10].
The aim of this study was to analyze the rela-tionship between pretreatment 18F-FDG PET/CT parameters and the early treatment response of patients with different pathological types of NSCLC and to identify a parameter that effec-tively predicts the early treatment response.
Materials and methods
Patient characteristics
This study was approved by the institutional review board at Shandong Cancer Hospital.
Informed consent was waived due to the retro-spective design of the study. Sixty-one patients with inoperable stage IIIA/B NSCLC who under-went chemoradiotherapy were recruited from October 2014 to June 2016 at Shandong Cancer Hospital. Thirty-one patients had ade-nocarcinoma, and 30 patients had squamous cell carcinoma. There were 40 males and 21 females (37-82 years old, median age 50 years).
The inclusion criteria were as follows: (1) patients with inoperable NSCLC, (2) stage IIIA or IIIB disease, (3) no history of surgery on the primary tumor, (4) mass diameter greater than 3 cm, (5) clear pathological diagnosis, (6) no tracheal involvement of the primary tumor, and (7) 18F-FDG PET/CT scan performed within 1 weeks of beginning radiotherapy. Three months after the end of treatment, the CT results were reviewed, and the early treatment response was evaluated using the Response Evaluation Criteria in Solid Tumors (RECIST) version 1.1 [11]. We applied the following categories: com-plete response (CR): Disappearance, confirmed at 4 weeks; partial response (PR): 30% De- crease in size, confirmed at 4 weeks; stable dis-ease (SD): Neither PR nor PD criteria; and pro-gressive disease *PD): 20% Increase in size, no CR, PR, ob SD dkcumented before increased disease (Table 1).
18F-FDG PET/CT scan and GTV definition
The PET/CT images were obtained using a Philips Gemini TF PET/CT (Philips Healthcare, Cleveland, OH). Patients fasted for 6 hours or more, and the blood glucose level was normal before the scan. Patients received an intrave-nous injection of 18F-FDG at 4.4 MBq/kg, and the CT and PET scans were completed 1 hour later. All of the images were obtained under free breathing. The PET images were attenuat-ed and correctattenuat-ed, and the reconstructions were performed in multiple layers and multiple imag-es. The PET/CT images were imported into MIM software (Cleveland, OH). The gross tumor vol-ume (GTV) was automatically delineated with an SUV≥2.5 absolute threshold. Two senior radiologists modified and confirmed the target (Figure 1). SUV volume histograms, SUVmax, SUVmean, MTV, TLG and AUC-CSH were extracted and analyzed.
Treatments and groups
prescription dose was set at 1.8-2 Gy/fraction, and the total dose was 63.4±4 Gy. 4 cycles of concomitant chemotherapy consisted of a plat-inum-based regimen containing paclitaxel and
nocarcinoma and squamous cell carcinoma patients (p > 0.05). AUC-CSH was positively correlated with the early treatment response in adenocarcinoma and squamous cell
carcino-Table 1. Characteristics of 61 patients with NSCLC
Characteristic Adenocarcinoma Squamous cell carcinoma CR/PR SD/PD CR/PR SD/PD
Age (mean age) 37-82 (59) 40-77 (64) 37-82 (55) 39-80 (67)
Gender Male 12 7 13 8
Female 5 7 5 4
Stages IIIA 13 8 10 7
IIIB 4 6 8 5
T Stage T1 0 0 0 0
T2 2 1 2 0
T3 11 6 14 6
T4 4 7 2 6
N Stage N0 5 1 2 1
N1 10 5 11 3
N2 2 4 4 3
N3 0 4 1 5
[image:3.612.91.377.87.304.2]Radiotherapy dose (Gy) 60.7±3.1 64.2±4.3 59.5±5.0 63.3±2.7
Figure 1. (A-D) 18F-FDG PET/CT scan and MTV definition in a typical patient
with a non-responding tumor. (A) Is a cross sectional PET imaging, (B) Is a sagittal PET imaging, (C) Is a fusion imaging of PET and CT, (D) Is a cross sectional CT imaging. (E, F) Pre-treatment and post-treatment association observed by CT imaging. (E) Is pre-treatment CT imaging and (F) is post-treatment CT imaging.
vinorelbine. The patients were grouped according to patho-logical type and outcome of the RECIST evaluation. The early treatment response was graded, SD/PD was grade 1, CR/PR was grade 2. For patients with adenocarcino-ma, 17 achieved CR/PR, and 14 showed SD/PD. For pa- tients with squamous cell car-cinoma, 18 cases achieved CR/PR, and 12 showed SD/ PD.
Statistical analysis
The statistical analysis was performed using SPSS for Windows (version 16, IBM). Correlations between AUC-CSH, SUVmax, SUVmean, MTV and TLG and the early treat-ment response were analyzed by Spearman correlation anal-ysis. The relationship between the parameters and the early treatment response was ana-lyzed by One-way ANOVA anal-ysis and multivariate linear regression analysis. We used the early treatment response graded as the dependent varmabne, and dhe quantita-tive parameters were used as the independent variable. Finally, ROC curve analysis was used. The optimal cut-off value was obtained for each parameter using the Youdon parameter. P values <0.05 were considered statisically significant.
Results
Tle result of the spearman correLation analises
[image:3.612.91.378.94.595.2]ade-ma; larger values of AUC-CSH were associated with a more pronounced treatment response. The correlation coefficients were 0.585 (P= 0.001) and 0.733 (P=0.000) for adenocarcino-ma and squamous cell carcinoadenocarcino-ma, respec- tively.
SUVmax, SUVmean, MTV and TLG were negatively correlated with the early treatment response of adenocarcinoma and squamous cell carcinoma (P<0.05), except for MTV in patients with squa-mous cell carcinoma. For adenocarcinoma, the strongest correlations were obtained for SUVmax, AUC-CSH, SUVmean, MTV and TLG in descending order. For squamous cell carcinoma, this order was SUVmax, AUC-CSH, SUVmean, TLG and MTV (Table 3).
The result of Univariate and multivariate analyses
The results of the univariate analyses were sim-ilar to those of correlation analysis of the early treatment response with each parameter (Ta- ble 4). Multivariate analyses showed that SUVmax independently predicted the early treat-ment response for adenocarcinoma, and the regression coefficient was -0.708 (P=0.000). AUC-CSH was an independent predictive factor for squamous cell carcinoma, and the stan-dardized regression coefficient was 0.733 (P=0.000) (Table 5).
Specificity, sensitivity, and AUC-ROC in predict-ing the early treatment response
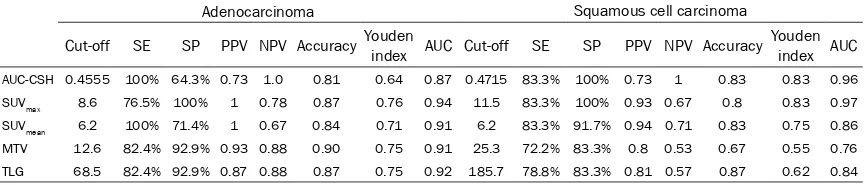
ROC curve analysis showed that the sensitivity and specificity of AUC-CSH, SUVmax, SUVmean, MTV and TLG in predicting the early treat- ment response in adenocarcinoma ranged fr- om 71.4%-100% and 64.3%-100%, respective-ly, and the AUC-ROCs were 0.866-0.935 (P<0.05). SUVmax showed the highest AUC-ROC at 0.935. The sensitivity and specificity in squa-mous cell carcinoma ranged from 72.2%-83.3% and 83.3%-100%, respectively, and the ROCs were 0.764-0.963 (P<0.05). The AUC-ROCs of AUC-CSH and SUVmax were similar (0.963 and 0.972, respectively) as predictors of the early treatment response in squamous cell carcinoma, with the same sensitivity and specificity. The ROC curves are shown in Figure 2. The cut-offs, sensitivity, specificity and AUC-ROCs for each parameter are shown in Table 6
and Supplementary Data.
Optimal cut-offs in predicting the early treat-ment response
[image:4.612.89.522.86.178.2]For adenocarcinoma, the optimal cut-offs of AUC-CSH, SUVmax, SUVmean, MTV and TLG were 0.4555, 8.6, 6.2, 12.6, and 68.5, respectively, for predicting the early treatment response. For squamous cell carcinoma, the optimal cut-offs
Table 3. Correlation between early treatment response and metabolic parameters
Adenocarcinoma Squamous cell carcinoma
r p r p
AUC-CSH 0.585 0.001 0.733 0.000 SUVmax -0.708 0.000 -0.673 0.000 SUVmean -0.581 0.001 -0.550 0.002 MTV -0.503 0.004 -0.349 0.059 TLG -0.474 0.007 -0.518 0.003
Table 4. Results of the one way ANOVA analy-sis
Univariate analysis
Adenocarcinoma Squamous cell carcinoma
F p F p
[image:4.612.326.522.226.329.2]AUC-CSH 15.08 0.001 32.46 0.000 SUVmax 8.41 0.007 23.21 0.000 SUVmean 9.84 0.004 12.13 0.002 MTV 29.13 0.000 3.88 0.059 TLG 14.79 0.001 10.26 0.003
Table 2. Parameter differences between the two pathologic types of NSCLC
Adenocarcinoma Squamous cell carcinoma
CR/PR SD/PD p CR/PR SD/PD p
AUC-CSH 0.5667±0.1166 0.4443±0.0879 0.003 0.5324±0.1007 0.3983±0.0597 0.000
SUVmax 7.5±2.8 14.9±5.8 0.000 9.1±3.3 19.5±8.9 0.000
SUVmean 4.0±0.7 6.5±2.8 0.000 4.7±1.5 7.4±2.0 0.000
[image:4.612.91.287.227.330.2]of AUC-CSH, SUVmax, SUVmean, and TLG were 0.4715, 11.5, 6.2, and 185.7, respectively, for predicting the early treatment response. The optimal cut-offs for each parameter differed, except for SUVmean.
Discussion
PET/CT images reflect the specific distribution of 18F-FDG uptake in a tumor, which represents the metabolic activity, tissue perfusion and cell proliferation of a tumor. PET is a non-invasive, dynamic and quantitative method to evaluate tumor metabolism and biological characteris-tics at the molecular level, which are reflected by the heterogeneity of FDG uptake in tumor imaging [12, 13]. 18F-FDG PET/CT is increas-ingly being used to evaluate the treatment response and long-term survival of patients with NSCLC. There are differences in the patho-physiology and histology between histologic subtypes of NSCLC, which indicates that there are likely differences in PET imaging. Nguyen D et al. retrospectively reviewed the survival data from 1,201 patients with T3N0M0 NSCLC who had undergone lobectomy and reported differ-ences in the 5-year survival for patients with different NSCLC subtypes [14]. However, there are few studies on the treatment response, prognosis and long-term survival of patients with different pathological subtypes of NSCLC. Our study indicates that MTV, TLG, and AUC-CSH can predict the early treatment response in patients with NSCLC. However, there were differences between the pathological subtypes of NSCLC. For adenocarcinoma, SUVmax could be used as a predictor of the early treatment response, while for squamous cell carcinoma, SUVmax and AUC-CSH could predict the early treatment response with high sensitivity and specificity.
with a high SUVmax is significantly lower than that of patients with a low SUVmax [15]. Nair et al. prospectively studied 163 patients with inoperable T1 or T2 NSCLC who were treated with radiotherapy. The 2- and 3-year overall sur-vival (OS) rates were 76% and 67%, respective-ly, and the 2-year progression-free survival (PFS) rates of patients with SUVmax <7 were higher than those of patients with SUVmax > 7. In addition, the LRFS and DMFS rates were low in the SUVmax > 7 group, and multivariate analysis showed that an SUVmax > 7 significantly influ-enced DMFS [16]. However, we found that for adenocarcinoma, SUVmax could predict the early treatment response with high sensitivity and specificity. When the SUVmax was 8.6, the sensi-tivity and specificity were 76.5% and 100%, respectively. In patients with squamous cell carcinoma, SUVmax was not an independent pre-dictor of response but did show high sensitivity and specificity. When the SUVmax was 11.5, the sensitivity and specificity was 83.3% and 100%, respectively. We found that the cut-offs of SUVmax that predicted the early treatment responses of different histologic subtypes of NSCLC were significantly different.
[image:5.612.90.374.85.190.2]The cumulative SUV volume histogram (CSH) is a new method for the quantitative analysis of intra-tumor heterogeneity. The area under the CSH curve (AUC-CSH) is a quantitative param-eter of tumor uptake hparam-eterogeneity, with lower AUCs corresponding to higher degrees of het-erogeneity [9]. Navajo et al. compared 63 cases of primary benign and malignant musculoskel-etal tumors in patients and found that using AUC-CSH as the tumor heterogeneity parame-ter led to the highest diagnostic accuracy rate in addition to pathological diagnosis [17]. In our study, AUC-CSH was an independent predictor of the early treatment response in squamous
Table 5. Results of multivariate linear regression analysis
Adenocarcinoma Squamous cell carcinoma Standardized
Coefficients T value P Value Standardized Coefficients T value P Value AUC-CSH -- 1.801 0.082 0.733 5.697 0.000
TLG -- 0.952 0.349 -- -1.216 0.235
MTV -- -0.145 0.886 -- -0.547 0.589 SUVmax -0.708 -5.398 0.000 -- -1.739 0.093 SUVmean -- 1.531 0.137 -- -1.828 0.079
Note: Stepwise method was used.
cell carcinoma, with high sensitivity and speci-ficity. The cut-off threshold of AUC-CSH was 0.4715, with sensitivity and specificity of 83.3% and 100%, respectively.
The T stage is a parameter that characterizes tumor size [18]. The MTV is a metabolic volume parameter that reflects the metabolic activity of the primary tumor. SUVmean reflects the aver-age metabolic activity of the lesion. The TLG is a parameter that combines lesion uptake and metabolic volume, defined as the multiplication of MTV and SUVmean [19]. In our study, the T stage, MTV, SUVmean and TLG showed less pre-dictive value for the early treatment response than SUVmax. Nappi A et al. studied 103 patients with NSCLC using contrast pretreatment PET scans and found that SUVmax was the only dictor of PFS in patients with NSCLC. The pre-dictive value of MTV and TLG was relatively small, and MTV was only partially predictive of mediastinal lymph node metastasis [20]. These authors also reported that MTV and TLG were superior to SUVmax in predicting long-term sur-vival, which differs from our results. Huang et
al. analyzed 53 cases of locally advanced NSCLC and found OS rates at 1 and 2 years of 83.0% and 52.8%, respectively. Multivariate analysis showed that the only prognostic factor for OS was MTV [21]. Li L et al. retrospectively reviewed 96 patients with NSCLC stage I-III who received chemotherapy and reported that MTV and TLG were better predictors of OS and PFS than SUVmax when 18F-FDG PET/CT was used [22]. However, the conclusions of these studies remain somewhat inconsistent, and large-scale prospective trials are needed for further validation.
This retrospective study of patients with differ-ent treatmdiffer-ent options may affect the results of a larger aggregate study. The value of PET/CT quantitative parameters in assessing the treat-ment response should be further validated with larger prospective studies.
Conclusions
[image:6.612.96.521.74.256.2]18F-FDG PET/CT metabolic parameters can be used to predict the early treatment response of
Figure 2. (A) ROC for different quantitative parameters for adenocarcinoma and (B) ROC for different quantitative parameters for squamous cell carcinoma.
Table 6. Specificity, sensitivity, and AUC-ROC in predicting the early treatment response
Adenocarcinoma Squamous cell carcinoma
Cut-off SE SP PPV NPV Accuracy Youden index AUC Cut-off SE SP PPV NPV Accuracy Youden index AUC
[image:6.612.91.523.322.415.2]patients with NSCLC. However, we recommend using different parameters to assess the early treatment response for the two histological subtypes of NSCLC. Pre-treatment risk stratifi-cation according to these parameters may help to develop individualized treatment programs to improve therapeutic efficacy.
Acknowledgements
This work was supported by the National Na- tural Science Foundation of China (81301936, 81472811) and the Science Technology De- velopment Project of Shandong province (20- 14GGC03038).
Disclosure of conflict of interest
None.
Address correspondence to: Dr. Yong Yin, Shandong Cancer Hospital Affiliated to Shandong University, No.440, Jiyan Road, Jinan, Shandong, China. Tel: +86-531-67626427; E-mail: yinyongsd@126.com
References
[1] Torre LA, Bray F, Siegel RL, Ferlay J, Lortet-Tieu-lent J and Jemal A. Global cancer statistics, 2012. CA Cancer J Clin 2015; 65: 87-108. [2] Ferlay J, Shin HR, Bray F, Forman D, Mathers C
and Parkin DM. Estimates of worldwide burden of cancer in 2008: GLOBOCAN 2008. Int J Can-cer 2010; 127: 2893-2917.
[3] Torre LA, Siegel RL and Jemal A. Lung cancer statistics. Adv Exp Med Biol 2016; 893: 1-19. [4] Zhang C, Liu J, Tong J, Sun X, Song S and
Huang G. 18F-FDG-PET evaluation of patho-logical tumour response to neoadjuvant thera-py in patients with NSCLC. Nucl Med Commun 2013; 34: 71-77.
[5] Vriens D, Disselhorst JA, Oyen WJ, de Geus-Oei LF and Visser EP. Quantitative assessment of heterogeneity in tumor metabolism using FDG-PET. Int J Radiat Oncol Biol Phys 2012; 82: e725-e731.
[6] Pak K, Cheon GJ, Kang KW, Chung JK, Kim EE and Lee DS. Prognostic value of suvmean in oropharyngeal and hypopharyngeal cancers: comparison with SUVmax and other volumetric parameters of 18F-FDG PET. Clin Nucl Med 2014; 40: 9-13.
[7] Gilardi L, De MF and Grana CM. PET/CT char-acterization of non-small-cell lung cancer het-erogeneity. Nucl Med Commun 2015; 36: 411-413.
[8] Naqa IE. The role of quantitative PET in predict-ing cancer treatment outcomes. Clin Transl Im-aging 2014; 2: 305-320.
[9] van Velden FH, Cheebsumon P, Yaqub M, Smit EF, Hoekstra OS, Lammertsma AA and Boel-laard R. Evaluation of a cumulative SUV-vol-ume histogram method for parameterizing het-erogeneous intratumoural FDG uptake in non-small cell lung cancer PET studies. Eur J Nucl Med Mol Imaging 2011; 38: 1636-1647. [10] Kang SR, Song HC, Byun BH, Oh JR, Kim HS,
Hong SP, Kwon SY, Chong A, Kim J and Cho SG. Intratumoral metabolic heterogeneity for pre-diction of disease progression after concurrent chemoradiotherapy in patients with inoperable stage III non-small-cell lung cancer. Nucl Med Mol Imaging 2014; 48: 16-25.
[11] Watanabe H, Okada M, Kaji Y, Satouchi M, Sato Y, Yamabe Y, Onaya H, Endo M, Sone M and Arai Y. New response evaluation criteria in solid tumours-revised RECIST guideline (ver-sion 1.1). Gan To Kagaku Ryoho 2009; 36: 2495-2501.
[12] Pugachev A, Ruan S, Carlin S, Larson SM, Cam-pa J, Ling CC and Humm JL. Dependence of FDG uptake on tumor microenvironment. Int J Radiat Oncol Biol Phys 2005; 62: 545-553. [13] Lambin P, Petit SF and Aerts H. The ESTRO
Breur Lecture 2009. From population to voxel-based radiotherapy: exploiting intra-tumour and intra-organ heterogeneity for advanced treatment of non-small cell lung cancer. Radio-ther Oncol 2010; 96: 145-152.
[14] Nguyen DT, Fontaine JP, Robinson LA, Keenan RJ and Toloza EM. P1.22: temporal survi- val improvement for stage-II (T3N0M0) lung adenocarcinoma after pulmonary lobectomy: track: early stage NSCLC (stage I-III). J Thorac Oncol 2016; 11: S195.
[15] Lee HY, Lee KS, Han J, Kim BT, Cho YS, Shim YM and Kim J. Mucinous versus nonmucinous solitary pulmonary nodular bronchioloalveolar carcinoma: CT and FDG PET findings and path- ologic comparisons. Lung Cancer 2009; 65: 170-175.
[16] Nair VJ, MacRae R, Sirisegaram A and Pan-tarotto JR. Pretreatment [18F]-fluoro-2-deoxy-glucose positron emission tomography maxi-mum standardized uptake value as predictor of distant metastasis in early-stage non-small cell lung cancer treated with definitive radia-tion therapy: rethinking the role of positron emission tomography in personalizing treat-ment based on risk status. Int J Radiat Oncol Biol Phys 2014; 88: 312-318.
[17] Nakajo M, Nakajo M, Jinguji M, Fukukura Y, Nakabeppu Y, Tani A and Yoshiura T. The value of intratumoral heterogeneity of 18F-FDG up-take to differentiate between primary benign and malignant musculoskeletal tumours on PET/CT. Br J Radiol 2015; 88: 20150552. [18] Wittekind C. 2010 TNM system: on the 7th
[19] Chen HW, Chiu NT, Su WC, Guo HR and Lee BF. Prognostic value of whole-body total lesion gly-colysis at pretreatment FDG PET/CT in non-small cell lung cancer. Radiology 2012; 264: 559-566.
[20] Nappi A, Gallicchio R, Simeon V, Nardelli A, Pelagalli A, Zupa A, Vita G, Venetucci A, Di CM and Barbato F. [F-18] FDG-PET/CT parameters as predictors of outcome in inoperable NSCLC patients. Radiol Oncol 2016; 49: 320-326. [21] Huang W, Fan M, Liu B, Fu Z, Zhou T, Zhang Z,
Gong H and Li B. Value of metabolic tumor vol-ume on repeated 18F-FDG PET/CT for early prediction of survival in locally advanced non-small cell lung cancer treated with concurrent chemoradiotherapy. J Nucl Med 2014; 55: 1584-1590.