Abstract— A lot of work has been done on the enhancement of lime reactivity by materials containing alumina silicates through pozzolanic reaction. This has lead to investigation of new sources
CaO of alumina silicates. Waste Activated Sludge (W.A.S) was found to be enhancing limestone reactivity but to a certain optimum amount, after which it becomes detrimental. Shrinking Core Model (SCM) with mass transfer through the fluid film as the rate-limiting step was compared with chemical reaction as the rate-limiting step. Central cubic design was used for regression analysis of the effects of temperature, lime to W.A.S ratio, liquid to solid ratio and stirring speed in linear, quadratic and interactive aspect. The effects were more pronounced for temperature and least pronounced for stirring speed.
Index Terms —Lime, Waste activated sludge, Reactivity constant, Pozzolanic reaction.
I. INTRODUCTION
Limestone is one of the most abundant sedimentary rock which has calcium carbonate (CaCO3) as its major constituent.
Apart from its use in the manufacture of cement, limestone has several other uses especially in the production of glass, toothpaste, fillers and as a source of calcium in food. Due to its alkalinity, limestone is used to neutralize acidic conditions in soil, water and air. This is the same reason why it is used as a sorbent in removal of oxides of nitrogen (NOx), sulfur (SO2)
and lately CO2 from flue gasses [1]-[5]. FGD (flue gas
desulfurization) is the removal of sulfur dioxide (SO2) from
flue gas which is formed by the combustion of fuels rich in sulfur for example coal. During combustion, the sulfur in the fuel reacts with oxygen in air to form SO2. If left in the flue
gas, SO2 reacts with water vapor in air to form sulfurous
acid[6] or in presence of oxygen to form sulfuric acid[7] and thus form acidic rain. Apart from being harmful to the environment, acid rain causes serious health problems to human beings and also damages properties especially buildings. In many countries, it has become government policy to reduce SO2 emission and thus FGD.
There are three major FGD processes, that is wet, dry and semi-dry FGD processes whereby the sorbent is either wet,
Manuscript received on 8th February 2010. This work is supported in part
by the financial assistance of Tshwane University of Technology, Eskom-South Africa, and National Research Foundation grant number 65922.
Paul Maina is with the Department of Mechanical Engineering, Pretoria Campus, Tshwane University of Technology, Private Bag X680 0001, Pretoria, South Africa.
Makame Mbarawa is with the Department of Mechanical Engineering, Pretoria Campus, Tshwane University of Technology, Private Bag X680 0001, Pretoria, South Africa.
dry or semi-dry respectively. When limestone is used directly, the CaCO3 in it reacts with the SO2 thus removing it. This
process is not effective, therefore, limestone is usually calcined to a form which is more reactive than CaCO3.
Although the reactivity of CaO is better, it is also not very effective and due to stringent desulfurization policies, it is inevitable to process it further, so that its reactivity increases. To achieve this, the calcined limestone is normally hydrated to form Ca(OH)2 which is perceived to be more reactive than
CaO towards SO2 due to its higher surface area and porosity.
Investigations have shown that the activity of hydrated lime depends mainly on surface area, porosity and accessible alkalinity [8]-[11]. To add on the surface area and porosity and therefore more reactivity, hydrating additives are usually incorporated in the hydration process. Fly ash is one of the highly used additive because of its abundance and availability in plants requiring FGD. Fly ash increases the surface area and porosity through a pozzolanic reaction between its alumina silicates and CaO. In a pozzolanic reaction, activation starts with the consumption of vitreous-phase silica and/or alumina by alkaline water and this stage is considered to be the rate limiting step. The consumption of vitreous phase in the presence of Ca(OH)2 yields hydrated calcium
silica-aluminates which are fibrous gels, which enhances the surface area of the product. The controlling step in the reaction, if enough Ca(OH)2 is present, is thought to be the dissolution
rate of alumina and/or silica from the vitreous phase into the aqueous phase. This lead to research on other sources of alumina silicates like bottom ash, silica fume, incinerator ash, diatomite, oil palm ash and rice husk ash[12]-[18].
In this research, a new source of alumina silicate (Waste Activated Sludge - W.A.S) was investigated. This is the excess sludge in treatment of sewage and industrial wastewaters which accumulates beyond reuse. W.A.S is usually further treated to produce manure or disposed as landfills [19]. Apart from finding an economical source of alumina silicates, this study also assists in finding alternatives to fly ash and reduce landfills generated by untreated W.A.S thus improvement on the environment. The alumina silicates contained in W.A.S are in amorphous form; therefore W.A.S can be considered a pozzolan. Pozzolans reacts with hydroxides of alkali metals and alkaline earth metals in the presence of water at normal temperature [11].
II. EXPERIMENTAL
When strong acids like sulphuric acid (H2SO4) or
hydrochloric acid (HCl) are used to react with limestone and
Effect of Activated Sludge on Limestone
Reactivity
its associated products of refinement, the reaction mechanism is close to that in a wet FGD plant equipped with air oxidation of the bisulphate ion. Recently, ASTM developed a standard test method for the determination of total neutralizing capability of dissolved calcium and magnesium oxides in lime for FGD (ASTM C:1318-95). This method recommends an acid titration procedure. [20].
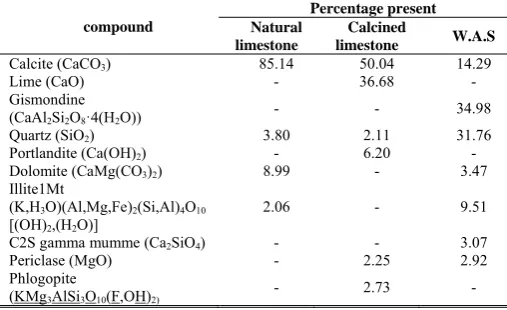
Natural limestone from a mine in South Africa was provided by ESKOM research department. W.A.S was provided by the Pretoria Sewage Treatment Plant in Pretoria South Africa. The composition of the original limestone and W.A.S is as shown in table 1. The limestone was calcined for 4 hours in an electric furnace. The composition of the calcined limestone is also shown in table 1.
[image:2.595.306.550.118.264.2]A pH-stat apparatus (Fig. 1) was used in the reactivity test. The pH was automatically controlled by titrating sample material with a 1M HCl acid solution. 1.5g of sample material was dissolved in a set amount of distilled water in a reactor. The reactor was placed in a temperature controlled water bath at a set temperature with a resolution of ±1 °C. A three-blade stirrer rotating at specified speed was used for agitation of the sample. The pH in the reactor was measured by a pH electrode inserted in the solution and connected to a pH 200 controller supplied by Eutech Instruments with a resolution of ±0.01. Table 1: Chemical analysis of the original materials.
compound
Percentage present Natural
limestone
Calcined
limestone W.A.S
Calcite (CaCO3) 85.14 50.04 14.29
Lime (CaO) - 36.68 -
Gismondine
(CaAl2Si2O8·4(H2O)) - - 34.98
Quartz (SiO2) 3.80 2.11 31.76
Portlandite (Ca(OH)2) - 6.20 -
Dolomite (CaMg(CO3)2) 8.99 - 3.47
Illite1Mt
(K,H3O)(Al,Mg,Fe)2(Si,Al)4O10
[(OH)2,(H2O)]
2.06 - 9.51
C2S gamma mumme (Ca2SiO4) - - 3.07
Periclase (MgO) - 2.25 2.92
Phlogopite
(KMg3AlSi3O10(F,OH)2) - 2.73 -
When the pH exceeds a set value (pH of 5), a peristaltic pump is activated to add acid to the reaction vessel and reduce the pH to a less value than the set pH. The reactivity was determined directly from a recording of HCl consumed versus time. The fraction of reaction at any time (X) was obtained by the ratio of the volume of HCl consumed at that time to the volume required for complete dissolution.
The first batch of experiments was performed to ascertain whether the addition of W.A.S was improving the reactivity of lime. This was done by putting all the variables constant except ratio of lime to W.A.S. The variables were temperature (60 °C), amount of distilled water (202.5 mL) and stirring speed (225 rpm). The ratio of lime to W.A.S was varied from full lime (1.5 g of lime alone), 2:1, 1:1, 1:2, and full W.A.S (1.5 g of W.A.S alone). The measured value which distinguished the reactivity of the solutions was the reactivity constant (k), the higher it is, the higher the reactivity of the solutions. After confirming that W.A.S actually improves the
reactivity, the second batch of experiments was conducted to investigate and optimize all the variables.
Fig. 1: A schematic drawing of the experimental set-up. (1) Peristaltic pump, (2) pH electrode, (3) pH controller, (4) Acid solution Container, (5) Electronic balance, (6) Stirrer, (7,8) Plastic tubing, (9) Reaction vessel,(10) RS232 Cable, (11) Computer work station, (12) wiring for pH electrode, (13) Connection between pump and controller
Design Expert software version 6.0.6 was used in the second batch of experiments to help in investigating linear, quadratic, cubic and cross-product effects of the four variables on the reactivity of the sample. The software was used for regression analysis of the experimental data to fit a polynomial equation and also for evaluation of the statistical significance of the developed equation. The four variables studied were temperature, lime to W.A.S ratio, liquid (distilled water) to solid (lime mixture) ratio and stirring speed. Table 2 lists the range in which the four independent variables were varied. Table 2: Range of variables
Name Units Low High
temperature deg C 40 80
lime to waste ratio g/g 0.05:1 5:1 liquid to solid ratio ml/g 70:1 200:1
stiring speed rev/sec 100 350
The experimental design used was Central Composite Design (CCD) which comprises a two level full factorial design (24 = 16), eight axial points and six center points. The
center points were used to determine the experimental error and the reproducibility of the data. Alpha (α) value used was fixed at 2. CCD is used to examine the relationship between one or more response and set of quantitative experimental factors or variables. Also it assists in finding the factor settings that will optimize the response. The experiment sequence was randomized in order to minimize the effects of the uncontrolled factors. Each response of the reactivity was used to develop a mathematical model that correlates the reactivity to the absorbent preparation variables through first order, second order, third order and interaction terms, according to the following third order polynomial equation:
∑
∑
,∑
∑
, ,∑
(1)
6
2 7
3
8
4
5 9
10 11 12
[image:2.595.41.295.378.533.2]Where Y is the predicted reactivity, b0 is the first term, bj is
the linear effect, bij is the first order interaction effect, bjj is the
squired effect, bkij is the second order interaction effect and djjj
is the cubic effect [21].
III. KINETICANALYSIS
In a fluid-solid system, the reaction rate may be generally controlled by either; diffusion through the fluid film, diffusion through the product or chemical reaction at the surface of the unreacted materials. The rate of the process is controlled by the slowest of these sequential steps. In order to determine the kinetic parameter and the rate controlling step for the reaction of calcined limestone, the experiment data are analyzed by the basis of the sharp interface or Shrinking Core Model (SCM). SCM assumes that the reaction occurs initially at the particle outer surface then moves towards the center of the particle by means of a narrow reaction front. This model is suitable for a simple reaction of a fluid with a non-porous solid that does not undergo any structural changes. As no product covers the unreacted core as the reaction proceeds due to the turbulent nature of the reaction environment, there can only be two controlling steps, namely; fluid film diffusion or chemical reaction.
If the mass transfer through the fluid film is the rate-limiting step, then:
′ , ′ (2)
If chemical reaction is the rate-limiting step, then:
1 1 , (3)
If the reaction is fluid film diffusion controlled, then a plot of X versus time should be well produced by a straight line, otherwise if it is chemically controlled, a plot of 1-(1-X)⅓
versus time should be presented by a straight line. The value of k’ or k (depending on rate controlling step) is then calculated from the slope of the straight line corresponding to each sample. The k’ or k is the reactivity constant which will be used in both batches of the experiments [20, 22].
[image:3.595.311.546.141.350.2]IV. RESULTSANDDISCUSSION
Fig 2 and 3 shows the reactivity graphs of X versus time and 1-(1-X)⅓ versus time plots respectively. From the diagrams, it
is clear that the reaction is chemically controlled due to the fact that it has a better linear behavior. The reactivity constants are shown in the legend of fig 3. The reactivity constant is a proof that as iron waste is added, the reactivity increases until it reaches a point where the reactivity starts decreasing. In our case the maximum amount of W.A.S which gives the highest reactivity is 33.33% (0.5 g). This behavior has been reported by other researchers using other sources of alumina silicates [14, 16, 23, 24]. The amount of W.A.S generally determines the amount of siliceous materials available for pozzolanic reaction with lime. As the amounts increases, it reaches a stage where all the lime has reacted with the siliceous materials (optimum amount) and this is the highest point in the reactivity. As the amount of W.A.S is increased further, it becomes excess, therefore less amount of lime available to
react with it and less pozzolanic reaction products. Ultimately, the reactivity reduces as the W.A.S amount is increased past the optimum amount.
Fig 2: Effect of Mass transfer through fluid system control on the overall reaction.
Fig 3: Effect of Chemical reaction control of the overall reaction
Table 3 shows the design matrix and output (reactivity constant) of the experiments. 6 runs (1, 9, 11, 12, 22 and 23) at the center point of the design were used to determine the experimental error. The results were reliably consistent. The analysis of the design suggest a quadratic model which shows the significance of adding quadratic terms to the mean and blocks when linear and two factor interaction terms are already in the model.
0 0.2 0.4 0.6 0.8 1 1.2
0 1000 2000 3000 4000 5000
x
Time (Sec)
Mass Transfer Through Fluid System Control
100 % Lime 0% W.A.S
66.67% Lime 33.33% W.A.S
50% Lime 50% W.A.S
33.33% Lime 66.67% W.A.S
0% Lime 100% W.A.S
y = 0.00028406x
y = 0.00033362x
y = 0.00026243x
y = 0.00025474x
y = 0.00023151x
0 0.2 0.4 0.6 0.8 1 1.2 1.4
0 1000 2000 3000 4000 5000
1
‐
(1
‐
X)
^(
1
/3
)
Time (sec)
Chemical Reaction Control
100 % Lime 0% W.A.S
66.67% Lime 33.33% W.A.S
50% Lime 50% W.A.S
33.33% Lime 66.67% W.A.S
0% Lime 100% W.A.S
100% ‐k = 0.00028406
66.67% ‐k = 0.00033362
50% ‐k = 0.00026243
33.33% ‐k = 0.00025474
[image:3.595.313.548.400.600.2]Table 3: Design matrix and results
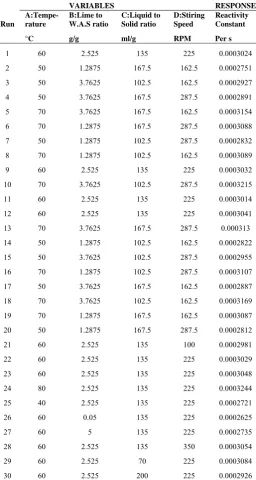
VARIABLES RESPONSE Run
A:Tempe- rature
B:Lime to W.A.S ratio
C:Liquid to Solid ratio
D:Stiring Speed
Reactivity Constant °C g/g ml/g RPM Per s
1 60 2.525 135 225 0.0003024
2 50 1.2875 167.5 162.5 0.0002751
3 50 3.7625 102.5 162.5 0.0002927
4 50 3.7625 167.5 287.5 0.0002891
5 70 3.7625 167.5 162.5 0.0003154
6 70 1.2875 167.5 287.5 0.0003088
7 50 1.2875 102.5 287.5 0.0002832
8 70 1.2875 102.5 162.5 0.0003089
9 60 2.525 135 225 0.0003032
10 70 3.7625 102.5 287.5 0.0003215
11 60 2.525 135 225 0.0003014
12 60 2.525 135 225 0.0003041
13 70 3.7625 167.5 287.5 0.000313
14 50 1.2875 102.5 162.5 0.0002822
15 50 3.7625 102.5 287.5 0.0002955
16 70 1.2875 102.5 287.5 0.0003107
17 50 3.7625 167.5 162.5 0.0002887
18 70 3.7625 102.5 162.5 0.0003169
19 70 1.2875 167.5 162.5 0.0003087
20 50 1.2875 167.5 287.5 0.0002812
21 60 2.525 135 100 0.0002981
22 60 2.525 135 225 0.0003029
23 60 2.525 135 225 0.0003048
24 80 2.525 135 225 0.0003244
25 40 2.525 135 225 0.0002721
26 60 0.05 135 225 0.0002625
27 60 5 135 225 0.0002735
28 60 2.525 135 350 0.0003054
29 60 2.525 70 225 0.0003084
30 60 2.525 200 225 0.0002926
The suggested model is due to the fact that the probability (prob>F) is much less than 0.05 (for 95% confidence level). Through multiple regression analysis, the response was correlated to the four variables using polynomial model equation, which after excluding insignificant terms, is given by:
k = 3.037X10⁻⁴ + 1.337X10⁻⁵ A + 3.983X10⁻⁶ B – 2.628X10⁻⁶
C + 1.212X10⁻⁶ D – 7.631X10⁻⁶ B2 + 7.988X10⁻⁷ D2 –
9.122X10⁻⁷ AB (4)
Where A represents reaction temperature, B represents lime to W.A.S ratio, C represents liquid to solid ratio, D represents
stirring speed and finally k represents the reactivity constant. Positive sign before the terms indicates synergistic effect while negative sign indicates antagonistic effect. From the empirical model equation, temperature (A) has the highest coefficient which means that it has the largest effect in a positive manner. It is followed by the quadratic effect of lime to W.A.S ratio (B) which is antagonistic, then its linear effect. Another antagonistic effect is shown by liquid to solid ratio and finally temperature-lime to W.A.S ratio combined (interactional) effect where the later effect is the least overall. Stirring speed effect is the least in both linear and quadratic effect although both were synergistic.
From statistical point of view, there are three tests required to evaluate the model: test of significance of factors (SOF), R-squared test (R2) and lack of fit test (LOF). Table 4 shows the
[image:4.595.304.538.297.477.2]analysis of variance (ANOVA) which checks the adequacy and significance of the model.
Table 4: Analysis of variance table
Analysis of variance table [Partial sum of squares] Sum of Degrees of Mean F Source Squares Freedom Square Value
Model 6.61653E-09 7 9.45E-10 109.6079
A 4.28698E-09 1 4.29E-09 497.1202
B 3.80799E-10 1 3.81E-10 44.15755
C 1.65727E-10 1 1.66E-10 19.21776
D 3.52668E-11 1 3.53E-11 4.089548
B2 1.65634E-09 1 1.66E-09 192.0703
D2 1.81515E-11 1 1.82E-11 2.104855
AB 1.33134E-11 1 1.33E-11 1.543824
Residual 1.72473E-10 20 8.62E-12 -
ANOVA is the most effective analysis technique in central cubic design. The significance of the empirical model was indicated by the fisher variance ratio (the F-test value), which is a statistically means of measuring how well the empirical model describe the variation in the data about its mean. The greater the F-value is from unity, the more certain it is that the empirical model explains adequately the variation in the data about its mean and that the estimated significant terms of the variables are real. The model F value is 109.61 which imply that the regression model is reliable in predicting the reactivity within the range of variables studied at 95% confidence level. On the same point, the effect of the variables could be checked via the F value on which the higher the value, the larger the effect. With 95% confidence level, the coefficient of determination (actual R2) value for our model is 0.978 which
implies that 97.8% of the total variation in the reactivity responses is attributed to the experimental variables on study and could be explained by the empirical model eq. 4. The predicted R2 was in reasonable agreement with the adjusted R2
slope is also shown. It is clear from the figure that the model equation provides an accurate description of the experimental data therefore a good correlation between the variables and the reactivity. Therefore the fitted regression equation showed good fit of the models and was successful in capturing the correlation between the variables. From these statistical and validity tests, it was found that the model is adequate for predicting the reactivity within the range of the variables studied.
Fig 4: Model experimental (actual) reactivity constants versus predicted reactivity constant.
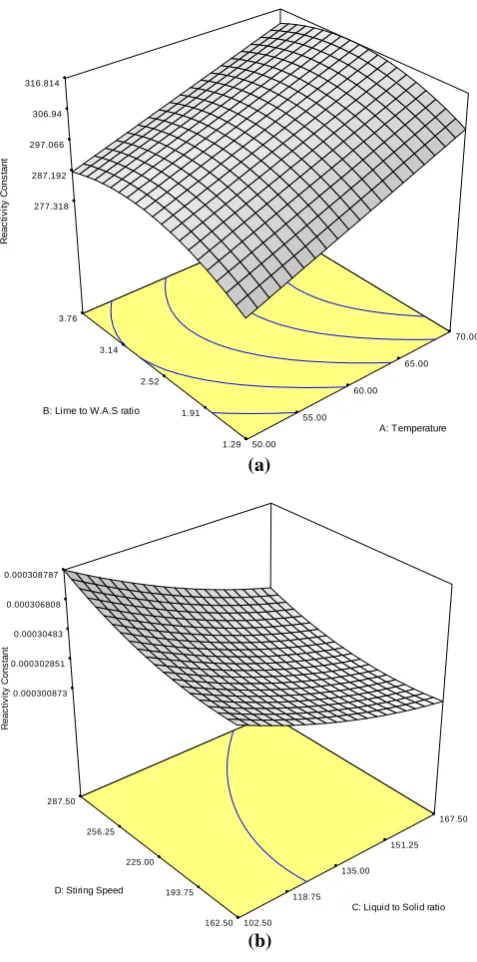
The response in table 4 shows that the variables have great effect on the reactivity. With a proper selection of the variables, the reactivity increases. Fig 5a shows the three dimensional view of the relationship of temperature and/or lime to W.A.S ratio with reactivity constant other variables held constant at the central values, while fig 5b shows the relationship between liquid to solid ratio and/or stirring speed with reactivity constant the other constants held constant at the central value. These figures facilitate and elaborate the effect of the variables on the reactivity. The response surface in Fig 5a has a mini-max (sinusoidal) behavior while in Fig 5b is a continuous slope.
From Fig 5a, the temperature effect is seen to increase reactivity. This is expected from the exponential dependence of the reactivity rate constant in Arrhenius equation reported in literature [20]. As explained earlier, solubility/dissolution of reactants is the major factor affecting the formation of the products from pozzolanic reactions. Reactions involving Alumina silicates typically start with the digestion of vitreous alumina (Al2O3) and/or silica (SiO2) by alkaline water. The
dissolved Al2O3 and/or SiO2 will then react with lime to form
reactive products.
(a)
[image:5.595.121.290.188.412.2](b)
Fig 5: Three dimensional graphs showing the relationship between two variables and the response. a) Temperature and/or lime to W.A.S ratio versus reactivity constant. b) Liquid to solid ratio and/or stirring speed versus reactivity constant.
Therefore the increase in reactivity due to temperature can be due to the fact that higher solubility of alumina silicates increases with increase in temperature thus resulting in more pozzolanic products being formed [14, 17, 24]. The effect of temperature might also be due to its involvement in release of low-molecular weight reactants from the matrix structure resulting in pore development and porosity which increases the reaction surface area resulting to higher reactivity [25]. Another possibility is that the relative importance of surface DESIGN-EXPERT Plot
Reactivity Constant
Actual
P
redi
c
te
d
Predicted vs. Actual
2.61E-04 2.77E-04 2.94E-04 3.10E-04 3.26E-04
2.61E-04 2.77E-04 2.94E-04 3.10E-04 3.26E-04
277.318 287.192 297.066 306.94 316.814
R
eac
ti
v
ity
C
ons
tant
50.00 55.00
60.00 65.00
70.00
1.29 1.91 2.52 3.14 3.76
A: Temperature B: Lime to W.A.S ratio
0.000300873 0.000302851 0.00030483 0.000306808 0.000308787
R
e
ac
ti
v
ity
C
o
n
s
ta
nt
102.50 118.75
135.00 151.25
167.50
162.50 193.75 225.00 256.25 287.50
reaction versus solute transport control of the overall dissolution process depends on temperature. The ratio of hydrogen ion activity at the surface to the hydrogen ion activity in the solution ,
, is an indication of the reaction control mechanism. The closer this ratio is to 1, the more the overall reaction is controlled by the relatively slower rate of surface reaction. At low temperature the ratio is closer to 1 but it decreases slightly with increasing temperature indicating increasing effect of solute transport and dissolution [20]. It has been generally accepted that a diffusion-controlled process is characterized by being slightly dependent on temperature, while chemically-controlled process is strongly dependent on temperature [20].
The behavior of lime to W.A.S ratio as explained earlier is that, when lesser amount of W.A.S is used, there is insufficient alumina silica to react completely with lime, producing only a limited amount of calcium aluminates silicates compounds, therefore the products become less reactive. On the other hand, when the amount of W.A.S is increased, there will be more alumina silicates to react with calcium until an optimum amount of W.A.S (therefore highest reactivity), after which if more W.A.S is added, there will be an excess, which will begin be detrimental to reactivity [24]. Antagonistic effect of liquid to solid ratio was likely because fewer amounts of reactive products are formed with high liquid to solid ratio. An optimum liquid to solid ratio can double the reactivity [26], although the effect of this variable is considerably low. Stirring speed has the least effect in both linear and quadratic category. This result has also been reported adversely in literature where the stirring speed has been found to contribute negligibly in reactions [27, 28]. Still the low synergistic effect of stirring speed may be due to enhancement of mass transfer caused by the agitation. Increase in stirring speed enhances the convective mass transfer between liquid and solid, thus promoting dissolution [29].
V. CONCLUSION
Investigation to see the effect of W.A.S on the reactivity of lime was carried out in the first batch of experiments. From the results, it was seen that the effect of W.A.S had a sinusoidal behavior where it increases the reactivity of lime to a certain amount after which the reactivity starts to reduce. Shrinking core model was used and chemical reaction control was found to be the rate limiting step rather than mass transfer through the fluid film due to its higher linear behavior. Apart from lime to W.A.S ratio, the effect of other variables (temperature, liquid to solid ratio and stirring speed) were also investigated in the second batch of experiments. Design expert software was used for regression analysis of the experimental data. It was found that the temperature had the highest effect in the reaction followed by lime to W.A.S ratio, then liquid to solid ratio and finally the stirring speed which had the least effect both linearly and quadraticaly. All variables (in linear, quadratic and interactive terms) had synergistic trend, except the linear effect of liquid to solid ratio, the quadratic effect of lime to W.A.S ratio and the interactive effect of temperature-lime to W.A.S ratio, which had antagonistic effect. An investigation in the higher range of the variables is
recommended so that the optimum higher values of the variables are acquired and the highest synergistic effect is achieved.
NOTATION
a stoichiometric coefficient of solid reactant Cg bulk concentration of fluid reactant, mol cm−3
ds initial radius of solid reactant, cm
k reaction rate constant, cm s−1
Ms molecular weight of solid reactant, g gmol−1
t time taken (sec) X conversion of Ca(OH)2
Greek letters
β mass transfer coefficient, cm2 s−1
ρs density of solid reactant, g cm−3
REFERENCES
1. Grubor, B., V. Manovic, and S. Oka, An experimental and modeling study of the contribution of coal ash to SO2 capture in fluidized bed combustion. Chemical Engineering Journal, 2003. 96(1-3): p. 157-169. 2. Manovic, V. and E.J. Anthony, Sequential SO2/CO2
capture enhanced by steam reactivation of a CaO-based sorbent. Fuel, 2008. 87(8-9): p. 1564-1573. 3. Romeo, L.M., et al., Optimizing make-up flow in a
CO2 capture system using CaO. Chemical
Engineering Journal, 2009. 147(2-3): p. 252-258. 4. Dahlan, I., et al., Selection of metal oxides in the
preparation of rice husk ash (RHA)/CaO sorbent for simultaneous SO2 and NO removal. Journal of Hazardous Materials, 2009. 166(2-3): p. 1556-1559. 5. Al-Shawabkeh, A., H. Matsuda, and M. Hasatani,
Dry, high-temperature De-SO2 and De-H2S via treated calcium-based materials. Energy Conversion and Management. 38(10-13): p. 1389-1397.
6. Hill, F.F. and J. Zank, Flue gas desulphurization by spray dry absorption. Chemical Engineering and Processing, 2000. 39(1): p. 45-52.
7. Mochida, I., et al., Removal of SOx and NOx over activated carbon fibers. Carbon, 2000. 38(2): p. 227-239.
8. Ghosh-Dastidar, A., et al., Ultrafast calcination and sintering of Ca(OH)2 powder: Experimental and modeling. Chemical Engineering Science, 1995. 50(13): p. 2029-2040.
9. Han, K., et al., Effect of characteristics of calcium-based sorbents on the sulfation kinetics. Fuel, 2005. 84(14-15): p. 1933-1939.
11. Davini, P., Investigation of the SO2 adsorption properties of Ca(OH)2-fly ash systems. Fuel, 1996. 75(6): p. 713-716.
12. Fernández, J., et al., Preparation and characterization of fly ash/hydrated lime sorbents for SO2 removal. Powder Technology, 1997. 94(2): p. 133-139.
13. Dahlan, I., et al., Evaluation of various additives on the preparation of rice husk ash (RHA)/CaO-based sorbent for flue gas desulfurization (FGD) at low temperature. Journal of Hazardous Materials, 2009. 161(1): p. 570-574.
14. Zainudin, N.F., et al., Study of adsorbent prepared from oil palm ash (OPA) for flue gas desulfurization.
Separation and Purification Technology, 2005. 45(1): p. 50-60.
15. Lee, K.-T., et al., Development of kinetic model for the reaction between SO2/NO and coal fly ash/CaO/CaSO4 sorbent. Fuel, 2008. 87(10-11): p. 2223-2228.
16. Lin, R.-B., S.-M. Shih, and C.-F. Liu, Characteristics and reactivities of Ca(OH)2/silica fume sorbents for low-temperature flue gas desulfurization. Chemical Engineering Science, 2003. 58(16): p. 3659-3668. 17. Keat Teong Lee, S.B., Abdul Rahman Mohamed,
Preparation and characterization of sorbents prepared from ash (waste material) for sulfur dioxide (SO2) removal. J Mater Cycles Waste Management, 2004. 2005(7): p. 16-23.
18. Karatepe, N., et al., Preparation of diatomite/Ca(OH)2 sorbents and modelling their sulphation reaction. Chemical Engineering Science, 2004. 59(18): p. 3883-3889.
19. Cecil Lue Hing, D.R.Z., Richard Kuchenrither,
municipal sewage sludge management: process, utilization and disposal. Vol. 4. 1992: technomic publishing company inc.
20. Siagi, Z.O. and M. Mbarawa, Dissolution rate of South African calcium-based materials at constant pH. Journal of Hazardous Materials, 2009. 163(2-3): p. 678-682.
21. Montgomery, D., Design and Analysis of Experiments. 5 ed. 2001, New York: John Wiley and Sons.
22. Renedo, M.J. and J. Fernández, Kinetic modelling of the hydrothermal reaction of fly ash, Ca(OH)2 and CaSO4 in the preparation of desulfurant sorbents.
Fuel, 2004. 83(4-5): p. 525-532.
23. Lin, R.-B. and S.-M. Shih, Characterization of Ca(OH)2/fly ash sorbents for flue gas desulfurization.
Powder Technology, 2003. 131(2-3): p. 212-222. 24. Lee, K.T., et al., Optimum conditions for preparation
of flue gas desulfurization absorbent from rice husk ash. Fuel, 2005. 84(2-3): p. 143-151.
25. Sumathi, S., et al., Optimization of microporous palm shell activated carbon production for flue gas desulphurization: Experimental and statistical studies. Bioresource Technology, 2009. 100(4): p. 1614-1621.
26. Matabola, K.P., The effects of hydrating agents on the hydration of industrial magnesium oxide, in
Chemistry. 2006, University of South Africa: Pretoria. p. 100.
27. DemirkIran, N., A study on dissolution of ulexite in ammonium acetate solutions. Chemical Engineering Journal, 2008. 141(1-3): p. 180-186.
28. Aphane, M.E., The hydration of magnesium oxide with different reactivities by water and magnesium acetate, in Chemistry. 2007, University of South Africa: Pretoria. p. 160.
29. Xiang, G., et al., Dissolution rate of limestone for wet flue gas desulfurization in the presence of sulfite.