Solving Distribution System Overload Contingency
Using Fuzzy Multi-Objective Approach Considering
Customer Load Pattern
Majid Jamil, Amit Sharma
Abstract— This paper presents the study of overload
contingency in the distribution system using fuzzy multiobjective approach considering customer load pattern. A model of 25 bus distribution system having five feeders, 20 loads and 29 distribution lines is simulated using Mi-Power software. Customer load pattern of the distribution system is designed using MATLAB. Taking the advantage of handling uncertain and vague data, the fuzzy multiobjective approach is used in this study to minimize power loss, nodal voltage deviation and load balancing among feeders. Based on the values obtained from the objective functions, switching operation is performed by which overload contingency is solved. A comparison of results obtained from fuzzy multiobjective approach with conventional switching operation is also presented.
Keywords: Multiobjective approach, Customer load pattern, Overload contingency, Distribution system.
I. INTRODUCTION
Electrical power distribution is the portion of the power delivery infrastructure that takes the electricity from the highly meshed, high–voltage transmission circuits and delivers it to customers. A distribution system is a complex structure comprises a number of loads having different characteristics. These loads are connected to the distribution system through different electrical devices like circuit breaker, tie switches, transformers etc. A distribution system is designed in such a way that all the consumers, which are located in that area, come in its reach i.e. each and every consumer is provided with the power supply. In case of distribution system contingency; which may be overloading of feeder or fault taking place in the distribution line; the supply should be provided through the alternate paths to the customers by other feeder having adequate power supply. For that, the whole of the distribution system must be interconnected by the closed/open tie switches such that by closing or opening of one of them transfer the load from one region to another.
A number of switching operations are required to transfer the load from one service feeder to another service feeder. The switching of load should be such that after the switching no further overloading of the service feeder takes place. In such uncertainties of switching operation of loading and unloading feeder, taking thebeen presented in the literature describing distribution system contingency. C.S Chen. et al. [1] applied an explicit search method to identify feasible switching options under the constraint of radial structure. M.M. Adibi et al. [2] proposed a systematic search
A. Dr. Majid Jamil, Associate Professor, Department of Electrical Engineering, Jamia Millia Islamia University, New Delhi, India. [email protected]
B. Amit Sharma is pursuing Ph. D in the Department of Electrical Engineering, Jamia Millia Islamia, New Delhi, India.
advantage of handling uncertain and vague data, fuzzy logic can be implemented in the proposed work. A number of papers have method based on the main search path of the candidate feeder and evaluation functions with weighting factors and heuristic rules. An algorithm for network reconfiguration based on a Heuristic-Expert approach to minimize the real power loss through network reconfiguration of a distribution network avoiding the deviation in bus voltages and branch current violation is proposed by V.V.K. Reddy and M. Sydulu [3].
A method for feeder reconfiguration with the potential for handling realistic operating constraints is also used and presented by Taylor and Lubkeman [4]. Chin Hong-Chan et al. [5] developed a new approach to solve the distribution feeder reconfiguration problem for loss reduction and service restoration. The Taiwan power company (Tie power) in paper [6] has determined the daily load profiles of distribution feeders by using customer information in a customer information system (CIS) and information between customers and distribution transformers in an outage management information system (OMIS). An algorithm for fuzzy mu1tiobjective programming is also presented by Tzeng and Hsu [7]. This new algorithm integrates the fuzzy multiobjective programming methods developed by Hannan (1981) and Sakawa (1983). The network reconfiguration at the power distribution systems with dispersed generations (DG) for loss reduction is described by Joon-Ho Choi et al. [8]. Ying-Tung Hsiao [9] proposed a multiobjective evolution programming method for distribution feeder reconfiguration in a practical system. A technique based on non dominated sorting genetic algorithm-II (NSGA-II) is used for solving the service restoration problem in an electric power distribution system by Yogender Kumar and Biswarup Das [10]. C.S. Chen described the load survey system to determine the load characteristics of various customer classes in a utility. The questionnaires are adopted to find the power consumption of key electric appliances. The actual power consumption of hundreds customers are collected by intelligent meters. The sampling theory has been applied to find the proper sample size of both questionnaires and field test so that the customer load characteristics may be derived with sufficient confidence level. The statistic analysis is then performed to find the power consumption model of each customer class based on the power measurement of field test.
and informal analysis methods. An algorithm for network reconfiguration based on the heuristic rules and fuzzy multiobjective approach is proposed by Debapriya Das [11]. Multiple objectives are considered for load balancing among the feeders and also to minimize the real power loss, deviation of nodes voltage, and branch current constraint violation, while subject to a radial network structure in which all loads must be energized. However the methods applied before not considered the customer load pattern due to which it is not possible to estimate that at what time the overloading of distribution system occurs. In the present study customer load pattern is being considered and with its help inference is drawn at which time overloading is occurring in the system. Customer load pattern also give the information about the load margins of other feeders. Hence a set of feeder is easily formed on which the loads can be transferred to remove the overloading in the distribution system. Since, load study is an important work in utilities to support various functions of system planning and operation. It is to identify not only the customer power consumption, but also the loading variation of distribution feeders and main transformers by means of load analysis. Therefore the load information is used to find the hourly current flows of all line switches by allocating the feeder loading profiles to each service zone according to the variation of customer load behavior. With more and more pressure of deregulation and independent power producers, the determination of customer load characteristics provide utility companies better marketing strategy and make full use of the power system apparatus to upgrade the system operation efficiency. Multiple objectives are considered for load balancing among the feeders to minimize the real power loss and deviation of nodes voltages subject to a network restructure in which all load get energized. Based on the value obtained from the objective functions, switching operation is performed by which overload contingency is solved. According to the restoration algorithm rules the difference in voltage across all the open tie-switches is calculated.
II. SYSTEM MODELING IN FUZZY FRAMEWORK In fuzzy domain, each objective is associated with a membership function. The membership function indicates the degree of satisfaction of the objective. In the crisp domain, either the objective is satisfied or it is violated. On the contrary, fuzzy sets entertain varying degrees of membership function values from zero to unity. Thus fuzzy set theory is an extension of standard set theory. When there are multiple objectives to be satisfied simultaneously, a compromise has to be made to get the best solution. One solution methodology for the multiple objective optimizations in fuzzy frame work is based on max-min principle which is described as follow:
1. For each option considered, the degrees of satisfaction of all the different objectives are evaluated.
2. The degree of overall satisfaction for this option is the minimum of all the above degrees of satisfaction.
3. The optimal solution for the system is the maximum of all such degrees of satisfaction.
In order to solve multiobjective linear programming problems, Zimmermann (1978) formulated the concept of fuzzy programming, which assumes that the "fuzzy" goals of the decision maker (DM) can be quantified through the use of so-called membership functions. Following Zimmermann's study, Hannan, 1981; Leberling, 1981; Sakawa, 1983 proposed various kinds of membership functions and operators to derive noninferior solutions for multiobjective linear programming problems. In
general, the multiobjective linear programming problem is expressed as:
Max
[
Z
(
X
)
=
[
Z
1(
X
),
Z
2(
X
),...
..
Z
n(
X
)]
Subject to:
X
ε
S
(1) Where Z(x) is the multiobjective function for Zi(x) for i=l to n,and S is the region of feasible solutions. By using the weighted-sum operator, Hannan (1981) derived the fuzzy goal programming model to solve the multiobjective linear programming problems problem in the form of:
Min
∑
=
n
i
d
w
1 1 1
Subject to:
U
i(
Z
i)
−
d
i++
d
i−≤
f
i where i= 1, 2…n
X
ε
S
(2)Where
d
i+ andd
i− are the ith positive and negative deviations. “f
i” represent the value of satisfying of the ith objective in themembership function and
U
i(
Z
i)
is the decision maker’s membership value of the ith objective. Using the max-min operator, Sakawa (1983) derived another fuzzy programming model for solving the multiobjective linear programming problems in the form of:Max
{
min
[
i(
i)]}
iU
Z
Subject to:
X
ε
S
(3) WhereU
i(
Z
i)
is the decision maker’s membership value of theith objective.
III. FUZZY MEMBERSHIP FUNCTIONS
In the proposed study overload contingency is solved using fuzzy multiobjective approach. In fuzzification, the first step is to identify the parameters that influence the outcome. Then membership functions are defined for the identified parameters before applying the fuzzy rules. The identified objectives/ parameters for solving overload contingency in this study includes minimization of the system’s power loss
(
μ
Li
)
, minimization ofthe deviation of nodes voltage
(
μ
Vi
)
and load balancing among various feeders(
μ
Bi
)
. The membership functions for all thethree objectives are discussed below.
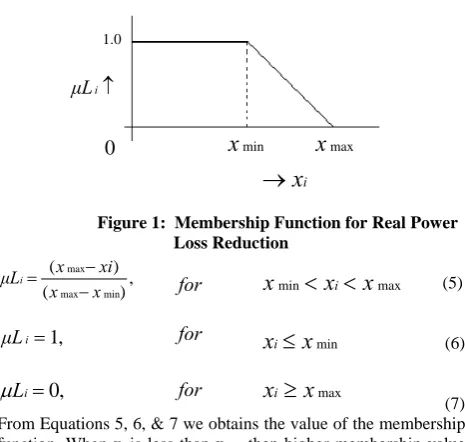
1. Membership Function for Real Power Loss Reduction
( )
μ
L
i :The basic purpose of this membership function is to reduce the real power loss of the system. A variable xi is defined as the ratio
of the total real power loss of the distribution system ith branch in
the loop is opened to the total real power loss before network reconfiguration. Hence, let us define
For i = 1, 2, 3……., Nk. (4)
Where Nk is the total number of branches in the loop including
tie-branch, when ith tie-switch is closed, Ploss(i) is the total real power
loss of the distribution system when ith branch in the loop is opened; and Ploss0 is the total real power loss before network
reconfiguration. Equation (4) indicates that if xi is high, power loss
reduction is low and, hence, a lower membership value is assigned and if xi is low, the power loss reduction is high and a higher
membership value is assigned. The membership function for real ,
) (
°
=
loss i loss i
power loss reduction is given in Figure 1. From Figure 1 equations can be written as,
Figure 1: Membership Function for Real Power Loss Reduction (5) (6) (7) From Equations 5, 6, & 7 we obtains the value of the membership
function. When xi is less than xmin then higher membership value
is assigned to
μ
L
i. Similarly when xi is greater than xmax thenlower membership value is assigned to
μ
L
i.In the present work, it has been assumed that xmin =0.4 and xmax =1.0. This means that ifthe loss is 40% or less of the Ploss0, the unity membership value is
assigned and if the loss is 100% or more of Ploss0, the zero
membership value is assigned.
2. Membership Function for Maximum Node Voltage Deviation:
The basic purpose of this membership function is to minimize or to keep the nodes voltage deviation less. A variable yi is defined as
the maximized difference of the voltage of node corresponding to the opening of the kth branch in the loop and voltage of the substation. Let us define
yi = max | Vi, j –Vs |
for i = 1, 2… Nk ;j = 1, 2… NB (8)
where Nk is total number of branches in the loop including the tie
branch, when the kth tie-switch is closed; NB is total number of
nodes of the system; Vs is voltage of the substation (in per unit)
and Vi, j is voltage of node j in per unit corresponding to the
opening of the ith branch in the loop. If the maximum value of nodes voltage deviation is less, then a higher membership value is assigned and if deviation is more, then a lower membership value is assigned. Figure 2 shows the membership function for maximum node voltage deviation. The equations can be written as,
Figure 2: Membership Function for Maximum Node Voltage Deviation (9) (10) (11) From Equations 9, 10 & 11 we obtains the value of the
membership function. In the present work, ymin = 0.04 and ymax =
0.09 have been considered. ymin = 0.04 means if the substation
voltage is 1.0 p.u., then the minimum system voltage will be 0.96 p.u. and if the minimum system voltage is greater than or equal to 0.96 p.u., the unity membership value is assigned. Similarly, if ymax = 0.09, the minimum system voltage will be 0.91 p.u. and if
the minimum system voltage is less than or equal to 0.91 p.u., the zero membership value is assigned.
3. Membership Function for Feeder Load Balancing
( )
μ
B
i :Load balancing is one of the major objectives of feeder reconfiguration. An effective strategy to increase the loading margin of heavily loaded feeders is to transfer part of their loads to lightly loaded feeders. Hence the basic purpose of this membership function is to balance the feeder loading. For this purpose a feeder load balancing index is defined as,
(
)
I j i I j i IFF IF IFF FLB ,, = − , for i = 1, 2… Nk; j=1, 2...NF
(12)
Where, Nk is total number of branches including the tie branch in
the loop when the kth tie-switch is closed; N
F is total number of
feeders; IFi, j is current of feeder j corresponding to the opening of
the ith branch in the loop; IFFimax is the maximum of all the feeder
currents corresponding to the opening of the ith branch in the loop. A variable ui is defined which is the maximum of feeder load
balancing index for the opening of a corresponding branch in a particular feeder. The variable is defined as,
for i = 1, 2… Nk ; j = 1, 2…NF
(13) Equation (13) indicates that a better load balancing can be
achieved if the value of ui is low. Therefore, for lower ui, a higher
membership value is assigned and for higher ui, a lower
membership value is assigned. Figure 3 shows the membership function for feeder load balancing. From Figure 3, equations can be written as
Figure 3: Membership Function for Feeder Load Balancing
(14) (15) (16) From Equations 14, 15 & 16 we obtains the value of the
membership function. In the present work, the values as umin =
0.08 and umax = 0.45 have been considered. umin = 0.08 indicates
that the maximum deviation of feeder currents will be 8% with respect to the maximum value of feeder current and if this deviation is less than or equal to 8%, the unity membership value is assigned and umax = 0.45 indicates that if this deviation is greater
than 45%, a zero membership value is assigned.
At the same time, in network structure all loads must remain energized after network reconfiguration. These three objectives are modeled with fuzzy sets to evaluate their imprecise nature. Heuristic rules are also incorporated in the proposed 0
. 1
0
min
y ymax
↑ i V μ i y → max
min
x
x
x
<
i<
for
i
x
→
min
x
x
max, ) ( ) ( min max max x x xi x μLi
− − = , 1 = i
μL
for
x
i≤
x
min,
0
=
iL
μ
forx
i≥
x
max, ) ( ) ( min max max y y yi y Vi − − =
μ
for ymin < yi< ymax,
1
=
i
V
μ
fory
i≤
y
minfor
,
0
=
iV
μ
y
i≥
y
max[
FLB
(
i
,
j
)
]
max
u
i=
0 . 1
0
↑
iB
μ
iu
→
u
maxmin
u
,
1
=
iB
μ
,
0
=
iB
μ
for forfor
maxmin
u
u
u
<
i<
max u ui≥
algorithm for minimizing the number of tie-switch operations. The tie switches are used to transfer load from one feeder to another feeder. For example, when the kth tie switch of a distribution
system is closed, a loop is formed with Nk number of branches in
the loop. Now, opening each branch in this loop is an option. After opening the ith branch in this loop (radial structure is retained), the load-flow analysis was carried out to compute the membership functions. The degree of overall satisfaction for this option is the minimum of all the above membership values evaluated as;
for i=1, 2 …Nk (17)
Where Dk,i is the overall degree of satisfaction which is the
minimized value among all the membership function for the opening of an ith branch when a kth tie-switch is closed. Next the
optimal solution is defined which is the maximum of all such overall degrees of satisfaction. Now, a fuzzy decision for an optimal solution may be defined as the choice that maximizes all such overall degrees of satisfaction and if we interpret this as a logical “or” we can model it with the union of fuzzy sets. In the present work, the classical fuzzy set union is used and the fuzzy decision for an optimal solution is then given as;
for i=1, 2 …Nk (18)
Hence based on the value of optimal solution the branch “ith”
is selected which is opened with the closing of “kth” tie-switch.
[image:4.595.315.552.185.452.2]Now to minimize the number of tie-switch operations the voltage difference across all the open tie switches is calculated and the open tie switch across which the voltage difference is maximum get selected. If this maximum voltage difference is greater than some specified value (
ε
), then this tie switch is considered. The valueε
denotes the voltage difference across the open tie-switches. It is expected that because of the largest voltage difference, this switching will cause maximum loss reduction, improve minimum system voltage, and will provide better load balancing. In the next iteration, the same procedure is repeated for the remaining tie-switches and so forth. If, in any iteration, this maximum voltage difference is less than the specified value (ε
), then this tie-switch operation is discarded and automatically other tie-switch operations are also discarded because the voltage difference across all other open tie switches is less thanε
. A flowchart is developed to implement the approach to solve the overload contingency in distribution system is shown in figure 4. On the basis of customer load pattern, hourly loading of all service zones is derived using proposed algorithm. In the present work the value ofε
= 0.03 is taken.Figure 4: Flowchart to Solve the Overload contingency in Distribution System
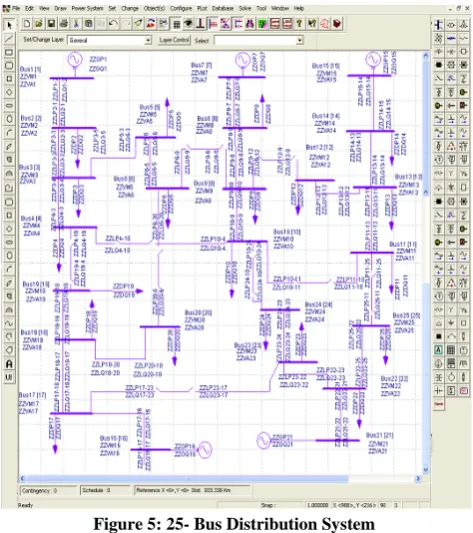
IV. DISCRIPTION OF DISTRIBUTION SYSTEM A distribution system shown in figure 5, which servers a mixture of customers is selected for simulation using mi-power software. The distribution system comprising of 25-bus system, 5 service zones which are getting supply through five feeders Fd1, Fd2, Fd3,
Fd4 and Fd5.These service zones are connected through 29
[image:4.595.51.281.540.680.2]distribution lines having opening sectionalizing (normally closed) and closing tie (normally open) switches. There are in total 20 opening sectionalizing (normally closed) switches and 9 closing tie (normally open) switches connected between the distribution lines and buses. Through these switches the loads are transferred from one feeder to another. The closed distribution lines are connected through opening sectionalizing (normally closed) switches and open distribution lines are connected through closing tie (normally open) switches.
Figure 5: 25- Bus Distribution System
In the distribution system loads on bus 2, bus 3, bus 4, bus 5 & bus 6 are supplied through feeder 1(Fd1) which comes under zone
1(Z2). In case of contingency the supply can be restored from
feeder Fd2 and Fd4 by closing tie-line tie-2 and tie-5 respectively.
In the same manner service zone Z2 is getting supply through
feeder Fd2, zone Z3 from feeder Fd3, Z4 from feeder Fd4 and
service zone Z5 is getting supply through feeder Fd5.The bus
voltages and load voltages are shown along the buses. The tie-switch lines are shown by the open lines across the two different zones. In the normal condition all the lines work with in their limits. The customer load pattern for the distribution system is drawn in figure 6 using matlab. Interpretation about the variation of load across the feeder can easily be drawn from the curve.
Figure 6: Customer Load Pattern
}
B
,
L
min{
,,i i i i
k
V
D
=
μ
μ
μ
} max{ k,i
k D
[image:4.595.314.560.606.744.2]From the customer load pattern it is seen that at about the 3 p.m. the feeder Fd1 and Fd2 get overloaded. Feeder Fd3, Fd4 and Fd5
have adequate margin at that time. Hence the candidate for the switching operation can be searched among these three feeders Fd3, Fd4 and Fd5.
V. RESULTS & DISCUSSION
First the load flow analysis is performed on the system in the normal condition when all the bus voltages are in their limits. The
total real power loss before the network reconfiguration
(
P
loss°)
is calculated. The total real power loss in normal condition before network reconfiguration was 47.7578 kW. After the distribution system gets overloaded, there is increase in the total real power losses of the system. Also the buses voltage gets reduced from their minimum value. The lines got overloaded due to the sudden increase in the load. During overloaded condition in the distribution system, the total real power loss increased to 99.0123 kW. The bus voltages of bus 3, bus 4, bus 5, bus 6, bus 11, bus 12 and bus 13 crosses their lower limit. The transmission lines between bus 3 and bus 5, between bus 5 and bus 6 get overloaded. Similarly transmission line between bus 11 and bus 13 and transmission line between bus 13 & bus 14 get overloaded. Now the rule based algorithm procedure is followed to solve the overloading problem in the distribution system. For this the fuzzy multiobjective functions along with the restoration flowchart rules is followed and the candidate is searched to from the overloaded feeders to transfer it to the other feeders having adequate margin. On analyzing the tie switch 1 which tie-up feeder 1(Fd1) and
feeder 2(Fd2) is selected. The loop 1 is now made by closing the
tie-switch 1 between bus 6 and bus 9. The load flow analysis is now performed on the loop by opening one branch at a time and the corresponding membership function of Real Power Loss Reduction, Maximum Node Voltage Deviation and Feeder Load Balancing will be formed based on these analyses. Now the load flow analysis is performed on the loop 1. The output numerical values obtained from the calculation are used for fuzzification. These are crisp values and are handled with fuzzy logic. The overall value obtained from fuzzification used for checking the effectiveness of the proposed scheme
.
1. Membership Function for Real Power Loss Reduction
( )
μ
L
i :The different values for the real power loss reduction being calculated are given in table 1.
Table 1: Real power loss reduction
Branch No. Power loss (when branch is open)
1 191.2 1.9311 0
2 156.15 1.57716 0
3 91.07 0.9198 0.1336
4 88.44 0.8932 0.1780
5 99.01 1 0
6 138.63 1.4 0
7 159.50 1.6109 0
2. Membership Function for Maximum Node Voltage Deviation:
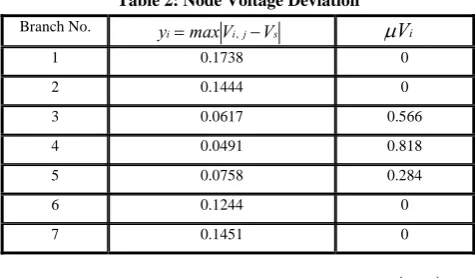
[image:5.595.313.551.90.229.2]The different values for the maximum node voltage deviation being calculated are given in table 2.
Table 2: Node Voltage Deviation
3. Membership Function for Feeder Load Balancing
( )
μ
B
i :The different values for the feeder load balancing being calculated are given in table 3.
Table 3: Feeder Load Balancing
Branch No.
Feeder 1 Feeder 2 Feeder 1 Feeder 2
1 0 1560.858 1 0 1 0
2 124.421 1383.774 0.91 0 0.91 0
3 607.641 801.044 0.2414 0 0.2414 0.56378
4 809.383 595.201 0 0.2646 0.2646 0.50108
5 1043 377.972 0 0.6376 0.6376 0 6 1388.885 92.99 0.933 0.2531 0.933 0
7 1513.657 0 0 1 1 0
The value of the output corresponds to the branch number which is to be opened to transfer the load from the overloaded feeder Fd1 to
the feeder Fd2. From the inter-relationship between the fuzzy
[image:5.595.311.562.604.723.2]decision for overall satisfaction and the three inputs, it is possible to formulate simple logic base for determining the degree of satisfaction from the values of these three inputs. However, because of the approximations involved, the different inputs are represented by appropriate, corresponding fuzzy variable. After fuzzification, the fuzzified inputs are given to the fuzzy inference engine, which, following the fuzzy rule base, gives the line switch at its output. The different conditions are obtained by opening the branches and calculating the magnitude of voltages and current across them. The different value gives different defuzzified output. By the fuzzification we obtained the optimal solution. The value of this optimal solution is significantly corresponds to a branch in the loop. For the first iteration we obtained the optimal solution from the table 4.
Table 4: Optimal Solution
Branch no.
μ
V
iμ
L
iμ
B
iD
k i ,1 0 0 0 0
2 0 0 0 0
3 0.1336 0.566 0.56378 0.1336
4 0.178 0.818 0.50108 0.178
5 0 0.284 0 0
6 0 0 0 0
7 0 0 0 0
(19) The optimal solution corresponds to the D1, 4 for branch 4 when
tie-switch 1 is closed. For first iteration the branch 4 will be opened and tie-switch 1 will be closed. Hence after opening the
Branch No.
1 0.1738 0
2 0.1444 0
3 0.0617 0.566
4 0.0491 0.818
5 0.0758 0.284
6 0.1244 0
7 0.1451 0
) (i
Ploss °
= loss
i loss i
P P x ()
i
L
μ
178
.
0
}
max{
, 1,41
=
D
=
D
=
OS
kij i
IF,
[
FLB(i,j)]
u
iμ
B
i sj i
i maxV V
branch 4, the load on bus 6 is removed from the feeder Fd1.On
simultaneously closing the Tie-switch 1 the load on bus 6 is transferred from feeder Fd1 to feeder Fd2 and hence energized by
the feeder Fd2. After transferring the load on bus6 to feeder Fd2 the
total real power loss of the distribution system is decreased to 88.440 kW from 99.0123 kW. The voltages of bus 3, bus 4, bus 5 and bus 6 come to the normal condition. The transmission line between bus 3 and bus 5 and transmission line between bus 5 & bus 6 operates normally. Hence there is overall decrease of power loss of 10.5723 kW. The procedure is continued with the second iteration. In the second iteration the tie-switch 1 which is considered in the first iteration is discarded. The voltage difference across different open Tie-switches are taken. The fuzzy
[image:6.595.40.288.277.385.2]membership functions
( )
μ
L
i ,( )
μ
V
i and( )
μ
B
i for the second iteration are obtained as done for the first iteration. Based on the results, an optimal solution is presented in table 5. The value of this optimal solution is significantly corresponds to a branch in the loop 2.Table 5: Optimal Solution
Branch no.
μ
V
iμ
L
iμ
B
iD
k,i1 0 0 0 0
2 0 0 0 0
3 0.1583 0.884 0.5708 0.1583
4 0 0.588 0 0
5 0 0.264 0 0
6 0.0266 0 0 0
The optimal solution for the second iteration is come as;
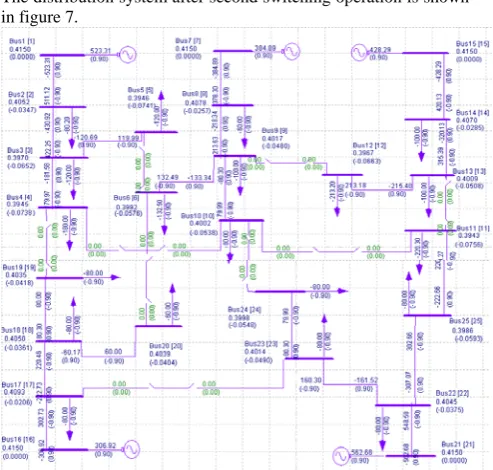
(20) The optimal solution corresponds to the D8, 3 for branch 3 when
tie-switch 8 is closed. By second iteration the branch 3 will be opened and tie-switch 8 will be closed. Hence after opening the branch 3, the load on bus 11 is removed from feeder Fd3.On
simultaneously closing the Tie-switch 8 the load on bus 11 is transferred from feeder Fd3 and hence energized by the feeder Fd5.
The distribution system after second switching operation is shown in figure 7.
Figure 7: Distribution System after Second Switching Operation
On analyzing the distribution system after second switching operation it is found that after transferring the load on bus 11 to feeder Fd5 the total real power loss of the distribution system has
decreased to 80.0530 kW from 88.440 kW. Consequently the voltages across the bus 11, bus 12 and bus 13 have also returned to their normal values and transmission line between bus 13 & bus 14 is operating normally. Hence there is overall decrease of power loss of 8.387 kW.
In the third iteration both the tie-switch considered earlier are discarded. On analyzing, it is found that the voltage difference across the tie switch 5(between bus 19 and bus 4) is highest. But the value of voltage difference across the tie-switch 5 is less than
ε
=0.03. Hence the tie-switch 5 is discarded and automatically all the other tie switches are also discarded. The procedure to solve the overload contingency in distribution system is completed here.The authors have tested few examples and it was found that a value of
ε
<0.03 give unsatisfactory results.A comparison is presented between conventional switching operation and fuzzy multiobjective. When the switching is performed by the fuzzy multiobjective approach all the bus voltages and current flow in the transmission lines found operating within their limits. The total real power reduced to 80.0530kW from the 99.0123kW. In conventional switching operation the end loads are transferred to subsequent feeders and changes are observed. It is observed that when load on bus 4 is transferred to feeder Fd4, there is voltage drop on the bus 4 and bus 19. The
transmission line between bus 19 and bus 18 and transmission line between bus 18 and bus 17 of feeder Fd4 get overloaded. When the
load on bus 12 is transferred from feeder Fd3 to feeder Fd2 there is
voltage drop across the bus 12 and bus 9. The transmission lines between bus 9 and bus 12 gets overloaded. Similarly when the end load on bus 6 is transferred from overloaded feeder Fd1 to the near
by feeder Fd2 there is voltage drop on bus 9 and bus 10. The
transmission line between bus 9 and bus 10 of feeder Fd2 also gets
overloaded. Hence a number of transmission lines are overloaded with subsequent voltage drop across the buses. The total real power loss is calculated by switching all the end loads from the overloaded feeders which came as 91.9129 kW. Another major comparison is done between the total real power loss reduction between fuzzy multiobjective approach and conventional switching method. We observed that the total real power loss reduction by the fuzzy multiobjective is less than the total real power loss reduction by the conventional switching. The difference between the total real power loss reduction by the fuzzy multiobjective and by the conventional switching is 11.8599 kW. Hence the switching done by the fuzzy multiobjective approach is better than the conventional switching method.
VI. CONCLUSION
In the proposed study a fuzzy multiobjective approach is presented to solve the overload contingency in a 25-bus distribution system considering customer load patterns. Load analysis is performed using Mi-Power software. Real power loss reduction,Maximum node voltage deviation and Feeder load balancing used in solving overload contingency have been calculated and presented. Three iterations are performed for different objectives and results are presented. It is shown that the number of tie-switch operations have been minimized using fuzzy multiobjective approach. A comparison of fuzzy multiobjective approach with conventional switching operation is also presented in this study. The results show that the total real power loss reduction by fuzzy multiobjective is better than the conventional switching operation. The simulation and the obtained results on a 25 bus distribution system network have proved the feasibility of the proposed approach encourages the implementation of the strategy on a large-size distribution network. The approach has also reduced
1583
.
0
}
max{
, 8,32
=
D
=
D
=
[image:6.595.45.292.494.729.2]power losses, enhance the voltage profile for customers, increase the reliability levels or restore the power supply in contingency situations.
In any distribution system, there are always some loads, which are of the highest priority (e.g., hospital, big industrial factory, etc.). In the event of overload contingency, the supply must be restored to highest priority customers first and this fact should be reflected in the final solution of the problem. Hence for the future work multiobjective approach can be applied to the distribution system having priority customers.
REFERENCES
1. Wu J.S., Tomsovic K.L., Chen C.S. (1991) ‘A Heuristic Search Approach to feeder switching operations for overload, faults, unbalanced flow and maintenance’ IEEE Trans. Power Syst., Vol. 6, No. 4pp. 1579-1585.
2. Adibi M.M., Kafka R.J., Milanicz D.P. (1994) ‘Expert system requirements for power system restoration’ IEEE Trans. Power Syst., Vol. 9, No. 3pp. 1592-1600.
3. V.V.K. Reddy, M. Sydulu (2007)‘A Heuristic-Expert based Approach for Reconfiguration of Distribution Systems’ IEEE Trans. Power Syst., Vol. 12, No. 1pp.236-240.
4. Taylor Tim, Lubkeman David (1990) ‘Implementation of heuristic search strategies for distribution feeder reconfiguration’ IEEE Trans. Power Deliv., Vol.5, No.1, pp.239-246.
5. Lin Whei-Min, Chin Hong-Chan (1998) ‘A new approach for distribution feeder reconfiguration for loss reduction and service restoration’ IEEE Trans. Power Deliv., Vol. 13, No. 3, pp. 870-875.
6. Y.L. Ke (2003) ‘Application of gcn approach for power distribution system contingency load transfer’ IEE Proc. Gener. Trans. Distrib. Vol. 150, No. 6 pp.717-721.
7. George J.Y. Hsu, Larry Yu-Renm Tzeng (1990) ‘A new algorithm of fuzzy multiobjective programming: The compromise factor approach’ IEEE Trans. Power Deliv., pp. 689-693.
8. Joon-Ho Choi, Jae-Chul Kim (2000) ‘Network Reconfiguration at the Power Distribution System with Dispersed Generations for Loss Reduction’ IEEE Trans. Power Syst., Vol. 12, No. 1pp.2363-2367.
9. Ying-Tung Hsiao (2007) ‘Multiobjective Evolution Programming Method for Feeder Reconfiguration’ IEEE Trans. Power Syst., Vol. 19, No. 1pp. 594-599.
10. Yogender Kumar, Biswarup Das (2008) ‘Multiobjective, Multiconstraint Service Restoration of Electric Power Distribution System with Priority Customers’ IEEE Trans. Power Syst., Vol. 23, No. 1pp. 261-270. . 11. Debapriya Das (2006)‘A Fuzzy Multiobjective Approach
for Network Reconfiguration of Distribution Systems’ IEEE Trans. Power Deliv., Vol. 21, No. 1, pp.202-208.
12. Chen, C.S., Huang, J.C., and Huang, C.W. ‘Determination of customer load characteristics by load survey system at Taipower’, IEEE Trans. Power Deliv., 1996, Vol. 11, No. 3, pp. 1430-1435.
APPENDIX -1
1. Real Power Loss Reduction:
Total numbers of branches in loop 1 Nk = 7.
Total real power loss of system before reconfiguration; i.e. Ploss0 = 99.0123 kW.
Total real power loss in system when branch 1 is open; i.e. Ploss(1)= 191.2042 kW.
Now, hence we get; X(1)= 1.9311. So on the basis of equation given we obtain
μ
L
1= 0.2. Maximum Node Voltage Deviation :
Total numbers of branches in loop 1 Nk = 7; Total numbers of
nodes in loop 1 NB = 8; Voltage of the substation Vs = 1.0 (per
unit).
Voltage of node j =1 to 8 corresponding to the opening of the 1 branch in the loop in per unit is; V1, 1 = 1.000 kW; V1, 2 = 0.8262
kW; V1, 3 = 0.8305 kW; V1, 4 = 0.8511 kW; V1, 5 = 0.8781 kW;
V1, 6 = 0.9119 kW; V1, 7 = 0.9545 kW; V1, 8 = 1.000 kW.
Now y1 = max | Vi, j - Vs |
So; y1 = max [ 0, 0.1738, 0.1695, 0.1489, 0.1219, 0.0881, 0.0403,
0]
y1 = 0.1738.
So on the basis of equation given we obtain = 0.
3. Feeder Load Balancing:
Total numbers of branches in loop 1 Nk = 7; Total number of
feeders in the loop1 = 2.
Current of feeder 1 corresponding to the opening of the 2 branch in the loop;
IF 2,1 = 124.421 A.
Current of feeder 2 corresponding to the opening of the 2 branch in the loop;
IF 2,2 = 1383.774 A.
Now; ( )
I j i I j i
IFF IF IFF
FLB ,
, = −
So, FLB2,1 = 0.91 A and FLB2,2 = 0 A.
Now,
Hence we get, ui = 0.91
On the basis of equation given we obtain
μ
B
2 = 0.,
) (°
=
loss i loss i
P
P
x
1 V
μ