Evaluating information content by factoid analysis: human
annotation and stability
Simone Teufel Computer Laboratory Cambridge University, UK
Hans van Halteren Language and Speech
University of Nijmegen, The Netherlands
Abstract
We present a new approach to intrinsic sum-mary evaluation, based on initial experiments in van Halteren and Teufel (2003), which com-bines two novel aspects: comparison of infor-mation content (rather than string similarity) in gold standard and system summary, mea-sured in shared atomic information units which we call factoids, and comparison to more than one gold standard summary (in our data: 20 and 50 summaries respectively). In this paper, we show that factoid annotation is highly re-producible, introduce a weighted factoid score, estimate how many summaries are required for stable system rankings, and show that the fac-toid scores cannot be sufficiently approximated by unigrams and the DUC information overlap measure.
1 Introduction
Many researchers in summarisation believe that the best way to evaluate a summary is extrin-sic evaluation (Sp¨arck Jones, 1999): to measure the quality of the summary on the basis of de-gree of success in executing a specific task with that summary. The summary evaluation per-formed in SUMMAC (Mani et al., 1999) fol-lowed that strategy. However, extrinsic eval-uations are time-consuming to set up and can thus not be used for the day-to-day evaluation needed during system development. So in prac-tice, a method for intrinsic evaluation is needed, where the properties of the summary itself are examined, independently of its application.
Intrinsic evaluation of summary quality is un-deniably hard, as there are two subtasks of sum-marisation which need to be evaluated, infor-mation selection and text production — in fact these two subtasks are often separated in evalu-ation (Mani, 2001). If we restrict our attention to information selection, systems are tested by way of comparison against a “gold standard”, a
manually produced result which is supposed to be the “correct”, “true” or “best” result.
In summarisation there appears to be no “one truth”, but rather various “good” results. Hu-man subjectivity in what counts as the most im-portant information is high. This is evidenced by low agreement on sentence selection tasks (Rath et al., 1961; Jing et al., 1998), and low word overlap measures in the task of creating summaries by reformulation in the summaris-ers’ own words (e.g. word overlap of the 542 single document summary pairs in DUC-02 av-eraged only 47%).
But even though the non-existence of any one gold standard is generally acknowledged in the summarisation community, actual practice nev-ertheless ignores this, mostly due to the expense of compiling summary gold standards and the lack of composite measures for comparison to more than one gold standard.
Other fields such as information retrieval (IR) also have to deal with human variability con-cerning the question of what “relevant to a query” means. This problem is circumvented by extensive sampling: many different queries are collected to level out the differences in query formulation and relevance judgements. Voorhees (2000) shows that the relative rank-ings of IR systems are stable across annota-tors even though relevance judgements differ significantly between humans. Similarly, in MT, the recent BLEU metric (Papineni et al., 2001) also uses the idea that one gold standard is not enough. Their ngram-based metric derived from four reference translations of 40 general news stories shows high correlation with human judgement.
sum-mary evaluation”. In this paper, we explore the differences and similarities between various hu-man summaries in order to create a basis for such an estimate and examine the degree of dif-ference between the use of a single summary gold standard and the use of a consensus gold standard for two sample texts, based on 20 and 50 summaries respectively.
The second aspect we examine is the similar-ity measure which compares system and gold standard summaries. In principle, the com-parison can be done via co-selection of ex-tracted sentences (Rath et al., 1961; Jing et al., 1998), by string-based surface measures (Lin and Hovy, 2002), or by subjective judgements of the amount of information overlap (DUC, 2002). String-based metrics are superior to sen-tence co-selection, as co-selection cannot take similar or even identical information into ac-count if it does not occur in the sentences which were chosen. The choice of information overlap judgements as the main metric in DUC reflects the intuition that human judgements of shared “meaning” of two texts should in principle be superior to surface-based similarity.
DUC assessors judge the informational over-lap between “model units” (elementary dis-course units (EDUs), i.e. clause-like units, taken from the gold standard summary) and “peer units” (sentences taken from the partici-pating summaries) on the basis of the question: “How much of the information in a model unit is contained in a peer unit: 100%, 80%, 60%, 40%, 20%, 0%?” Weighted recall measures report how much gold standard information is present in the summaries.
However, information overlap judgement is not something humans seem to be good at, ei-ther. Lin and Hovy (2002) show the instabil-ity of the evaluation, expressed in system rank-ings. They also examined those cases where annotators incidentially had to judge a given model–peer pair more than once (because differ-ent systems returned the same “peer” sdiffer-entence). In those cases, assessors agreed with their own prior judgement in only 82% of the cases.
We propose a novel gold standard comparison based on factoids. Identifying factoids in text is a more objective task than judging information overlap `a la DUC. Our annotation experiments show high human agreement on the factoid an-notation task. We believe this is due to the way how factoids are defined, and due to our pre-cise guidelines. The factoid measure also allows
quantification of the specific elements of infor-mation overlap, rather than just giving a quan-titative judgement expressed in percentages.
In an example from Lin and Hovy (2002), a DUC assessor judgedsome content overlap be-tween “Thousands of people are feared dead” and “3,000 and perhaps ... 5,000 people have been killed.” In our factoid representation, a distinction between “killed” and “feared dead” would be made, and different numbers of peo-ple mentioned would have been differentiated. Thus, the factoid approach can capture much finer shades of meaning differentiation than DUC-style information overlap does. Futher-more, it can provide feedback to system builders on the exact information their systems fail to include or include superfluously.
We describe factoid analysis in section 2, a method for comparison of the information con-tent of different summaries of the same texts, and describe our method for measuring agree-ment and present results in section 3. We then investigate the distribution of factoids across the summaries in our data sets in section 4, and define a weighted factoid score in section 5. In that section, we also perform stability ex-periments, to test whether rankings of system summaries remain stable if fewer than all sum-maries which we have available are used, and compare weighted factoid scores to other sum-mary evaluation metrics.
2 Data and factoid annotation
We use two texts: a 600-word BBC report on the killing of the Dutch politician Pim Fortuyn (as used in van Halteren and Teufel (2003)), which contains a mix of factual information and personal reactions, and a 573-word article on the Iraqi invasion of Kuwait (used in DUC-2002, LA080290-0233).
For these two texts, we collected human writ-ten generic summaries of roughly 100 words. Our guidelines asked the human subjects to fmulate the summary in their own words, in or-der to elicit different linguistic expressions for the same information. Knowledge about the variability of expression is important both for evaluation and system building.
The Fortuyn text was summarised by 40 Dutch students1, and 10 NLP researchers
(na-tive or near-na(na-tive English speakers), resulting in a total of 50 summaries. For the Kuwait text,
1Another 20 summaries of the same source were
we used the 6 DUC-provided summaries, 17 ELSNET-02 student participants (7 summaries removed), and summaries by 4 additional re-searchers, resulting in a total of 20 summaries.
We use atomic semantic units called factoids to represent the meaning of a sentence. For instance, we represent the sentence “The police
have arrested a white Dutch man” by the union of
the following factoids:
FP20 A suspect was arrested
FP21 The police did the arresting
FP24 The suspect is white
FP25 The suspect is Dutch
FP26 The suspect is male
Factoids are defined empirically based on the data in the set of summaries we work with. Fac-toid definition starts with the comparison of the information contained in two summaries, and gets refined (factoids get added or split) as in-crementally other summaries are considered. If two pieces of information occur together in all summaries – and within the same sentence – they are treated as one factoid, because dif-ferentiation into more than one factoid would not help us in distinguishing the summaries. In our data, there must have been at least one summary that contained either only FP25 or only FP26 – otherwise those factoids would have been combined into a single factoid “FP27 The suspect is a Dutch man”. Factoids are labelled with descriptions in natural language; initially, these are close in wording to the factoid’s oc-currence in the first summaries, though the an-notator tries to identify and treat equally para-phrases of the factoid information when they occur in other summaries.
Our definition of atomicity implies that the “amount” of information associated with one factoid can vary from a single word to an en-tire sentence. An example for a large chunk of information that occurred atomically in our texts was the fact that Fortuyn wanted to be-come PM (FV71), a factoid which covers an en-tire sentence. On the other hand, a single word may break down into more than one factoids.
If (together with various statements in other summaries) one summary contains “was killed” and another “was shot dead”, we identify the factoids
FA10 There was an attack
FA40 The victim died
FA20 A gun was used
The first summary contains only the first two factoids, whereas the second contains all three. That way, the semantic similarity between
re-lated sentences can be expressed.
When we identified factoids in our summary collections, most factoids turned out to be in-dependent of each other. But when dealing with naturally occuring documents many dif-ficult cases appear, e.g. ambiguous expressions, slight differences in numbers and meaning, and inference.
Another difficult phenomenon is attribution. In both source texts, quotations of the reactions of several politicians and officials are given, and the subjects often generalised these reactions and produced statements such as“Dutch as well as international politicians have expressed their grief
and disbelief.” Due to coordination of
speak-ers (in the subject) and coordination of retions (in the direct object), it is hard to ac-curately represent the attribution of opinions. We therefore introduce combinatorical factoids, such as “ OG40 Politicians expressed grief” and “OS62 International persons/organizations ex-pressed disbelief” which can be combined with similar factoids to express the above sentence.
We wrote guidelines (10 pages long) which describe how to derive factoids from texts. The guidelines cover questions such as: how to cre-ate generalising factoids when numerical val-ues vary (summaries might talk about “200”, “about 200” or “almost 200 Kuwaitis were killed”), how to create factoids dealing with at-tribution of opinion, and how to deal with coor-dination of NPs in subject position, cataphors and other syntactic constructions. We believe that written guidelines should contain all the rules by which this process is done; this is the only way that other annotators, who do not have access to all the discussions the original an-notators had, can replicate the annotation with a high agreement. We therefore consider the guidelines as one of the most valuable outcomes of this exercise, and we will make them and our annotated material generally available.
happening.
3 Agreement
In our previous work, a “definitive” list of fac-toids was given (created by one author), and we were interested in whether annotators could consistently mark the text with the factoids con-tained in this list. In the new annotation cycle reported on here, we study the process of factoid lists creation, which is more time-consuming. We will discuss agreement in factoid annotation first, as it is a more straightforward concept, even though procedurally, factoids are first de-fined (cf. section 3.2) and then annotated (cf. section 3.1).
3.1 Agreement of factoid annotation
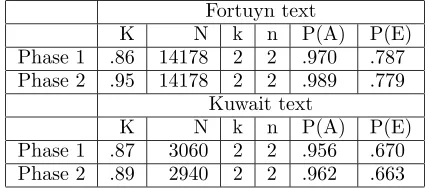
Assuming that we already have the right list of factoids available, factoid annotation of a 100 word summary takes roughly 10 minutes, and measuring agreement on the decision of assign-ing factoids to sentences is relatively straight-forward. We calculate agreement in terms of Kappa, where the set of items to be classified are all factoid–summary combinations (e.g. in the case of Phase 1, N=153 factoids times 20 sen-tences = 2920), and where there are two cate-gories, either ‘factoid is present in summary (1)’ or ‘factoid is not present in summary (0)’. P(E), probability of error, is calculated on the basis of the distribution of the categories, whereas P(A), probability of agreement, is calculated as the average of observed to possible pairwise agreements per item. Kappa is calculated as k = P(1A−)P−(PE()E); results for our two texts are given in Figure 1.
We measure agreement at two stages in the process: entirely independent annotation (Phase 1), and corrected annotation (Phase 2). In Phase 2, annotators see an automatically generated list of discrepancies with the other annotator, so that slips of attention can be cor-rected. Crucially, Phase 2 was conducted with-out any discussion. After Phase 2 measurement, discussion on the open points took place and a consensus was reached (which is used for the experiments in the rest of the paper).
Figure 1 includes results for the Fortuyn text as we have factoid–summary annotations by both annotators for both texts. The Kappa fig-ures indicate high agreement, even in Phase 1 (K=.87 and K=.86); in Phase 2, Kappas are as high as .89 and .95. Note that there is a dif-ference between the annotation of the Fortuyn
and the Kuwait text: in the Fortuyn case, there was no discussion or disclosure of any kind in Phase 1; one author created the factoids, and both used this list to annotate. The agreement of K=.86 was thus measured on entirely inde-pendent annotations, with no prior communica-tion whatsoever. In the case of the Kuwait text, the prior step of finding a consensus factoid list had already taken place, including some discus-sion.
Fortuyn text
K N k n P(A) P(E)
Phase 1 .86 14178 2 2 .970 .787
Phase 2 .95 14178 2 2 .989 .779
Kuwait text
K N k n P(A) P(E)
Phase 1 .87 3060 2 2 .956 .670
[image:4.595.320.534.206.301.2]Phase 2 .89 2940 2 2 .962 .663
Figure 1: Agreement of factoid annotation.
3.2 Agreement of factoid definition.
We realised during our previous work, where only one author created the factoids, that the task of defining factoids is a complicated pro-cess and that we should measure agreement on this task too (using the Kuwait text). Thus, we do not have this information for the Fortuyn text.
But how should the measurement of agree-ment on factoid creation proceed? It is diffi-cult to find a fair measure of agreement over set operations like factoid splitting, particularly as the sets can contain a different set of summaries marked for each factoid. For instance, consider the following two sentences: (1) M01-004 Sad-dam Hussein said ... that they will leave the country when the situation stabilizes. and (2) M06-004 Iraq claims it ... would withdraw soon. One annotator created a factoid “(P30) Sad-dam H/Iraq will leave the country soon/when situation stabilises” whereas the other anno-tator split this into two factoids (F9.21 and F9.22). Note that the annotators use their own, independently chosen factoid names.
A1 A2 A1 A2 P30←F9.21 – a 1 1 P30←F9.22 – a 1 0 P30←F9.21 – b 0 0 P30←F9.22 – b 0 0 P30←F9.21 – c 1 0 P30←F9.22 – c 1 1 P30←F9.21 – d 0 0 P30←F9.22 – d 0 0 P30←F9.21 – e 1 0 P30←F9.22 – e 1 1
Figure 2: Items for kappa calculation.
to suggest such identities and subsumption re-lations.
We then calculate Kappa at Phases 1 and 2. It is not trivial to define what an ’item’ in the Kappa calculation should be. Possibly the use of Krippendorff’s alpha will provide a better approach (cf. Nenkova and Passon-neau (2004)), but for now we measure using the better-known kappa, in the following way: For each equivalence between factoids A and C, create items { A – C – s|s ∈S} (where S is the set of all summaries). For each fac-toid A subsumed by a set B of facfac-toids, create items {A ← b – s|b∈ B, s∈ S}. For exam-ple, given 5 summaries a, b, c, d, e, Annotator A1 assigns P30 to summaries a, c and e. An-notator A2 (who has split P30 into F9.21 and F9.22), assigns a to F9.21 and c and e to F9.22. This creates the 10 items for Kappa calculation given in Figure 2.
Results for our data set are given in Figure 3. For Phase 1 of factoid definition, K=.7 indicates relatively good agreement (but lower than for the task of factoid annotation). Many of the disagreements can be reduced to slips of atten-tion, as the increased Kappa of .81 for Phase 2 shows.
Overall, we can observe that this high agree-ment for both tasks points to the fact that the task can be robustly performed in naturally oc-curring text, without any copy-editing. Still, from our observations, it seems that the task of factoid annotation is easier than the task of factoid definition.
Kuwait text
K N k n P(A) P(E)
Phase 1 .70 3560 2 2 .91 .69
Phase 2 .81 3240 2 2 .94 .67
Figure 3: Agreement of factoid definition.
One of us then used the Kuwait consensus agreement to annotate the 16 machine sum-maries for that text which were created by dif-ferent participants in DUC-2002, an annotation which could be done rather quickly. However, a
small number of missing factoids were detected, for instance the (incorrect) factoid that Saudi Arabia was invaded, that the invasion happened on a Monday night, and that Kuwait City is Kuwait’s only sizable town. Overall, the set of factoids available was considered adequate for the annotation of these new texts.
0 10 20 30 40 50
0
50
100
150
200
250
Number of summaries
[image:5.595.342.503.167.326.2]Average number of factoids
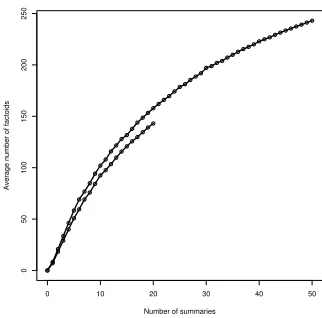
Figure 4: Average size of factoid inventory as a function of number of underlying summaries.
4 Growth of the factoid inventory The more summaries we include in the analy-sis, the more factoids we identify. This growth of the factoid set stems from two factors. Dif-ferent summarisers select difDif-ferent information and hence completely new factoids are intro-duced to account for information not yet seen in previous summaries. This factor also implies that the factoid inventory can never be complete as summarisers sometimes include information which is not actually in the original text. The second factor comes from splitting: when a new summary is examined, it often becomes neces-sary to split a single factoid into multiple fac-toids because only a certain part of it is included in the new summary. After the very first sum-mary, each factoid is a full sentence, and these are gradually subdivided.
In order to determine how many factoids exist in a given set of N summaries, we simulate ear-lier stages of the factoid set by automatically re– merging those factoids which never occur apart within the given set of summaries.
[image:5.595.85.288.613.661.2]are longer. Given the overall growth for the total number of factoids and the number of fac-toids per sentence, it would seem that the split-ting factors and the new information factor are equally productive.
Neither curve in Figure 4 shows signs that it might be approaching an assymptote. This con-firms our earlier conclusion (van Halteren and Teufel, 2003) that many more summaries than 10 or 20 are needed for a full factoid inventory.2
5 Weighted factoid scores and stability
The main reason to do factoid analysis is to measure the quality of summaries, including machine summaries. In our previous work, we do this with a consensus summary. We are now investigating different weighting factors for the importance of factoids. Previously, the weight-ing factors we suggested were information con-tent, position in the summaries and frequency. We investigated the latter two.
Each factoid we find in a summary to be eval-uated contributes to the score of the summary, by an amount which reflects the perceived value of the factoid, what we will call the “weighted factoid score (WFS)”. The main component in this value is frequency, i.e., the number of model summaries in which the factoid is observed.
When frequency weighting is used by itself, each factoid occurrence is worth one.3 We could
also assume that more important factoids are placed earlier in a summary, and that the fre-quency weight is adjusted on the basis of po-sition. Experimentation is not complete, but the adjustments appear to influence the rank-ing only slightly. The results we present here are those using pure frequency weights.
We noted in our earlier paper that a good quality measure should demonstrate at least the following properties: a) it should reward inclu-sion in a summary of the information deemed
2It should be noted that the estimation in Figure 4
improves upon the original estimation in that paper, as the determination of number of factoids for that figure did not consider the splitting factor, but just counted the number of factoids as taken from the inventory at its highest granularity.
3This is similar to the relative utility measure
intro-duced by Radev and Tam (2003), which however oper-ates on sentences rather than factoids. It also corre-sponds to the pyramid measure proposed by Nenkova and Passonneau (2004), which also considers an estima-tion of the maximum value reachable. Here, we use no such maximum estimation as our comparisons will all be relative.
1 3 5 7 9 12 15 18 21 24 27 30 33 36 39 42 45 48
−0.2
0.0
0.2
0.4
0.6
0.8
1.0
Number of summaries (N) that score is based on
[image:6.595.327.517.62.239.2]Ranking correlation between two samplings (allowing repeats) of N summaries
Figure 5: Correlation (Spearman’s ρ) between summary rankings on the basis of two different sets of N summaries, for N between 1 and 50.
most important in the document and b) mea-sures based on two factoid analyses constructed along the same lines should lead to the same, or at least very similar, ranking of a set of sum-maries which are evaluated. Since our measure rewards inclusion of factoids which are men-tioned often and early, demand a) ought to be satisfied by construction.
For demand b), some experimentation is in order. For various numbers of summaries N, we take two samples of N summaries from the whole set (allowing repeats so that we can use N larger than the number of available summaries; a statistical method called ‘bootstrap’). For each sample in a pair, we use the weighted fac-toid score with regard to that sample of N sum-maries to rank the sumsum-maries, and then deter-mine the ranking correlation (Spearman’sρ) be-tween the two rankings. The summaries that we rank here are the 20 human summaries of the Kuwait text, plus 16 machine summaries sub-mitted for DUC-2002.
Submitted summaries (Human | Machine)
Score based on 50 summaries, with frequency weighting
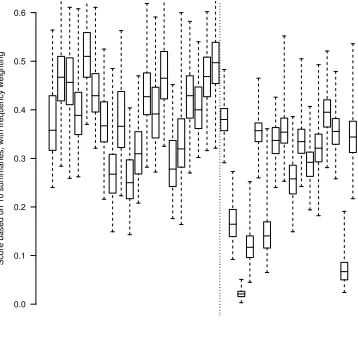
[image:7.595.75.256.66.241.2]0.0 0.1 0.2 0.3 0.4 0.5 0.6
Figure 6: Variation in summary scores in eval-uations based on 200 different sets of 50 model summaries.
Submitted summaries (Human | Machine)
Score based on 10 summaries, with frequency weighting
0.0 0.1 0.2 0.3 0.4 0.5 0.6
Figure 7: Variation in summary scores in eval-uations based on 200 different sets of 10 model summaries.
of the line). However, an examination of the better scoring machine summaries show that in this particular case, their information content is indeed good. The very low human scores ap-pear to be cases of especially short summaries (including one DUC summariser) and/or sum-maries with a deviating angle on the story.
It has been suggested in DUC circles that a lower N should suffice. That even a value as high as 10 is insufficient is already indicated by the ranking correlation of only 0.76. It becomes even clearer with Figure 7, which mirrors Figure 6 but uses N=10. The scores for the summaries vary wildly, which means that ranking is almost random.
Of course, the suggestion might be made that the system ranking will most likely also be sta-bilised by scoring summaries for more texts,
even with such a low (or even lower) N per text. However, in that case, the measure only yields information at the macro level: it merely gives an ordering between systems. A factoid-based measure with a high N also yields feedback on a micro level: it can show system builders which vital information they are missing and which superfluous information they are including. We expect this feedback only to be reliable at the same order of N at which single-text-based scor-ing starts to stabilise, i.e. around 20 to 30.
As the average ranking correlation between two weighted factoid score rankings based on 20 summaries is 0.91, we could assume that the ranking based on our full set of 20 differ-ent summaries should be an accurate ranking. If we compare it to the DUC information over-lap rankings for this text, we find that the indi-vidual rankings for D086, D108 and D110 have correlations with our ranking of 0.50, 0.64 and 0.79. When we average over the three, this goes up to 0.83.
In van Halteren and Teufel (2003), we com-pared a consensus summary based on the top-scoring factoids with unigram scores. For the 50 Fortuyn summaries, we calculate the F-measure for the included factoids with regard to the con-sensus summary. In a similar fashion, we build a consensus unigram list, containing the 103 unigrams that occur in at least 11 summaries, and calculate the F-measure for unigrams. The correlation between those two scores was low (Spearman’s ρ = 0.45). We concluded from this experiment that unigrams, though much cheaper, are not a viable substitute for factoids.
6 Discussion and future work
We have presented a new information-based summarization metric called weighted factoid score, which uses multiple summaries as gold standard and which measures information over-lap, not string overlap. It can be reliably and objectively annotated in arbitrary text, which is shown by our high values for human agreement. We summarise our results as follows: Factoids can be defined with high agreement by indepen-dently operating annotators in naturally occur-ring text (K=.70) and independently annotated with even higher agreement (K=.86 and .87). Therefore, we consider the definition of factoids intuitive and reproducible.
[image:7.595.75.254.306.480.2]lo-cation in the summary allows for a stable sum-mary metric. We expect this can be improved further by including an information content weighting factor.
If single summaries are used as gold standard (as many other summarization evaluations do), the correlation between rankings based on two such gold standard summaries can be expected to be low; in our two experiments, the correla-tions wereρ=0.20 and 0.48 on average. Accord-ing to our estimations, stability with respect to the factoid scores can only be expected if a larger number of summaries are collected (in the range of 20–30 summaries).
System rankings based on the factoid score shows only low correlation with rankings based on a) DUC-based information overlap, and b) unigrams, a measurement based on shared words between gold standard summaries and system summary. As far as b) is concerned, this is expected, as factoid comparison abstracts over wording and captures linguistic variation of the same meaning. However, the ROUGE measure currently in development is considering various n-grams and Wordnet-based paraphras-ing options (Lin, personal communication). We expect that this measure has the potential for better ranking correlation with factoid ranking, and we are currently investigating this.
We also plan to expand our data sets to more texts, in order to investigate the presence and distribution of factoids, types of factoids and re-lations between factoids in summaries and sum-mary collections. Currently, we have two large factoid-annotated data sets with 20 and 50 sum-maries, and a workable procedure to annotate factoids, including guidelines which were used to achieve good agreement. We now plan to elicit the help of new annotators to increase our data pool.
Another pressing line of investigation is re-ducing the cost of factoid analysis. The first rea-son why this analysis is currently expensive is the need for large summary bases for consensus summaries. Possibly this can be circumvented by using larger numbers of different texts, as is the case in IR and in MT, where discrepancies prove to average out when large enough datasets are used. The second reason is the need for human annotation of factoids. Although sim-ple word-based methods prove insufficient, we expect that existing and emerging NLP tech-niques based on deeper processing might help with automatic factoid identification.
All in all, the use of factoid analysis and weighted factoid score, even though initially ex-pensive to set up, provides a promising alterna-tive which could well bring us closer to a solu-tion to several problems in summarisasolu-tion eval-uation.
References
DUC. 2002. Document Understanding
Con-ference (DUC). Electronic proceedings,
http://www-nlpir.nist.gov/projects/duc/ pubs.html.
Jing, H., R. Barzilay, K. R. McKeown, and M. El-hadad. 1998. Summarization Evaluation
Meth-ods: Experiments and Analysis. InWorking Notes
of the AAAI Spring Symposium on Intelligent Text Summarization, 60–68.
Lin, C., and E. Hovy. 2002. Manual and automatic evaluation of summaries. In DUC 2002.
Mani, I. 2001.Automatic Summarization. John
Ben-jamins.
Mani, I., T. Firmin, D. House, G. Klein, B. Sund-heim, and L. Hirschman. 1999. The TIPSTER
Summac Text Summarization Evaluation. In
Pro-ceedings of EACL-99, 77–85.
Nenkova, A., and R. Passonneau. 2004. Evaluating Content Selection in Summarization: the
Pyra-mid Method. In Proceedings of
NAACL/HLT-2003.
Papineni, K, S. Roukos, T Ward, and W-J. Zhu. 2001. Bleu: a method for automatic evaluation of
machine translation. In Proceedings of ACL-02,
311–318.
Radev, D., and D. Tam. 2003. Summarization
eval-uation using relative utility. InProceedings of the
Twelfth International Conference on Information and Knowledge Management, 508–511.
Rath, G.J, A. Resnick, and T. R. Savage. 1961. The Formation of Abstracts by the Selection of
Sen-tences.American Documentation12(2): 139–143.
Sp¨arck Jones, K. 1999. Automatic Summarising: Factors and Directions. In I. Mani and M.
May-bury, eds., Advances in Automatic Text
Summa-rization, 1–12. Cambridge, MA: MIT Press.
van Halteren, H., and S. Teufel. 2003. Examining the consensus between human summaries: initial
experiments with factoid analysis. InProceedings
of the HLT workshop on Automatic Summariza-tion.
Voorhees, E. 2000. Variations in relevance judge-ments and the measurement of retrieval
effective-ness. Information Processing and Management