Interactive Exploration of Asynchronous Conversations: Applying a
User-centered Approach to Design a Visual Text Analytic System
Enamul Hoque, Giuseppe Carenini {enamul,carenini}@cs.ubc.ca
Department of Computer Science University of British Columbia
Vancouver, Canada
Shafiq Joty [email protected]
Qatar Computing Research Institute Qatar Foundation
Doha, Qatar
Abstract
Exploring an online conversation can be very difficult for a user, especially when it becomes a long complex thread. We fol-low a human-centered design approach to tightly integrate text mining methods with interactive visualization techniques to sup-port the users in fulfilling their informa-tion needs. The resulting visual text ana-lytic system provides multifaceted explo-ration of asynchronous conversations. We discuss a number of open challenges and possible directions for further improve-ment including the integration of interac-tive human feedback in the text mining loop, applying more advanced text analy-sis methods with visualization techniques, and evaluating the system with real users. 1 Introduction
With the rapid adoption of Web-based social me-dia, asynchronous online conversations are be-coming extremely common for supporting com-munication and collaboration. An asynchronous conversation such as a blog may start with a news article or an editorial opinion, and later generate a long and complex thread as comments are added by the participants (Carenini et al., 2011). Con-sider a scenario, where a reader opens a blog con-versation about Obama’s healthcare policy. The reader wants to know why people are supporting or opposing ObamaCare. However, since some related discussion topics likestudent loanandjob recession are introduced, the reader finds it hard to keep track of the comments aboutObamaCare, which end up being buried in the long discussion. This may lead to an information overload problem, where the reader gets overwhelmed, starts to skip comments, and eventually leaves the conversation without satisfying her information needs (Jones et al., 2004).
How can we support the user in performing this and similar information seeking tasks? Arguably, supporting this task requires tight integration be-tween Natural Language Processing (NLP) and in-formation visualization (InfoVis) techniques, but what specific text analysis methods should be ap-plied? What metadata of the conversation could be useful to the user? How this data should be visual-ized to the user? And even more importantly, how NLP and InfoVis techniques should be effectively integrated? Our hypothesis is that to answer these questions effectively, we need to apply human-centered design methodologies originally devised for generic InfoVis (e.g., (Munzner, 2009; Sedl-mair et al., 2012)). Starting from an analysis of user behaviours and needs in the target conversa-tional domain, such methods help uncover useful task and data abstractions that can guide system design. On the one hand, task and data abstrac-tions can characterize the type of information that needs to be extracted from the conversation; on the other hand, they can inform the design of the vi-sual encodings and interaction techniques. More tellingly, as both the NLP and the InfoVis compo-nents of the resulting system refer to a common set of task and data abstractions, they are more likely to be consistent and synergistic.
We have explored this hypothesis in developing ConVis, a visual analytic system to support the in-teractive analysis of blog conversations. In the first part of the paper, we describe the development of ConVis, from characterizing the domain of blogs, its users, tasks and data, to designing and imple-menting specific NLP and InfoVis techniques in-formed by our user-centered design. In the second part of the paper, starting from an informal evalu-ation of Convis and a comprehensive literature re-view, we discuss several ideas on how ConVis (and similar systems) could be further improved and tested. These include the integration of interac-tive human feedback in the text mining techniques
(which are based on Machine Learning), the cou-pling of even more advanced NLP methods with the InfoVis techniques, and the challenges in run-ning evaluations of ConVis and similar interfaces.
2 Related Work
While in the last decade, NLP and InfoVis meth-ods have been investigated to support the user in making sense of conversational data, most of this work has been limited in several ways.
For example, earlier works on visualizing asynchronous conversations primarily investigated how to reveal the thread structure of a conversation using tree visualization techniques, such as using a mixed-model visualization to show both chrono-logical sequence and reply relationships (Venolia and Neustaedter, 2003), thumbnail metaphor using a sequence of rectangles (Wattenberg and Millen, 2003; Kerr, 2003), and radial tree layout (Pascual-Cid and Kaltenbrunner, 2009). However, such vi-sualizations did not focus on analysing the actual content (i.e., the text) of the conversations, which is something that according to our user-centred de-sign users are very interested in.
On the other hand, text mining approaches that perform content analysis of the conversations, such as finding primary themes (or topics) within conversations (Sack, 2000; Dave et al., 2004), or visualizing the content evolution over time (Wei et al., 2010; Vi´egas et al., 2006), often did not derive their visual encodings and interactive techniques from task and data abstractions based on a detailed analysis of specific user needs and requirements in the target domains.
Furthermore, more on the technical side, the text analysis methods employed by these ap-proaches are not designed to exploit the spe-cific characteristics of asynchronous conversations (e.g., use of quotation). Recently, (Joty et al., 2013b) has shown that topic segmentation and la-beling models are more accurate when these spe-cific characteristics are taken into account. The methods presented in (Joty et al., 2013b) are adopted in ConVis.
In general, to the best of our knowledge, no previous work has applied user-centred design to tightly integrate text mining methods with interac-tive visualization in the domain of asynchronous conversations.
3 Domains and User Activities
Conversational domains: The phenomenal adop-tion of novel Web-based social media has lead to the rise of textual conversations in many different modalities. While email remains a fundamental way of communicating for most people, other con-versational modalities such as blogs, microblogs (e.g., Twitter) and discussion fora have quickly be-come widely popular. Since the nature of data and tasks may vary significantly from one domain to the other, rather than trying to build an one-size-fit-all interface, we follow a design methodology that is driven by modeling the tasks and usage characteristics in a specific domain.
In this work, we focus on blogs, where people can express their thoughts and engage in online discussions. Due to the large number of comments with complex thread structure (Joty et al., 2013b), mining and visualizing blog conversations can be-come a challenging problem. However, the visual-ization can be effective for other threaded discus-sions (e.g., news stories, Youtube comments).
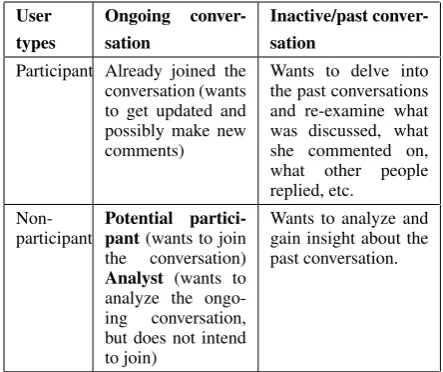
Users: As shown in Table 1, blog users can be categorized into two groups based on their activ-ities: (a)participants who already contributed to the conversations, and (b) non-participants who wish to join the conversations or analyze the con-versations. Depending on different user groups the tasks might vary as well, something that needs to be taken into account in the design process.
For example, imagine a participant who has ex-pressed her opinion about a major political issue. After some time, she may become interested to know what comments were made supporting or opposing her opinion, and whether those com-ments require a reply right away. On the contrary, a non-participant, who is interested in joining the ongoing conversation on that particular political issue, may want to decide whether and how she should contribute by quickly skimming through a long thread of blog comments. Another group of users may include the analysts, a policy maker for instance, who does not wish to join the conversa-tion, but may want to make an informed decision based on a summary of arguments used to support or oppose the political issue.
User types
Ongoing conver-sation
Inactive/past conver-sation
Participant Already joined the conversation (wants to get updated and possibly make new comments)
Wants to delve into the past conversations and re-examine what was discussed, what she commented on, what other people replied, etc.
Non-participant Potential partici-pant(wants to join the conversation)
Analyst (wants to analyze the ongo-ing conversation, but does not intend to join)
Wants to analyze and gain insight about the past conversation.
Table 1: User categorization for asynchronous conversation.
the non-participant’s activity on an inactive con-versation (as opposed to an ongoing concon-versation). 4 Designing ConVis: From Tasks to NLP
and InfoVis Techniques
We now briefly describe our design approach for integrating text mining techniques with interactive visualization in ConVis. We first characterize the domain of blogs and perform the data and tasks abstraction according to the nested model of de-sign study (Munzner, 2009). We then mine the data as appeared to be essential from that data and task analysis, followed by iteratively refining the design of ConVis that aims to effectively support the identified blog reading tasks (A more detailed analysis of the task abstractions and visual design is provided in (Hoque and Carenini, 2014)).
4.1 Tasks
To understand the blog reading tasks, we re-viewed the literature focusing on why and how people read blogs. From the analysis, we found that the primary goals of reading blogs in-clude information seeking, fact checking, guid-ance/opinion seeking, and political surveillance (Kaye, 2005). People may also read blogs to con-nect to their communities of interest (Dave et al., 2004; Mishne, 2006), or just for fun/ enjoyment (Baumer et al., 2008; Kaye, 2005).
Some studies have also revealed interesting be-havioural patterns of blog readers. For example, people often look for variety of opinions and have tendencies to switch from one topic to another quickly (Singh et al., 2010; Munson and Resnick,
2010). In addition, they often exhibit exploratory behaviour, i.e., they quickly skim through a few posts about a topic before delving deeper into its details (Zinman, 2011). Therefore, the interface should facilitate open-ended exploration, by pro-viding navigational cues that help the user to seek interesting comments.
From the analyses of primary goals of blog reading, we compile a list of tasks and the asso-ciated data variables that one would wish to visu-alize for these tasks. These tasks can be framed as a set of questions, for instance, ‘what do peo-ple say about topic X?’, ‘how other peopeo-ple’s view-points differ from my current viewpoint on topic X?’, ‘what are some interesting/funny comments to read?’ We then identify the primary data vari-ables involved in these tasks and their abstract types. For instance, most of these questions in-volve topics discussed and sentiments expressed in the conversation. Note that some questions may additionally require to know people-centric infor-mation and relate such inforinfor-mation to the visual-ization design. We also identify a set of meta-data to be useful cues for navigating a conversa-tion (the posiconversa-tion of the comments, thread struc-ture, and comment length) (Narayan and Cheshire, 2010; Baumer et al., 2008). We choose to encode theposition of the comments(ordinal) as opposed to theirtimestamps(quantitative); since the exact timestamp of a comment is less important to users than its chronological position with respect to the other comments (Baumer et al., 2008).
4.2 Text Analysis
Since most of the blog reading tasks we identi-fied involved topics and sentiments expressed in the conversation, we applied both topic modeling and sentiment analysis on a given conversation.
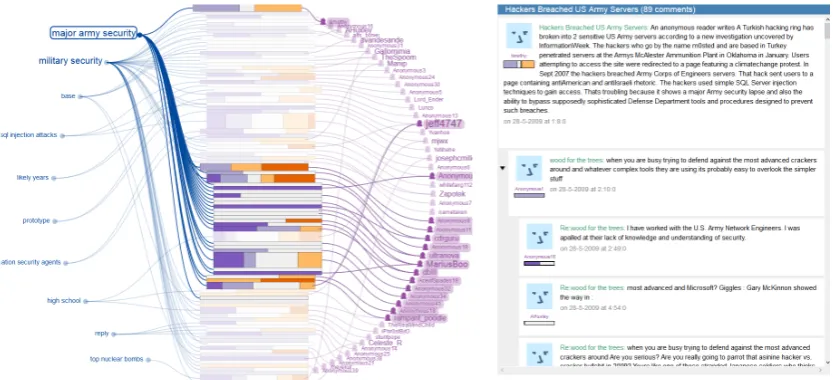
[image:3.595.70.292.62.248.2]Figure 1: A snapshot of ConVis showing a blog conversation from Slashdot, where the user has hovered the mouse over a topic element (‘major army security’) that highlights the connecting visual links, brush-ing the relatedauthors(right), and providing visual prominence to the related comments in the Thread Overview (middle).
to consider a fine-grain conversational structure of the conversation, i.e., the Fragment Quotation Graph (FQG) (Carenini et al., 2007). The FQG captures the reply relations between text frag-ments, which are extracted by analyzing the actual body of the comments, thus provides a finer rep-resentation of the conversation than the reply-to structure. Similarly, the topic labels are found by using their best unsupervised graph-based rank-ing model (i.e., BiasedCorank) that extracts rep-resentative keyphrases for each topical segment by combining informative clues from initial sen-tences of the segment and the fine-grain conversa-tional structure, i.e., the FQG.
For sentiment analysis, we apply the Seman-tic Orientation CALculator (SO-CAL) (Taboada et al., 2011), which is a lexicon-based approach (i.e., unsupervised) for determining sentiment of a text. Its performance is consistent across vari-ous domains and on completely unseen data, thus making a suitable tool for our purpose. We define five different polarity intervals (-2to +2), and for each comment we count how many sentences fall in any of these polarity intervals to compute the polarity distribution for that comment.
While designing and implementing ConVis, we have been mainly working with blog conversations from two different sources: Slashdot1— a
technol-ogy related blog site, and Daily Kos2— a political
analysis blog site. 1http://slashdot.org 2http://www.dailykos.com
4.3 Designing Interactive Visualization
Upon identifying the tasks and data variables, we design the visual encoding and user interactions. Figure 1 shows an initial prototype of ConVis. 3
It is designed as an overview + details interface, since it has been found to be more effective for text comprehension tasks than other approaches such as zooming and focus+context (Cockburn et al., 2008). The overview consists of what was dis-cussed by whom (i.e., topics and authors) and a visual summary of the whole conversation (i.e., the Thread Overview), while the detailed view represents the actual conversation. The Thread Overview visually represents each comment of the discussion as a horizontal stacked bar, where each stacked bar encodes three different meta-data (comment length, position of the comment in the thread, and depth of the comment within the thread). To express the sentiment distribution within a comment, the number of sentences that belong to a particular sentiment orientation is in-dicated by the width of each cell within a stacked bar. A set of five diverging colors was used to vi-sualize this distribution in a perceptually meaning-ful order, ranging from purple (highly negative) to orange (highly positive). Thus, the distribution of colors in the Thread Overview can help the user to perceive the kind of conversation they are going to deal with. For example, if the Thread Overview is
3
mostly in strong purple color, then the conversa-tion has many negative comments.
The primary facets of the conversations, namely topics and authors are presented in a circular layout around the Thread Overview. Both top-ics and authors are positioned according to their chronological order in the conversation starting from the top, allowing the user to understand how the conversation evolves as the discussion pro-gresses. The font size of facet items helps the user to quickly identify what are the mostly dis-cussed themes and who are the most dominant participants within a conversation. Finally, the facet elements are connected to their correspond-ing comments in the Thread Overview via subtle curved links indicating topic-comment-author re-lationships. While a common way to relate various elements in multiple views is synchronized visual highlighting, we choose visual links to connect related entities. This was motivated by the find-ings that users can locate visually linked elements in complex visualizations more quickly and with greater subjective satisfaction than plain highlight-ing (Steinberger et al., 2011). Finally, the Conver-sation View displays the actual text of the com-ments in the discussion as a scrollable list. At the left side of each comment, the following meta-data are presented: title, author name, photo, and a stacked bar representing the sentiment distribution (mirrored from Thread Overview).
Exploring Conversations: ConVis sup-ports multi-faceted exploration of conversations through a set of lightweight interactions (Lam, 2008) that can be easily triggered without causing drastic modifications to the visual encoding. The user can explore interesting topics/ authors by hovering the mouse on them, which highlights the connecting curved links and related comments in the Thread Overview (see Figure 1). As such, one can quickly understand how multiple facet elements are related, which is useful for the tasks that require the user to interpret the relationships between facets. If the reader becomes further interested in specific topic/ author, she can subsequently click on it, resulting in drawing a thick vertical outline next to the corresponding comments in the Thread Overview. Such outlines are also mirrored in the Conversation View. Moreover, the user can select multiple facet items (for instance a topic and an author) to quickly understand who said about what topics.
Besides exploring by the topics/ authors, the reader can browse individual comments by hover-ing and clickhover-ing on them in the Thread Overview, that causes to highlight its topic and scrolling to the relevant comment in the Conversation View. Thus, the user can easily locate the comments that belong to a particular topic and/or author. More-over, the keyphrases of the relevant topic and sen-timents are highlighted in the Conversation View upon selection, providing more details on demand about what makes a particular comment positive/ negative or how it is related to a particular topic.
5 Further Challenges and Directions After implementing the prototype, we ran an infor-mal evaluation (Lam et al., 2012) with five target users (age range 18 to 24, 2 female) to evaluate the higher levels of the nested model (Munzner, 2009), where the aim was to collect anecdotal ev-idence that the system met its design goals. The participants’ feedback from our evaluation sug-gests that ConVis can help the user to identify the topics and opinions expressed in the conver-sation; supporting the user in exploring comments of interest, even if they are buried near the end of the thread. We also identified further challenges from the observations and participants feedback. Based on our experience and literature review, we provide potential directions to address these chal-lenges as we describe below.
5.1 Human in the Loop: Interactive Topic Revision
on user feedback to better support her analysis tasks. Thus, our goal is to support a human-in-the-loop topic modeling for asynchronous conver-sations via interactive visualization.
There have been some recent works for incorpo-rating user supervision in probabilistic topic mod-els (e.g., Latent Dirichlet Allocation (LDA)) by adding constraints in the form of must-link and cannot-link (Andrzejewski et al., 2009; Hu et al., 2011), or in the form of a one-to-one mapping be-tween LDA’s latent topics and user tags (Ramage et al., 2009). The feedback from users has been also integrated through visualizations, that steers a semi-supervised topic model (Choo et al., 2013).
In contrast to the above-mentioned methods that are designed for generic documents, we are fo-cusing on how our topic modeling approach that is specific to asynchronous conversations, can be steered by the end-users. We are planning to com-bine a visual interface for expressing the user’s in-tention via a set of actions, and a semi-supervised version of the topic model that can be iteratively refined from such user actions.
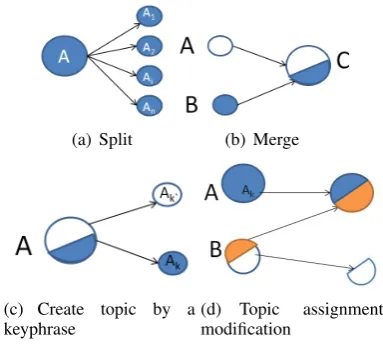
A set of possible topic revision operations are shown in Figure 2. Splitting a topic into further sub-topics can be useful when the user wants to explore the conversation at a finer-topic granular-ity (Figure 2(a)). A merging operation serves the opposite purpose, i.e., when the user wants to ana-lyze the conversation at a coarser topic granularity (Figure 2(b)). Together, these two operations are intended to help the user in dynamically changing the granularity levels of different topics.
Since each topic is currently represented by a set of keyphrases, they can also be effectively used to revise the topic model. Consider an ex-ample, where the sentences related to two dif-ferent keyphrases, namely ‘Obama health policy’ and ‘job recession’ are grouped together under the same topic. The user may realize that the sen-tences related to ‘job recession’ should have been separated from its original topic into a new one (Figure 2(c)). Finally, topic assignment modifi-cation can be performed, when the domain ex-pert believes that a group of sentences are wrongly grouped/clustered (Figure 2(d)) by the system.
In order to design the interactive visualization and algorithms for incorporating user feedback, a number of open questions need to be answered. Some of these questions are related to the user re-quirement analysis of the problem domain, e.g.,
(a) Split (b) Merge
(c) Create topic by a
[image:6.595.318.510.63.235.2]keyphrase (d) Topicmodification assignment Figure 2: Four different possible user actions for topic revision
what are the tasks for exploring asynchronous con-versation that require the introduction of user feed-back to refine the topic model? What data should be shown to the user to help her decide what topic refinement actions are appropriate?
In terms of designing the set of interaction tech-niques, the aim is to define a minimum set of model refinement operations, and allowing the user to express these operations from the visual interface in a way that enhances the ability to pro-vide feedback. A domain expert could possibly express these operations through the direct manip-ulation method (e.g., dragging a topic node over another). A related open question is: how can we minimize the cognitive load associated with inter-preting the modeling results and deciding the next round of topic revision operations?
From the algorithmic perspective, the most cru-cial challenge seems to be devising an efficient semi-supervised method in the current graph-based topic segmentation and labeling framework (Joty et al., 2013b). It needs to be fast enough to respond to the user refinement actions and update results in an acceptable period of time. In addition, determining the number of topics is a challenging problem when running the initial model and when splitting a topic further.
5.2 Coupling Advanced NLP Methods with Interactive Visualizations
not find the current sentiment analysis sufficient enough in revealing whether a comment is sup-porting/ opposing a preceding one. It seems that opinion seeking tasks (e.g., ‘why people were sup-porting or opposing an opinion?’) would require the reader to know the argumentation flow within the conversation, namely the rhetorical structure of each comment (Joty et al., 2013a) and how these structures are linked to each other.
An early work (Yee and Hearst, 2005) at-tempted to organize the comments using a tree-map like layout, where the parent comment is placed on top as a text block and the space below the parent node is divided between supporting and opposing statements. We plan to follow this idea in ConVis, but incorporating a higher level dis-course relation analysis of the conversations and detecting controversial topics.
Incorporating additional complex text analysis results into the visualization may require us to re-visit some of the higher levels of the nested model, i.e., data abstraction and visual encoding. It may impose further tradeoffs for visual encoding; for instance how can we visually represent the argu-mentation structure within a conversation? How can we represent such structure, while preserv-ing the data already found to be useful such as topic and thread structure? How can we represent that a topic is controversial? Besides text analysis results, some additional facets can become more useful to the participants (e.g., moderation scores, named entities), while an existing facet being less useful. In such cases, allowing the user to dynam-ically change the facets of interest can be useful.
5.3 Evaluation in the Wild
While controlled experiments allow us to mea-sure the user performance on specific tasks for the given interface, they may not accurately capture real world uses scenario (Lam et al., 2012). In this context, an ecologically valid evaluation of Con-Vis would be to allow the users to use the system to read their own conversations of interest over an extended period of time. Such longitudinal study would provide valuable insights regarding the util-ity of the interface.
Evaluating the topic refinement approach for asynchronous conversation can be even more chal-lenging. An initial approach could be to formu-late some quantitative evaluation metrics, that help us understand whether the iterative feedback from
the user would improve the resultant topic model in terms of agreement with the reference set of topics described by human annotators. However, such approach would not capture the subjective differences of the users in interpreting the topic model. It would be more interesting to see, how much users would actually care about providing the feedback to refine the model in a real world scenario? What refinement operations would be performed more often? Would these operations eventually support the user to perform some anal-ysis tasks more effectively?
6 Conclusions
Understanding the user behaviours, needs, and re-quirements in the target domain is critical in ef-fectively combining NLP and InfoVis techniques. In this paper, we apply a visualization design method (Munzner, 2009) to identify what infor-mation should be mined from the conversation as well as how the visual encoding and interaction techniques should be designed. We claim that the NLP and the InfoVis components of the resulting system, ConVis, are more consistent and better in-tegrated, because they refer to a common set of task and data abstractions. In future work, we aim to explore a set of open challenges that were moti-vated by an initial informal evaluation of ConVis.
References
David Andrzejewski, Xiaojin Zhu, and Mark Craven. 2009. Incorporating domain knowledge into topic modeling via dirichlet forest priors. InProc. Conf. on Machine Learning, pages 25–32.
Eric Baumer, Mark Sueyoshi, and Bill Tomlinson. 2008. Exploring the role of the reader in the activity of blogging. InProc. of CHI, pages 1111–1120. G. Carenini, R. T. Ng, and X. Zhou. 2007.
Summariz-ing Email Conversations with Clue Words. InProc. conf. on World Wide Web, pages 91–100.
Giuseppe Carenini, Gabriel Murray, and Raymond Ng. 2011. Methods for Mining and Summarizing Text Conversations. Morgan Claypool.
Jaegul Choo, Changhyun Lee, Chandan K Reddy, and Haesun Park. 2013. Utopian: User-driven topic modeling based on interactive nonnegative matrix factorization. IEEE Trans. Visualization & Comp. Graphics, 19(12):1992–2001.
Jason Chuang, Sonal Gupta, Christopher Manning, and Jeffrey Heer. 2013. Topic model diagnostics: As-sessing domain relevance via topical alignment. In
Andy Cockburn, Amy Karlson, and Benjamin B Bed-erson. 2008. A review of overview+ detail, zoom-ing, and focus+ context interfaces.ACM Computing Surveys (CSUR), 41(1):2.
Kushal Dave, Martin Wattenberg, and Michael Muller. 2004. Flash forums and forumreader: navigating a new kind of large-scale online discussion. InProc. ACM Conf. on CSCW, pages 232–241.
Michel Galley, Kathleen McKeown, Eric Fosler-Lussier, and Hongyan Jing. 2003. Discourse seg-mentation of multi-party conversation. InProc. of ACL, pages 562–569.
Enamul Hoque and Giuseppe Carenini. 2014. ConVis: A visual text analytic system for exploring blog con-versations. (Computer Graphic Forum (to appear)). Yuening Hu, Jordan Boyd-Graber, and Brianna Sati-noff. 2011. Interactive topic modeling. InProc. of ACL.
Quentin Jones, Gilad Ravid, and Sheizaf Rafaeli. 2004. Information overload and the message dynamics of online interaction spaces: A theoretical model and empirical exploration. Information Systems Re-search, 15(2):194–210.
Shafiq Joty, Giuseppe Carenini, Raymond Ng, and Yashar Mehdad. 2013a. Combining intra-and multi-sentential rhetorical parsing for document-level discourse analysis. InProc. of ACL.
Shafiq Joty, Giuseppe Carenini, and Raymond T Ng. 2013b. Topic segmentation and labeling in asyn-chronous conversations. Journal of Artificial Intelli-gence Research, 47:521–573.
B. K. Kaye. 2005. Web side story: An exploratory study of why weblog users say they use weblogs. AEJMC Annual Conf.
Bernard Kerr. 2003. Thread arcs: An email thread visualization. In IEEE Symposium on Information Visualization, pages 211–218.
H. Lam, E. Bertini, P. Isenberg, C. Plaisant, and S. Carpendale. 2012. Empirical studies in infor-mation visualization: Seven scenarios. IEEE Trans. Visualization & Comp. Graphics, 18(9):1520–1536. Heidi Lam. 2008. A framework of interaction costs in information visualization. IEEE Trans. Visualiza-tion & Comp. Graphics, 14(6):1149–1156.
Gilad Mishne. 2006. Information access challenges in the blogspace. InWorkshop on Intelligent Informa-tion Access (IIIA).
Sean A Munson and Paul Resnick. 2010. Presenting diverse political opinions: how and how much. In
Proc. of CHI, pages 1457–1466.
Tamara Munzner. 2009. A nested model for visualiza-tion design and validavisualiza-tion. IEEE Trans. Visualiza-tion & Comp. Graphics, 15(6):921–928.
S. Narayan and C. Cheshire. 2010. Not too long to read: The tldr interface for exploring and navigating large-scale discussion spaces. In Hawaii Conf. on System Sciences (HICSS), pages 1–10.
Vıctor Pascual-Cid and Andreas Kaltenbrunner. 2009. Exploring asynchronous online discussions through hierarchical visualisation. InIEEE Conf. on Infor-mation Visualization, pages 191–196.
Daniel Ramage, David Hall, Ramesh Nallapati, and Christopher D Manning. 2009. Labeled LDA: A su-pervised topic model for credit attribution in multi-labeled corpora. In Proc. of EMNLP, pages 248– 256.
Warren Sack. 2000. Conversation map: an interface for very-large-scale conversations. Journal of Man-agement Information Systems, 17(3):73–92. Michael Sedlmair, Miriah Meyer, and Tamara
Mun-zner. 2012. Design study methodology: reflections from the trenches and the stacks. IEEE Trans. Visu-alization & Comp. Graphics, 18(12):2431–2440. Param Vir Singh, Nachiketa Sahoo, and Tridas
Mukhopadhyay. 2010. Seeking variety: A dynamic model of employee blog reading behavior. Available at SSRN 1617405.
Markus Steinberger, Manuela Waldner, Marc Streit, Alexander Lex, and Dieter Schmalstieg. 2011. Context-preserving visual links. IEEE Trans. Visu-alization & Comp. Graphics, 17(12):2249–2258. Maite Taboada, Julian Brooke, Milan Tofiloski,
Kim-berly Voll, and Manfred Stede. 2011. Lexicon-based methods for sentiment analysis. Computa-tional linguistics, 37(2):267–307.
Gina Danielle Venolia and Carman Neustaedter. 2003. Understanding sequence and reply relationships within email conversations: a mixed-model visual-ization. InProc. of CHI, pages 361–368.
Fernanda B Vi´egas, Scott Golder, and Judith Donath. 2006. Visualizing email content: portraying rela-tionships from conversational histories. InProc. of CHI, pages 979–988.
Martin Wattenberg and David Millen. 2003. Conver-sation thumbnails for large-scale discussions. In ex-tended abstracts on CHI, pages 742–743.
Furu Wei, Shixia Liu, Yangqiu Song, Shimei Pan, Michelle X Zhou, Weihong Qian, Lei Shi, Li Tan, and Qiang Zhang. 2010. Tiara: a visual exploratory text analytic system. InProc. ACM Conf. on Knowl-edge Discovery and Data Mining, pages 153–162. Ka-Ping Yee and Marti Hearst. 2005.
Content-centered discussion mapping. Online Deliberation 2005/DIAC-2005.